Estimated zip code population in 2022: 1,167 Zip code population in 2010: 1,228 Zip code population in 2000: 1,058
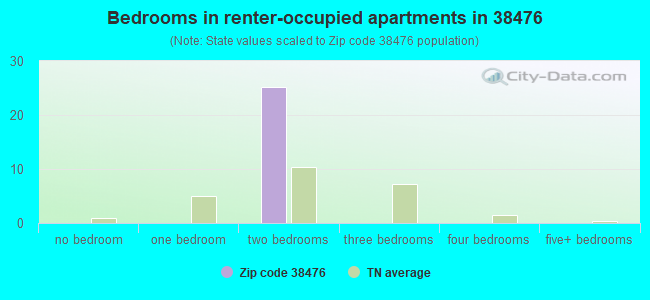
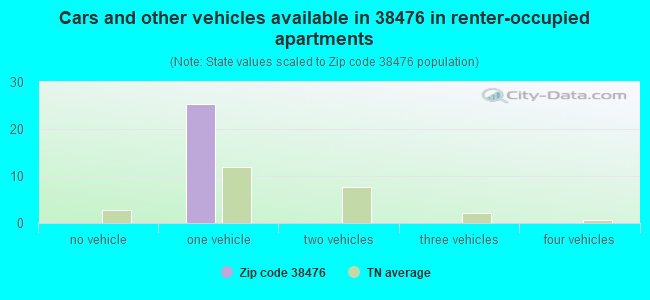
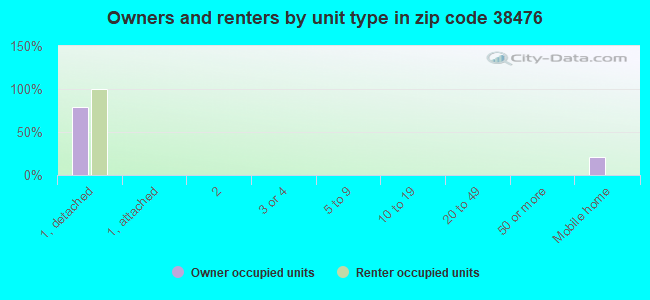
Houses and condos: 448 Renter-occupied apartments: 25
% of renters here:
8%
State:
33%
March 2022 cost of living index in zip code 38476: 76.1 (low, U.S. average is 100)
Land area: 41.7 sq. mi. Water area: 0.0 sq. mi.
Population density: 28 people per square mile
(very low).
OSM Map
General Map
Google Map
MSN Map
OSM Map
General Map
Google Map
MSN Map
OSM Map
General Map
Google Map
MSN Map
OSM Map
General Map
Google Map
MSN Map
Please wait while loading the map...
Real estate property taxes paid for housing units in 2022:
This zip code:
0.6% ($1,619)
Tennessee:
0.5% ($1,376)
Median real estate property taxes paid for housing units with mortgages in 2022: $2,044 Median real estate property taxes paid for housing units with no mortgage in 2022: $1,607
Business Search- 14 Million verified businesses
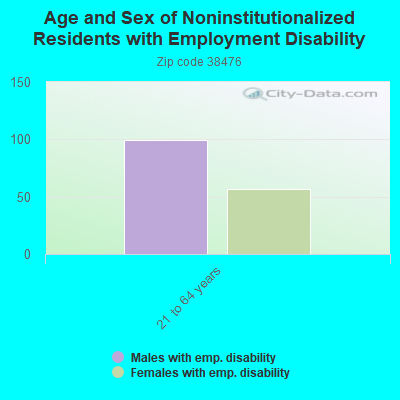
Males: 648
(55.6%)
Females: 518
(44.4%)
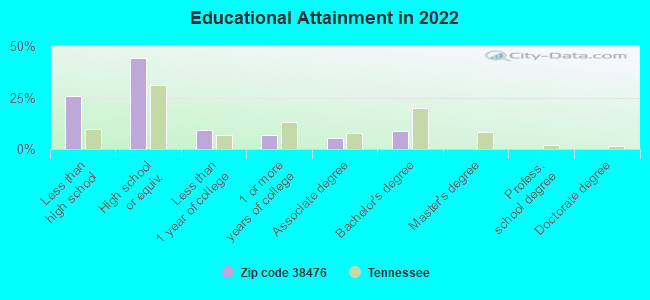
For population 25 years and over in 38476:
High school or higher: 71.6%
Bachelor's degree or higher: 8.4%
Graduate or professional degree: 0.0%
Mean travel time to work (commute): 34.3 minutes
For population 15 years and over in 38476:
Never married: 28.9%
Now married: 62.2%
Separated: 0.0%
Widowed: 4.6%
Divorced: 4.4%
Zip code 38476 compared to state average:
Median household income above state average.
Unemployed percentage significantly below state average.
Black race population percentage significantly below state average.
Hispanic race population percentage significantly below state average.
Foreign-born population percentage significantly below state average.
Renting percentage significantly below state average.
Length of stay since moving in significantly above state average.
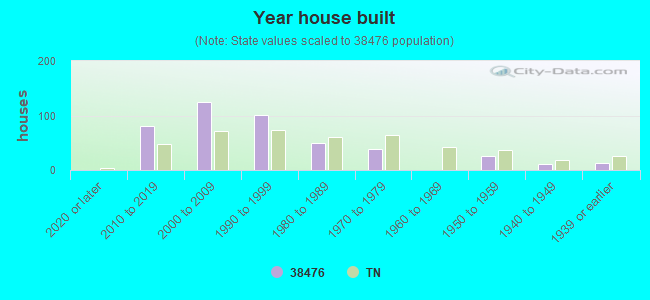
House age below state average.
Number of college students below state average.
Percentage of population with a bachelor's degree or higher significantly below state average.
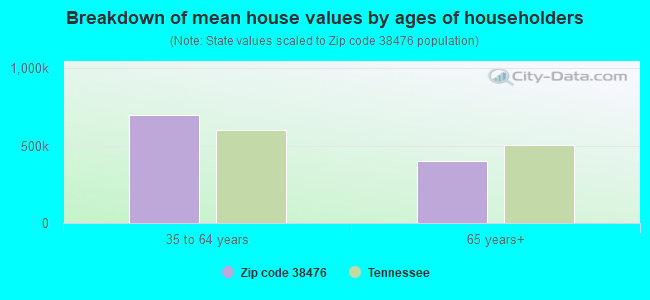
Estimated median house/condo value in 2022: $276,088
38476:
$276,088
Tennessee:
$284,800
Median resident age:
This zip code:
42.2 years
Tennessee median age:
39.2 years
Average household size:
This zip code:
3.7 people
Tennessee:
2.4 people
Averages for the 2020 tax year for zip code 38476, filed in 2021:
Average Adjusted Gross Income (AGI) in 2020: $86,210 (Individual Income Tax Returns)
Here:
$86,210
State:
$69,014
Salary/wage: $63,452 (reported on 73.3% of returns)
Here:
$63,452
State:
$55,872
(% of AGI for various income ranges: 1156.4% for AGIs below $25k, 3760.0% for AGIs $25k-50k, 6122.9% for AGIs $50k-75k, 10350.0% for AGIs $75k-100k, 12331.7% for AGIs $100k-200k)
Taxable interest for individuals: $776 (reported on 28.3% of returns)
This zip code:
$776
Tennessee:
$1,945
(% of AGI for various income ranges: 5.5% for AGIs below $25k, 16.4% for AGIs $25k-50k, 21.4% for AGIs $50k-75k, 13.3% for AGIs $75k-100k, 100.0% for AGIs $100k-200k)
Ordinary dividends: $4,975 (reported on 13.3% of returns)
Here:
$4,975
State:
$8,105
(% of AGI for various income ranges: 41.8% for AGIs $25k-50k, 216.7% for AGIs $75k-100k)
Net capital gain/loss in AGI: +$14,088 (reported on 13.3% of returns)
Here:
+$14,088
State:
+$33,664
(% of AGI for various income ranges: 20.9% for AGIs $25k-50k, 1840.0% for AGIs $100k-200k)
Profit/loss from business: +$24,920 (reported on 25.0% of returns)
Here:
+$24,920
State:
+$18,991
(% of AGI for various income ranges: 356.4% for AGIs below $25k, 471.8% for AGIs $25k-50k, 1280.0% for AGIs $50k-75k, 3218.3% for AGIs $100k-200k)
Taxable individual retirement arrangement distribution: $19,075 (reported on 6.7% of returns)
38476:
$19,075
Tennessee:
$20,036
(% of AGI for various income ranges: 693.6% for AGIs $25k-50k)
Total itemized deductions: $34,650 (reported on 6.7% of returns)
Here:
$34,650
State:
$40,136
(% of AGI for various income ranges: 2310.0% for AGIs $100k-200k)
Charity contributions: $14,533 (reported on 5.0% of returns)
Here:
$14,533
State:
$19,852
(% of AGI for various income ranges: 726.7% for AGIs $100k-200k)
Taxes paid: $5,933 (reported on 5.0% of returns)
38476:
$5,933
State:
$6,038
(% of AGI for various income ranges: 296.7% for AGIs $100k-200k)
Earned income credit: $1,862 (reported on 13.3% of returns)
Here:
$1,862
State:
$2,391
(% of AGI for various income ranges: 80.9% for AGIs below $25k, 54.5% for AGIs $25k-50k)
Percentage of individuals using paid preparers for their 2020 taxes: 86.7%
Here:
87%
State:
93%
(% for various income ranges: 85.0% for AGIs below $25k, 86.7% for AGIs $25k-50k, 88.9% for AGIs $50k-75k, 80.0% for AGIs $75k-100k, 100.0% for AGIs $100k-200k, 75.0% for AGIs over 200k)
Averages for the 2012 tax year for zip code 38476, filed in 2013:
Average Adjusted Gross Income (AGI) in 2012: $53,813 (Individual Income Tax Returns)
Here:
$53,813
State:
$53,767
Salary/wage: $45,718 (reported on 83.0% of returns)
Here:
$45,718
State:
$45,421
(% of AGI for various income ranges: 67.8% for AGIs below $25k, 75.5% for AGIs $25k-50k, 77.5% for AGIs $50k-75k, 81.0% for AGIs $75k-100k, 61.9% for AGIs $100k-200k)
Taxable interest for individuals: $747 (reported on 36.2% of returns)
This zip code:
$747
Tennessee:
$1,732
(% of AGI for various income ranges: 0.8% for AGIs below $25k, 0.8% for AGIs $25k-50k, 0.8% for AGIs $50k-75k, 0.7% for AGIs $75k-100k)
Ordinary dividends: $1,217 (reported on 12.8% of returns)
Here:
$1,217
State:
$6,739
Profit/loss from business: +$10,809 (reported on 23.4% of returns)
Here:
+$10,809
State:
+$15,240
(% of AGI for various income ranges: 20.9% for AGIs below $25k, 6.2% for AGIs $25k-50k, 10.1% for AGIs $50k-75k)
Taxable individual retirement arrangement distribution: $15,200 (reported on 6.4% of returns)
38476:
$15,200
Tennessee:
$15,505
Total itemized deductions: $18,900 (16% of AGI, reported on 21.3% of returns)
Here:
$18,900
State:
$21,976
Here:
15.9% of AGI
State:
17.8% of AGI
(% of AGI for various income ranges: 9.7% for AGIs $25k-50k, 16.0% for AGIs $50k-75k, 7.3% for AGIs $100k-200k)
Charity contributions: $3,900 (reported on 14.9% of returns)
Here:
$3,900
State:
$6,709
Taxes paid: $3,420 (reported on 21.3% of returns)
38476:
$3,420
State:
$4,829
(% of AGI for various income ranges: 1.5% for AGIs $25k-50k, 2.7% for AGIs $50k-75k, 1.5% for AGIs $100k-200k)
Earned income credit: $2,250 (reported on 21.3% of returns)
Here:
$2,250
State:
$2,404
(% of AGI for various income ranges: 7.6% for AGIs below $25k, 1.3% for AGIs $25k-50k)
Percentage of individuals using paid preparers for their 2012 taxes: 51.1%
Here:
51%
State:
52%
(% for various income ranges: 50.0% for AGIs below $25k, 50.0% for AGIs $25k-50k, 57.1% for AGIs $50k-75k, 40.0% for AGIs $75k-100k, 60.0% for AGIs $100k-200k)
Averages for the 2004 tax year for zip code 38476, filed in 2005:
Average Adjusted Gross Income (AGI) in 2004: $45,593 (Individual Income Tax Returns)
Here:
$45,593
State:
$44,088
Salary/wage: $36,407 (reported on 82.0% of returns)
Here:
$36,407
State:
$38,825
(% of AGI for various income ranges: 83.2% for AGIs below $10k, 76.4% for AGIs $10k-25k, 89.3% for AGIs $25k-50k, 88.9% for AGIs $50k-75k, 87.5% for AGIs $75k-100k, 29.8% for AGIs over 100k)
Taxable interest for individuals: $914 (reported on 36.5% of returns)
This zip code:
$914
Tennessee:
$1,802
(% of AGI for various income ranges: 6.7% for AGIs below $10k, 0.7% for AGIs $10k-25k, 0.3% for AGIs $25k-50k, 0.6% for AGIs $50k-75k, 0.1% for AGIs $75k-100k, 0.9% for AGIs over 100k)
Taxable dividends: $730 (reported on 13.2% of returns)
Here:
$730
State:
$3,727
(% of AGI for various income ranges: 0.3% for AGIs $10k-25k, 0.1% for AGIs $25k-50k, 0.3% for AGIs $50k-75k, 0.3% for AGIs over 100k)
Net capital gain/loss: +$44,815 (reported on 11.3% of returns)
Here:
+$44,815
State:
+$15,776
(% of AGI for various income ranges: 1.1% for AGIs $10k-25k, 0.0% for AGIs $50k-75k, 29.4% for AGIs over 100k)
Profit/loss from business: +$6,865 (reported on 23.2% of returns)
Here:
+$6,865
State:
+$12,882
(% of AGI for various income ranges: 7.0% for AGIs below $10k, 15.0% for AGIs $10k-25k, 6.0% for AGIs $25k-50k, 3.4% for AGIs $50k-75k, 1.1% for AGIs $75k-100k)
Total itemized deductions: $15,120 (20% of AGI, reported on 17.3% of returns)
Here:
$15,120
State:
$18,035
Here:
20.0% of AGI
State:
19.9% of AGI
(% of AGI for various income ranges: 25.5% for AGIs below $10k, 4.3% for AGIs $25k-50k, 6.5% for AGIs $50k-75k, 11.0% for AGIs $75k-100k, 4.9% for AGIs over 100k)
Charity contributions deductions: $2,540 (3% of AGI, reported on 13.2% of returns)
Here:
$2,540
State:
$5,167
Here:
3.1% of AGI
State:
5.3% of AGI
(% of AGI for various income ranges: 0.7% for AGIs $25k-50k, 0.9% for AGIs $50k-75k, 1.4% for AGIs $75k-100k, 0.7% for AGIs over 100k)
Total tax: $6,000 (reported on 78.3% of returns)
38476:
$6,000
State:
$7,482
(% of AGI for various income ranges: 6.5% for AGIs below $10k, 5.4% for AGIs $10k-25k, 6.9% for AGIs $25k-50k, 9.0% for AGIs $50k-75k, 11.8% for AGIs $75k-100k, 13.7% for AGIs over 100k)
Earned income credit: $1,742 (reported on 18.6% of returns)
Here:
$1,742
State:
$1,826
Percentage of individuals using paid preparers for their 2004 taxes: 55.9%
Here:
56%
State:
60%
(% for various income ranges: 50.9% for AGIs below $10k, 57.5% for AGIs $10k-25k, 53.8% for AGIs $25k-50k, 59.5% for AGIs $50k-75k, 62.1% for AGIs $75k-100k, 64.3% for AGIs over 100k)
Household received Food Stamps/SNAP in the past 12 months: 2 Household did not receive Food Stamps/SNAP in the past 12 months: 314
Women who did not have a birth in the past 12 months: 248 (161 now married, 86 unmarried)
Housing units in zip code 38476 with a mortgage: 201 Median monthly owner costs for units with a mortgage: $1,598 Median monthly owner costs for units without a mortgage: $378
Residents with income below the poverty level in 2022:
This zip code:
2.0%
Whole state:
13.3%
Residents with income below 50% of the poverty level in 2022:
This zip code:
1.9%
Whole state:
7.1%
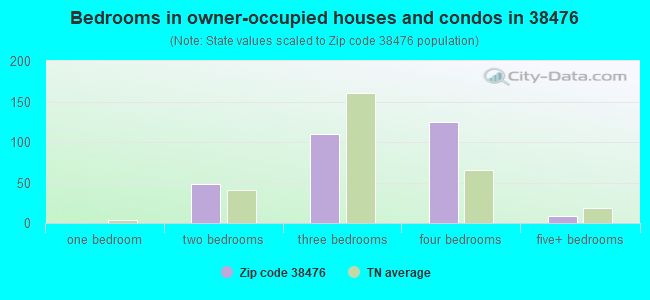
Median number of rooms in houses and condos:
Here:
6.5
State:
6.5
Notable locations in this zip code not listed on our city pages
Churches in zip code 38476 include: Mount Pleasant Church (A), George Chapel (B), Beech Valley Church (C), Shady Grove Church (D). Display/hide their locations on the map
Cemeteries: Johnson Cemetery (1), Jones Cemetery (2), Warf Cemetery (3), Kelley Cemetery (4), Kinderhook Cemetery (5), Byrd Cemetery (6), Baker Cemetery (7). Display/hide their locations on the map
Streams, rivers, and creeks: Little Dam Branch (A), Kelley Branch (B), Tatum Creek (C), Gin Branch (D), Fort Cooper Creek (E), Edwards Branch (F), Dog Creek (G), Daniel Branch (H), Craig Branch (I). Display/hide their locations on the map
Size of family households: 94 2-persons, 11 3-persons, 83 4-persons, 61 7-or-more-persons
Size of nonfamily households: 65 1-person
277 married couples with children.
0 single-parent households ().
99.0% of residents of 38476 zip code speak English at home.
0.8% of residents speak other Indo-European language at home (100% very well).
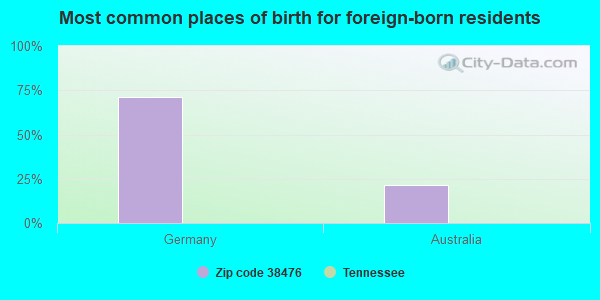
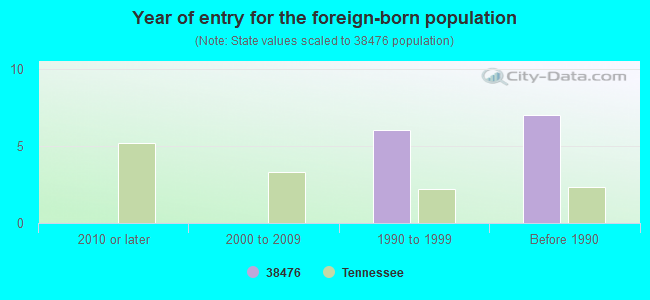
Foreign born population: 14 (1.3%) (56.8% of them are naturalized citizens)
This zip code:
1.3%
Whole state:
5.6%
71%Germany
21%Australia
40%German
19%European
14%Norwegian
11%Swiss
3%American
3%French
1%Dutch
Year of entry for the foreign-born population
02010 or later
02000 to 2009
61990 to 1999
7Before 1990
Facilities with environmental interests located in this zip code:
C & D LABS (D81 in PRIMM SPRINGS, TN)
(Resource Conservation and Recovery Act (tracking hazardous waste))
Housing units lacking complete kitchen facilities: 3.7%
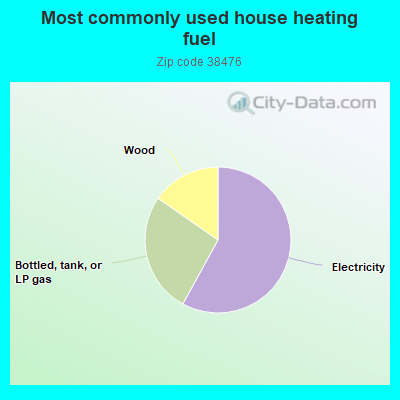
58.3%Electricity
26.8%Bottled, tank, or LP gas
15.4%Wood
Population in 1990: 346. Population change in the 1990s: +712 (+205.8%).
Place of birth for U.S.-born residents:
This state: 773
Northeast: 128
Midwest: 22
South: 127
West: 106
61% of the 38476 zip code residents lived in the same house 5 years ago. Out of people who lived in different houses, 6% lived in this county. Out of people who lived in different counties, 50% lived in Tennessee.
101% of the 38476 zip code residents lived in the same house 1 year ago.
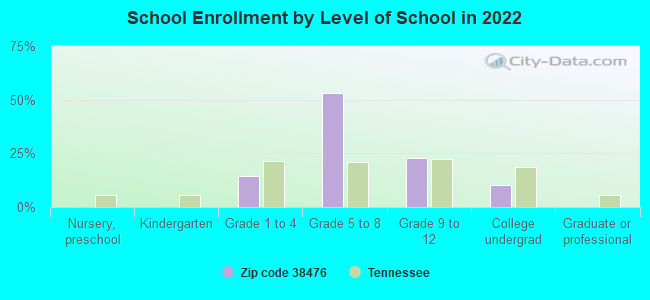
Private vs. public school enrollment:
Students in private schools in grades 1 to 8 (elementary and middle school): 227
Here:
100.0%
Tennessee:
15.0%
Students in private schools in grades 9 to 12 (high school): 74
Here:
100.0%
Tennessee:
16.2%
Students in private undergraduate colleges: 31
Here:
100.0%
Tennessee:
23.5%
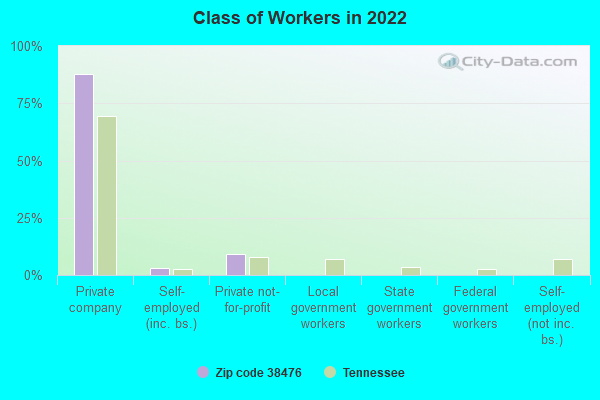
Top industries in this zip code by the number of employees in 2005:
Administrative and Support and Waste Management and Remediation Services: Janitorial Services (5-9 employees: 1 establishment)
Construction: Power and Communication Line and Related Structures Construction (5-9: 1)
Information: Record Production (1-4: 1)
Construction: Flooring Contractors (1-4: 1)
Fatal accident statistics in 2013:
Fatal accident count: 2
Vehicles involved in fatal accidents: 3
Fatal accidents caused by drunken drivers: 0
Fatalities: 2
Persons involved in fatal accidents: 3
Pedestrians involved in fatal accidents: 0
Home Mortgage Disclosure Act Aggregated Statistics For Year 2009 (Based on 2 partial tracts)
A) FHA, FSA/RHS & VA Home Purchase Loans
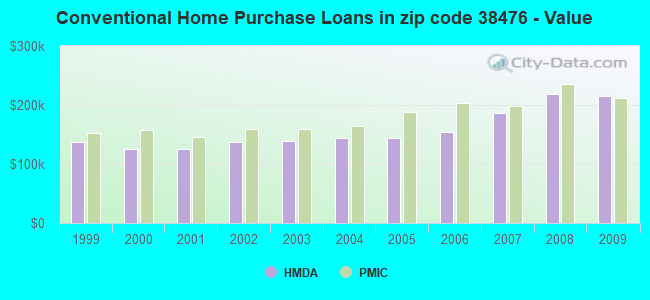
B) Conventional Home Purchase Loans
C) Refinancings
D) Home Improvement Loans
F) Non-occupant Loans on < 5 Family Dwellings (A B C & D)
G) Loans On Manufactured Home Dwelling (A B C & D)
Number
Average Value
Number
Average Value
Number
Average Value
Number
Average Value
Number
Average Value
Number
Average Value
LOANS ORIGINATED
63
$206,650
56
$216,099
268
$201,554
5
$93,250
10
$189,326
0
$0
APPLICATIONS APPROVED, NOT ACCEPTED
1
$265,520
3
$225,250
18
$206,383
1
$118,630
1
$164,430
0
$0
APPLICATIONS DENIED
4
$223,930
4
$212,662
70
$217,138
2
$80,265
3
$128,133
1
$47,990
APPLICATIONS WITHDRAWN
10
$216,219
11
$233,590
56
$224,608
2
$53,470
3
$163,373
0
$0
FILES CLOSED FOR INCOMPLETENESS
1
$231,910
1
$310,350
11
$217,269
1
$171,490
1
$88,670
0
$0
Aggregated Statistics For Year 2008 (Based on 2 partial tracts)
A) FHA, FSA/RHS & VA Home Purchase Loans
B) Conventional Home Purchase Loans
C) Refinancings
D) Home Improvement Loans
F) Non-occupant Loans on < 5 Family Dwellings (A B C & D)
G) Loans On Manufactured Home Dwelling (A B C & D)
Number
Average Value
Number
Average Value
Number
Average Value
Number
Average Value
Number
Average Value
Number
Average Value
LOANS ORIGINATED
45
$210,016
93
$218,182
152
$194,188
10
$78,342
28
$213,933
2
$105,600
APPLICATIONS APPROVED, NOT ACCEPTED
1
$123,260
5
$227,522
11
$190,163
1
$48,720
2
$181,480
0
$0
APPLICATIONS DENIED
7
$187,711
11
$186,686
67
$206,889
7
$42,596
4
$201,822
2
$70,645
APPLICATIONS WITHDRAWN
6
$216,073
14
$248,629
32
$195,405
1
$95,980
3
$179,370
0
$0
FILES CLOSED FOR INCOMPLETENESS
1
$231,660
2
$241,895
9
$226,954
1
$110,350
0
$0
0
$0
Aggregated Statistics For Year 2007 (Based on 2 partial tracts)
A) FHA, FSA/RHS & VA Home Purchase Loans
B) Conventional Home Purchase Loans
C) Refinancings
D) Home Improvement Loans
F) Non-occupant Loans on < 5 Family Dwellings (A B C & D)
G) Loans On Manufactured Home Dwelling (A B C & D)
Number
Average Value
Number
Average Value
Number
Average Value
Number
Average Value
Number
Average Value
Number
Average Value
LOANS ORIGINATED
20
$195,976
238
$186,123
149
$188,389
20
$65,991
25
$238,738
3
$117,333
APPLICATIONS APPROVED, NOT ACCEPTED
0
$0
23
$155,544
27
$181,717
6
$61,672
4
$157,245
0
$0
APPLICATIONS DENIED
1
$215,340
24
$209,547
83
$206,332
16
$60,367
4
$202,920
1
$140,310
APPLICATIONS WITHDRAWN
2
$237,025
23
$185,687
36
$181,773
3
$66,420
3
$172,143
0
$0
FILES CLOSED FOR INCOMPLETENESS
1
$157,370
3
$230,203
12
$204,157
0
$0
1
$173,200
0
$0
Aggregated Statistics For Year 2006 (Based on 2 partial tracts)
A) FHA, FSA/RHS & VA Home Purchase Loans
B) Conventional Home Purchase Loans
C) Refinancings
D) Home Improvement Loans
F) Non-occupant Loans on < 5 Family Dwellings (A B C & D)
G) Loans On Manufactured Home Dwelling (A B C & D)
Number
Average Value
Number
Average Value
Number
Average Value
Number
Average Value
Number
Average Value
Number
Average Value
LOANS ORIGINATED
21
$181,157
304
$153,933
140
$160,839
19
$63,015
48
$140,780
4
$91,532
APPLICATIONS APPROVED, NOT ACCEPTED
1
$137,150
28
$148,752
25
$149,756
4
$28,258
4
$156,452
1
$82,580
APPLICATIONS DENIED
2
$162,240
37
$143,592
84
$165,680
21
$55,297
5
$131,642
3
$83,637
APPLICATIONS WITHDRAWN
1
$230,930
39
$145,442
65
$169,340
4
$86,722
3
$127,320
0
$0
FILES CLOSED FOR INCOMPLETENESS
0
$0
5
$184,746
10
$176,927
1
$57,000
0
$0
0
$0
Aggregated Statistics For Year 2005 (Based on 2 partial tracts)
A) FHA, FSA/RHS & VA Home Purchase Loans
B) Conventional Home Purchase Loans
C) Refinancings
D) Home Improvement Loans
F) Non-occupant Loans on < 5 Family Dwellings (A B C & D)
G) Loans On Manufactured Home Dwelling (A B C & D)
Number
Average Value
Number
Average Value
Number
Average Value
Number
Average Value
Number
Average Value
Number
Average Value
LOANS ORIGINATED
32
$175,993
313
$144,637
141
$152,350
9
$60,331
32
$132,458
3
$82,743
APPLICATIONS APPROVED, NOT ACCEPTED
1
$148,110
26
$132,912
30
$147,167
2
$81,240
3
$174,660
1
$78,440
APPLICATIONS DENIED
4
$174,722
30
$125,478
84
$159,445
11
$42,542
4
$150,485
2
$74,785
APPLICATIONS WITHDRAWN
4
$169,728
32
$151,527
75
$164,836
4
$90,985
3
$142,830
2
$78,075
FILES CLOSED FOR INCOMPLETENESS
1
$187,330
9
$110,513
12
$147,561
1
$74,300
1
$122,530
0
$0
Aggregated Statistics For Year 2004 (Based on 2 partial tracts)
A) FHA, FSA/RHS & VA Home Purchase Loans
B) Conventional Home Purchase Loans
C) Refinancings
D) Home Improvement Loans
F) Non-occupant Loans on < 5 Family Dwellings (A B C & D)
G) Loans On Manufactured Home Dwelling (A B C & D)
Number
Average Value
Number
Average Value
Number
Average Value
Number
Average Value
Number
Average Value
Number
Average Value
LOANS ORIGINATED
60
$156,619
245
$143,853
128
$152,414
9
$89,158
19
$154,519
3
$78,600
APPLICATIONS APPROVED, NOT ACCEPTED
2
$201,580
22
$136,261
25
$154,140
3
$23,547
2
$87,450
3
$70,077
APPLICATIONS DENIED
6
$164,715
31
$145,893
68
$146,239
15
$34,299
3
$117,010
3
$74,460
APPLICATIONS WITHDRAWN
5
$162,968
29
$151,788
46
$160,977
2
$67,355
2
$221,430
1
$81,850
FILES CLOSED FOR INCOMPLETENESS
1
$95,250
6
$129,555
10
$148,158
0
$0
0
$0
0
$0
Aggregated Statistics For Year 2003 (Based on 2 partial tracts)
A) FHA, FSA/RHS & VA Home Purchase Loans
B) Conventional Home Purchase Loans
C) Refinancings
D) Home Improvement Loans
F) Non-occupant Loans on < 5 Family Dwellings (A B C & D)
Number
Average Value
Number
Average Value
Number
Average Value
Number
Average Value
Number
Average Value
LOANS ORIGINATED
67
$152,635
162
$138,903
269
$143,570
12
$31,627
10
$140,143
APPLICATIONS APPROVED, NOT ACCEPTED
2
$192,690
14
$142,454
30
$141,312
2
$27,890
0
$0
APPLICATIONS DENIED
7
$148,666
18
$144,536
57
$132,848
5
$17,394
2
$208,400
APPLICATIONS WITHDRAWN
5
$170,714
16
$145,384
43
$154,086
1
$41,170
1
$101,820
FILES CLOSED FOR INCOMPLETENESS
0
$0
4
$155,478
10
$139,339
1
$14,620
0
$0
Aggregated Statistics For Year 2002 (Based on 2 partial tracts)
A) FHA, FSA/RHS & VA Home Purchase Loans
B) Conventional Home Purchase Loans
C) Refinancings
D) Home Improvement Loans
F) Non-occupant Loans on < 5 Family Dwellings (A B C & D)
Number
Average Value
Number
Average Value
Number
Average Value
Number
Average Value
Number
Average Value
LOANS ORIGINATED
50
$150,628
103
$137,535
158
$143,522
6
$40,478
10
$104,577
APPLICATIONS APPROVED, NOT ACCEPTED
2
$136,905
8
$134,741
19
$145,429
1
$13,890
0
$0
APPLICATIONS DENIED
5
$158,828
12
$147,338
43
$123,811
5
$33,860
0
$0
APPLICATIONS WITHDRAWN
3
$129,270
9
$134,792
20
$143,212
1
$65,040
1
$171,250
FILES CLOSED FOR INCOMPLETENESS
1
$107,180
5
$146,598
7
$152,494
0
$0
0
$0
Aggregated Statistics For Year 2001 (Based on 2 partial tracts)
A) FHA, FSA/RHS & VA Home Purchase Loans
B) Conventional Home Purchase Loans
C) Refinancings
D) Home Improvement Loans
F) Non-occupant Loans on < 5 Family Dwellings (A B C & D)
Number
Average Value
Number
Average Value
Number
Average Value
Number
Average Value
Number
Average Value
LOANS ORIGINATED
48
$148,855
81
$124,937
124
$139,705
7
$20,114
4
$96,282
APPLICATIONS APPROVED, NOT ACCEPTED
0
$0
7
$100,607
15
$115,125
1
$26,310
0
$0
APPLICATIONS DENIED
2
$143,600
8
$115,528
37
$107,151
4
$33,922
1
$131,060
APPLICATIONS WITHDRAWN
2
$123,505
5
$117,074
16
$117,141
0
$0
0
$0
FILES CLOSED FOR INCOMPLETENESS
0
$0
1
$42,140
5
$123,700
0
$0
0
$0
Aggregated Statistics For Year 2000 (Based on 2 partial tracts)
A) FHA, FSA/RHS & VA Home Purchase Loans
B) Conventional Home Purchase Loans
C) Refinancings
D) Home Improvement Loans
F) Non-occupant Loans on < 5 Family Dwellings (A B C & D)
Number
Average Value
Number
Average Value
Number
Average Value
Number
Average Value
Number
Average Value
LOANS ORIGINATED
30
$150,837
62
$125,450
22
$115,655
4
$13,215
2
$85,380
APPLICATIONS APPROVED, NOT ACCEPTED
1
$126,180
6
$108,362
6
$131,382
1
$36,050
0
$0
APPLICATIONS DENIED
3
$122,937
13
$76,940
28
$98,031
4
$29,720
1
$152,980
APPLICATIONS WITHDRAWN
3
$171,090
8
$124,875
12
$165,506
2
$24,480
0
$0
FILES CLOSED FOR INCOMPLETENESS
0
$0
2
$107,670
4
$80,935
0
$0
0
$0
Aggregated Statistics For Year 1999 (Based on 1 partial tract)
A) FHA, FSA/RHS & VA Home Purchase Loans
B) Conventional Home Purchase Loans
C) Refinancings
D) Home Improvement Loans
F) Non-occupant Loans on < 5 Family Dwellings (A B C & D)

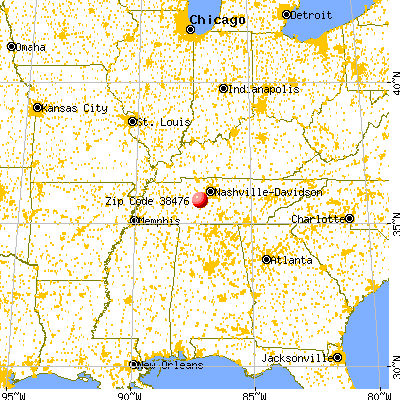


 Nearest zip codes: 38482, 37098, 38487, 37025, 37062, 38454.