Estimated zip code population in 2022: 2,712 Zip code population in 2010: 2,772 Zip code population in 2000: 2,406
Houses and condos: 1,267 Renter-occupied apartments: 167
% of renters here:
16%
State:
33%
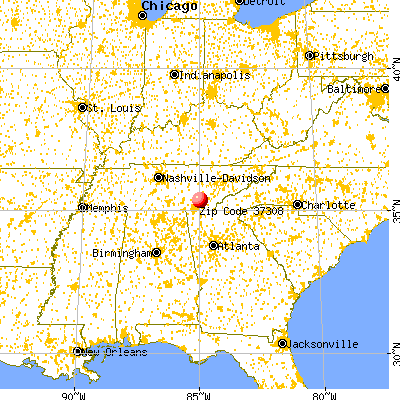
March 2022 cost of living index in zip code 37308: 79.6 (low, U.S. average is 100)
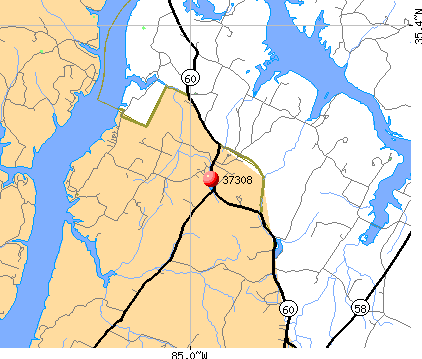
Land area: 36.7 sq. mi. Water area: 6.2 sq. mi.
Population density: 74 people per square mile
(very low).
OSM Map
General Map
Google Map
MSN Map
OSM Map
General Map
Google Map
MSN Map
OSM Map
General Map
Google Map
MSN Map
OSM Map
General Map
Google Map
MSN Map
Please wait while loading the map...
Real estate property taxes paid for housing units in 2022:
This zip code:
0.4% ($992)
Tennessee:
0.5% ($1,376)
Median real estate property taxes paid for housing units with mortgages in 2022: $1,214 (0.4%) Median real estate property taxes paid for housing units with no mortgage in 2022: $640 (0.3%)
Business Search- 14 Million verified businesses
Males: 1,392
(51.4%)
Females: 1,319
(48.6%)
For population 25 years and over in 37308:
High school or higher: 80.4%
Bachelor's degree or higher: 13.0%
Graduate or professional degree: 4.5%
Unemployed: 2.5%
Mean travel time to work (commute): 35.8 minutes
For population 15 years and over in 37308:
Never married: 16.9%
Now married: 51.3%
Separated: 0.6%
Widowed: 10.5%
Divorced: 20.6%
Zip code 37308 compared to state average:
Black race population percentage significantly below state average.
Hispanic race population percentage significantly below state average.
Foreign-born population percentage significantly below state average.
Renting percentage below state average.
Length of stay since moving in significantly below state average.
House age below state average.
Percentage of population with a bachelor's degree or higher significantly below state average.
Estimated median house/condo value in 2022: $261,977
37308:
$261,977
Tennessee:
$284,800
According to our research of Tennessee and other state lists, there were 3 registered sex offenders living in 37308 zip code as of May 28, 2024. The ratio of all residents to sex offenders in zip code 37308 is 966 to 1. The ratio of registered sex offenders to all residents in this zip code is much lower than the state average.
Median resident age:
This zip code:
38.7 years
Tennessee median age:
39.2 years
Average household size:
This zip code:
2.5 people
Tennessee:
2.4 people
Averages for the 2020 tax year for zip code 37308, filed in 2021:
Average Adjusted Gross Income (AGI) in 2020: $55,760 (Individual Income Tax Returns)
Here:
$55,760
State:
$69,014
Salary/wage: $51,612 (reported on 80.6% of returns)
Here:
$51,612
State:
$55,872
(% of AGI for various income ranges: 1034.1% for AGIs below $25k, 3543.3% for AGIs $25k-50k, 6344.7% for AGIs $50k-75k, 9076.4% for AGIs $75k-100k, 14327.3% for AGIs $100k-200k)
Taxable interest for individuals: $753 (reported on 23.9% of returns)
This zip code:
$753
Tennessee:
$1,945
(% of AGI for various income ranges: 8.5% for AGIs below $25k, 17.0% for AGIs $25k-50k, 11.8% for AGIs $50k-75k, 33.6% for AGIs $75k-100k, 79.1% for AGIs $100k-200k)
Ordinary dividends: $2,747 (reported on 12.7% of returns)
Here:
$2,747
State:
$8,105
(% of AGI for various income ranges: 8.5% for AGIs below $25k, 45.9% for AGIs $25k-50k, 6.5% for AGIs $50k-75k, 44.5% for AGIs $75k-100k, 230.9% for AGIs $100k-200k)
Net capital gain/loss in AGI: +$3,021 (reported on 10.4% of returns)
Here:
+$3,021
State:
+$33,664
(% of AGI for various income ranges: 3.5% for AGIs below $25k, 11.1% for AGIs $25k-50k, 10.9% for AGIs $75k-100k, 335.5% for AGIs $100k-200k)
Profit/loss from business: +$11,827 (reported on 16.4% of returns)
Here:
+$11,827
State:
+$18,991
(% of AGI for various income ranges: 232.6% for AGIs below $25k, 191.1% for AGIs $25k-50k, 188.8% for AGIs $50k-75k, 259.1% for AGIs $75k-100k, 626.4% for AGIs $100k-200k)
Taxable individual retirement arrangement distribution: $21,640 (reported on 7.5% of returns)
37308:
$21,640
Tennessee:
$20,036
(% of AGI for various income ranges: 30.9% for AGIs below $25k, 177.8% for AGIs $25k-50k, 1435.5% for AGIs $75k-100k)
Total itemized deductions: $38,733 (reported on 2.2% of returns)
Here:
$38,733
State:
$40,136
(% of AGI for various income ranges: 1056.4% for AGIs $100k-200k)
Charity contributions: $9,267 (reported on 2.2% of returns)
Here:
$9,267
State:
$19,852
(% of AGI for various income ranges: 163.5% for AGIs $50k-75k)
Taxes paid: $5,200 (reported on 2.2% of returns)
37308:
$5,200
State:
$6,038
(% of AGI for various income ranges: 141.8% for AGIs $100k-200k)
Earned income credit: $2,254 (reported on 19.4% of returns)
Here:
$2,254
State:
$2,391
(% of AGI for various income ranges: 107.6% for AGIs below $25k, 81.5% for AGIs $25k-50k)
Percentage of individuals using paid preparers for their 2020 taxes: 94.8%
Here:
95%
State:
93%
(% for various income ranges: 93.5% for AGIs below $25k, 97.0% for AGIs $25k-50k, 95.2% for AGIs $50k-75k, 93.3% for AGIs $75k-100k, 93.8% for AGIs $100k-200k, 100.0% for AGIs over 200k)
Averages for the 2012 tax year for zip code 37308, filed in 2013:
Average Adjusted Gross Income (AGI) in 2012: $44,008 (Individual Income Tax Returns)
Here:
$44,008
State:
$53,767
Salary/wage: $39,690 (reported on 87.0% of returns)
Here:
$39,690
State:
$45,421
(% of AGI for various income ranges: 73.0% for AGIs below $25k, 82.3% for AGIs $25k-50k, 84.9% for AGIs $50k-75k, 82.8% for AGIs $75k-100k, 67.0% for AGIs $100k-200k)
Taxable interest for individuals: $592 (reported on 21.7% of returns)
This zip code:
$592
Tennessee:
$1,732
(% of AGI for various income ranges: 0.4% for AGIs below $25k, 0.4% for AGIs $25k-50k, 0.2% for AGIs $75k-100k, 0.4% for AGIs $100k-200k)
Ordinary dividends: $2,582 (reported on 9.6% of returns)
Here:
$2,582
State:
$6,739
(% of AGI for various income ranges: 0.3% for AGIs below $25k, 0.5% for AGIs $25k-50k, 0.9% for AGIs $50k-75k, 0.9% for AGIs $100k-200k)
Net capital gain/loss in AGI: +$5,062 (reported on 7.0% of returns)
Here:
+$5,062
State:
+$19,082
(% of AGI for various income ranges: 3.6% for AGIs $100k-200k)
Profit/loss from business: +$9,022 (reported on 15.7% of returns)
Here:
+$9,022
State:
+$15,240
(% of AGI for various income ranges: 9.6% for AGIs below $25k, 3.2% for AGIs $25k-50k, 2.8% for AGIs $50k-75k, 3.8% for AGIs $75k-100k)
Taxable individual retirement arrangement distribution: $12,812 (reported on 7.0% of returns)
37308:
$12,812
Tennessee:
$15,505
(% of AGI for various income ranges: 2.7% for AGIs below $25k, 3.2% for AGIs $25k-50k, 5.0% for AGIs $75k-100k)
Total itemized deductions: $18,957 (24% of AGI, reported on 20.0% of returns)
Here:
$18,957
State:
$21,976
Here:
24.1% of AGI
State:
17.8% of AGI
(% of AGI for various income ranges: 5.9% for AGIs below $25k, 7.3% for AGIs $25k-50k, 7.7% for AGIs $50k-75k, 10.5% for AGIs $75k-100k, 10.5% for AGIs $100k-200k)
Charity contributions: $4,378 (reported on 15.7% of returns)
Here:
$4,378
State:
$6,709
(% of AGI for various income ranges: 1.9% for AGIs $25k-50k, 1.1% for AGIs $50k-75k, 1.9% for AGIs $75k-100k, 2.1% for AGIs $100k-200k)
Taxes paid: $3,873 (reported on 19.1% of returns)
37308:
$3,873
State:
$4,829
(% of AGI for various income ranges: 0.9% for AGIs below $25k, 1.1% for AGIs $25k-50k, 1.4% for AGIs $50k-75k, 2.2% for AGIs $75k-100k, 2.5% for AGIs $100k-200k)
Earned income credit: $2,284 (reported on 21.7% of returns)
Here:
$2,284
State:
$2,404
(% of AGI for various income ranges: 7.7% for AGIs below $25k, 1.1% for AGIs $25k-50k)
Percentage of individuals using paid preparers for their 2012 taxes: 53.9%
Here:
54%
State:
52%
(% for various income ranges: 53.3% for AGIs below $25k, 53.1% for AGIs $25k-50k, 57.9% for AGIs $50k-75k, 54.5% for AGIs $75k-100k, 50.0% for AGIs $100k-200k)
Averages for the 2004 tax year for zip code 37308, filed in 2005:
Average Adjusted Gross Income (AGI) in 2004: $37,012 (Individual Income Tax Returns)
Here:
$37,012
State:
$44,088
Salary/wage: $35,418 (reported on 86.4% of returns)
Here:
$35,418
State:
$38,825
(% of AGI for various income ranges: 92.5% for AGIs below $10k, 77.9% for AGIs $10k-25k, 85.7% for AGIs $25k-50k, 86.8% for AGIs $50k-75k, 76.7% for AGIs $75k-100k, 75.8% for AGIs over 100k)
Taxable interest for individuals: $1,247 (reported on 28.0% of returns)
This zip code:
$1,247
Tennessee:
$1,802
(% of AGI for various income ranges: 4.8% for AGIs below $10k, 1.0% for AGIs $10k-25k, 1.1% for AGIs $25k-50k, 0.3% for AGIs $50k-75k, 1.2% for AGIs $75k-100k, 1.2% for AGIs over 100k)
Taxable dividends: $1,487 (reported on 10.8% of returns)
Here:
$1,487
State:
$3,727
(% of AGI for various income ranges: 1.9% for AGIs below $10k, 0.0% for AGIs $10k-25k, 0.2% for AGIs $25k-50k, 0.5% for AGIs $50k-75k, 1.2% for AGIs over 100k)
Net capital gain/loss: +$8,152 (reported on 7.6% of returns)
Here:
+$8,152
State:
+$15,776
(% of AGI for various income ranges: 0.7% for AGIs below $10k, 0.1% for AGIs $25k-50k, 1.2% for AGIs $50k-75k, 7.7% for AGIs over 100k)
Profit/loss from business: +$6,706 (reported on 17.0% of returns)
Here:
+$6,706
State:
+$12,882
(% of AGI for various income ranges: 19.0% for AGIs below $10k, 8.9% for AGIs $10k-25k, 1.7% for AGIs $25k-50k, 3.8% for AGIs $50k-75k)
IRA payment deduction: $2,750 (reported on 1.2% of returns)
37308:
$2,750
Tennessee:
$2,934
Total itemized deductions: $15,327 (24% of AGI, reported on 20.2% of returns)
Here:
$15,327
State:
$18,035
Here:
23.8% of AGI
State:
19.9% of AGI
(% of AGI for various income ranges: 6.3% for AGIs $10k-25k, 7.0% for AGIs $25k-50k, 11.2% for AGIs $50k-75k, 11.7% for AGIs $75k-100k, 6.0% for AGIs over 100k)
Charity contributions deductions: $3,570 (5% of AGI, reported on 15.8% of returns)
Here:
$3,570
State:
$5,167
Here:
5.1% of AGI
State:
5.3% of AGI
(% of AGI for various income ranges: 0.6% for AGIs $10k-25k, 1.5% for AGIs $25k-50k, 1.9% for AGIs $50k-75k, 2.4% for AGIs $75k-100k, 1.2% for AGIs over 100k)
Total tax: $4,572 (reported on 74.4% of returns)
37308:
$4,572
State:
$7,482
(% of AGI for various income ranges: 4.4% for AGIs below $10k, 4.4% for AGIs $10k-25k, 5.6% for AGIs $25k-50k, 8.2% for AGIs $50k-75k, 10.1% for AGIs $75k-100k, 20.8% for AGIs over 100k)
Earned income credit: $1,715 (reported on 21.2% of returns)
Here:
$1,715
State:
$1,826
Percentage of individuals using paid preparers for their 2004 taxes: 62.2%
Here:
62%
State:
60%
(% for various income ranges: 50.8% for AGIs below $10k, 64.7% for AGIs $10k-25k, 66.6% for AGIs $25k-50k, 61.6% for AGIs $50k-75k, 64.6% for AGIs $75k-100k, 66.7% for AGIs over 100k)
Household received Food Stamps/SNAP in the past 12 months: 179 Household did not receive Food Stamps/SNAP in the past 12 months: 889
Women who had a birth in the past 12 months: 11 (12 now married, 0 unmarried) Women who did not have a birth in the past 12 months: 452 (266 now married, 185 unmarried)
Housing units in zip code 37308 with a mortgage: 480 (13 second mortgage, 13 both second mortgage and home equity loan) Median monthly owner costs for units with a mortgage: $1,438 Median monthly owner costs for units without a mortgage: $321
Residents with income below the poverty level in 2022:
This zip code:
7.3%
Whole state:
13.3%
Residents with income below 50% of the poverty level in 2022:
This zip code:
4.0%
Whole state:
7.1%
Median number of rooms in houses and condos:
Here:
6.1
State:
6.5
Median number of rooms in apartments:
Here:
5.0
State:
4.4
Notable locations in this zip code not listed on our city pages
Notable locations in zip code 37308: Grasshopper (A), NIRA Rod and Gun Club (B), Highway 58 Volunteer Fire Department Station 3 (C). Display/hide their locations on the map
Churches in zip code 37308 include: Gamble Road Church (A), Burdette Church (B), Birchwood Church (C), Birchwood Baptist Church (D), Burnette Church (E), New Liberty Church (F). Display/hide their locations on the map
Cemeteries: McCallie Cemetery (1), McClanahan Cemetery (2), McInturff Cemetery (3), Roark Cemetery (4), Shelton Cemetery (5), Cookston Cemetery (6), Old Browder Cemetery (7). Display/hide their locations on the map
Streams, rivers, and creeks: Lick Branch (A), Jim Branch (B), Hiwassee River (C), Smith Prong (D), Dry Branch (E), Cookston Branch (F), Lagoon Branch (G), Cane Branch (H), Bare Branch (I). Display/hide their locations on the map
Parks in zip code 37308 include: Blythe Ferry Goose Management Area (1), Bear Branch Access Area (2), Grasshopper Creek Recreation Area (3), Hiwassee Wildlife Refuge (4). Display/hide their locations on the map
Size of family households: 316 2-persons, 192 3-persons, 126 4-persons, 89 5-persons, 10 6-persons, 25 7-or-more-persons
Size of nonfamily households: 262 1-person, 50 2-persons
505 married couples with children.
116 single-parent households (96 men, 20 women).
99.5% of residents of 37308 zip code speak English at home.
Foreign born population: 18 (0.7%) (100.0% of them are naturalized citizens)
This zip code:
0.7%
Whole state:
5.6%
67%Georgia
34%American
9%English
9%Irish
8%Scotch-Irish
5%German
2%Iraqi
2%Italian
Year of entry for the foreign-born population
02010 or later
02000 to 2009
01990 to 1999
16Before 1990
Facilities with environmental interests located in this zip code:
BIRCHWOOD ELEMENTARY SCHOOL (5623 HWY 60 in BIRCHWOOD, TN)
(National Center for Education Statistics) - STATE ID-0025 Organizations: HAMILTON COUNTY SCHOOL DISTRCT (SCHOOL DISTRICT)
Housing units lacking complete plumbing facilities: 2.7% Housing units lacking complete kitchen facilities: 2.5%
85.7%Electricity
13.1%Bottled, tank, or LP gas
0.7%Utility gas
0.7%Wood
Population in 1990: 2,732.
Place of birth for U.S.-born residents:
This state: 2,048
Northeast: 79
Midwest: 140
South: 395
59% of the 37308 zip code residents lived in the same house 5 years ago. Out of people who lived in different houses, 49% lived in this county. Out of people who lived in different counties, 50% lived in Tennessee.
89% of the 37308 zip code residents lived in the same house 1 year ago. Out of people who lived in different houses, 21% moved from this county. Out of people who lived in different houses, 75% moved from different county within same state. Out of people who lived in different houses, 6% moved from different state.
Private vs. public school enrollment:
Students in private schools in grades 1 to 8 (elementary and middle school): 178
Here:
43.8%
Tennessee:
15.0%
Students in private schools in grades 9 to 12 (high school):
Here:
0.0%
Tennessee:
16.2%
Students in private undergraduate colleges: 20
Here:
23.9%
Tennessee:
23.5%
Occupation by median earnings in the past 12 months ($)
93,274Management occupations
75,428Business and financial operations occupations
72,644Health diagnosing and treating practitioners and other technical occupations
67,004Production occupations
64,730Construction and extraction occupations
56,718Installation, maintenance, and repair occupations
Companies with federal contracts located in this zip code:
SMITH SERVICE COMPANY (11425 DOLLY POND RD in BIRCHWOOD, TN; small business) : $967,596 in 22 contractsfrom 2002 to 2004
Contracts for Maintenance, Repair and Rebuilding of Equipment -- Engines, Turbines, and Components, Maintenance, Repair or Alteration of Real Property -- Other Utilities by Army Signed by year:2000: $0; 2001: $0; 2002: $635,174; 2003: $294,172; 2004: $38,250; 2005: $0; 2006: $0.
Biggest contracts:
$266,100 with Army for Maintenance, Repair and Rebuilding of Equipment -- Engines, Turbines, and Components. Taking place in KY. Signed on 2002-02-14. Completion date: 2002-09-30.
$262,498, same as above.Signed on 2002-11-14. Completion date: 2002-09-30.
$210,746, same as above.Signed on 2003-11-17. Completion date: 2004-09-30.
$62,960, same as above.Signed on 2003-04-03. Completion date: 2003-04-28.
Top industries in this zip code by the number of employees in 2005:
Real Estate and Rental and Leasing: Video Tape and Disc Rental (10-19 employees: 1 establishment)
Construction: Power and Communication Line and Related Structures Construction (5-9: 1)
Other Services (except Public Administration): Religious Organizations (1-4: 2)
Construction: Plumbing, Heating, and Air-Conditioning Contractors (1-4: 2)
People in group quarters in 2000:
7 people in homes or halfway houses for drug/alcohol abuse
7 people in homes for the mentally ill
Fatal accident statistics in 2013:
Fatal accident count: 1
Vehicles involved in fatal accidents: 1
Fatal accidents caused by drunken drivers: 1
Fatalities: 1
Persons involved in fatal accidents: 1
Pedestrians involved in fatal accidents: 0
Fatal accident statistics in 2012:
Fatal accident count: 1
Vehicles involved in fatal accidents: 1
Fatal accidents caused by drunken drivers: 1
Fatalities: 1
Persons involved in fatal accidents: 1
Pedestrians involved in fatal accidents: 0
Home Mortgage Disclosure Act Aggregated Statistics For Year 2009 (Based on 2 partial tracts)
A) FHA, FSA/RHS & VA Home Purchase Loans
B) Conventional Home Purchase Loans
C) Refinancings
D) Home Improvement Loans
F) Non-occupant Loans on < 5 Family Dwellings (A B C & D)
G) Loans On Manufactured Home Dwelling (A B C & D)
Number
Average Value
Number
Average Value
Number
Average Value
Number
Average Value
Number
Average Value
Number
Average Value
LOANS ORIGINATED
30
$146,495
20
$140,678
109
$154,025
6
$64,203
6
$186,108
3
$115,637
APPLICATIONS APPROVED, NOT ACCEPTED
1
$101,010
1
$254,960
11
$147,489
1
$7,660
1
$94,740
1
$33,440
APPLICATIONS DENIED
6
$130,265
6
$181,465
42
$155,839
5
$52,802
2
$105,185
2
$104,490
APPLICATIONS WITHDRAWN
3
$181,347
5
$153,530
30
$158,546
0
$0
1
$21,590
2
$125,390
FILES CLOSED FOR INCOMPLETENESS
3
$124,690
1
$111,460
8
$180,941
0
$0
0
$0
0
$0
Aggregated Statistics For Year 2008 (Based on 2 partial tracts)
A) FHA, FSA/RHS & VA Home Purchase Loans
B) Conventional Home Purchase Loans
C) Refinancings
D) Home Improvement Loans
E) Loans on Dwellings For 5+ Families
F) Non-occupant Loans on < 5 Family Dwellings (A B C & D)
G) Loans On Manufactured Home Dwelling (A B C & D)
Number
Average Value
Number
Average Value
Number
Average Value
Number
Average Value
Number
Average Value
Number
Average Value
Number
Average Value
LOANS ORIGINATED
19
$134,774
26
$161,772
83
$170,499
11
$23,811
1
$431,890
12
$161,728
6
$72,447
APPLICATIONS APPROVED, NOT ACCEPTED
1
$182,510
2
$117,375
8
$143,848
3
$5,110
0
$0
2
$98,915
1
$29,950
APPLICATIONS DENIED
3
$183,903
4
$415,522
68
$137,927
10
$52,524
0
$0
2
$79,760
7
$77,421
APPLICATIONS WITHDRAWN
0
$0
3
$76,160
20
$169,900
3
$64,320
0
$0
2
$109,715
1
$179,030
FILES CLOSED FOR INCOMPLETENESS
0
$0
3
$153,717
10
$184,738
1
$72,450
0
$0
1
$146,290
0
$0
Aggregated Statistics For Year 2007 (Based on 2 partial tracts)
A) FHA, FSA/RHS & VA Home Purchase Loans
B) Conventional Home Purchase Loans
C) Refinancings
D) Home Improvement Loans
F) Non-occupant Loans on < 5 Family Dwellings (A B C & D)
G) Loans On Manufactured Home Dwelling (A B C & D)
Number
Average Value
Number
Average Value
Number
Average Value
Number
Average Value
Number
Average Value
Number
Average Value
LOANS ORIGINATED
15
$117,865
63
$141,697
88
$146,334
11
$40,783
9
$147,757
13
$74,161
APPLICATIONS APPROVED, NOT ACCEPTED
1
$57,820
12
$192,029
15
$128,917
4
$19,680
1
$83,590
2
$60,255
APPLICATIONS DENIED
0
$0
15
$167,602
69
$140,865
13
$73,732
3
$67,337
5
$92,230
APPLICATIONS WITHDRAWN
1
$43,190
6
$153,600
29
$142,491
1
$79,410
1
$52,940
1
$43,190
FILES CLOSED FOR INCOMPLETENESS
0
$0
3
$192,727
14
$125,935
1
$121,910
0
$0
0
$0
Aggregated Statistics For Year 2006 (Based on 2 partial tracts)
A) FHA, FSA/RHS & VA Home Purchase Loans
B) Conventional Home Purchase Loans
C) Refinancings
D) Home Improvement Loans
F) Non-occupant Loans on < 5 Family Dwellings (A B C & D)
G) Loans On Manufactured Home Dwelling (A B C & D)
Number
Average Value
Number
Average Value
Number
Average Value
Number
Average Value
Number
Average Value
Number
Average Value
LOANS ORIGINATED
10
$131,866
98
$142,945
98
$114,584
6
$64,552
22
$131,657
11
$67,000
APPLICATIONS APPROVED, NOT ACCEPTED
1
$190,870
21
$116,730
21
$141,741
1
$52,240
3
$81,733
6
$52,013
APPLICATIONS DENIED
0
$0
29
$102,881
79
$98,820
20
$39,741
12
$87,191
22
$67,412
APPLICATIONS WITHDRAWN
1
$64,090
9
$103,716
49
$114,257
1
$94,740
1
$94,040
1
$41,800
FILES CLOSED FOR INCOMPLETENESS
0
$0
3
$139,783
13
$162,629
0
$0
1
$167,880
0
$0
Aggregated Statistics For Year 2005 (Based on 2 partial tracts)
A) FHA, FSA/RHS & VA Home Purchase Loans
B) Conventional Home Purchase Loans
C) Refinancings
D) Home Improvement Loans
E) Loans on Dwellings For 5+ Families
F) Non-occupant Loans on < 5 Family Dwellings (A B C & D)
G) Loans On Manufactured Home Dwelling (A B C & D)
Number
Average Value
Number
Average Value
Number
Average Value
Number
Average Value
Number
Average Value
Number
Average Value
Number
Average Value
LOANS ORIGINATED
10
$125,109
93
$152,293
110
$118,232
15
$54,335
1
$402,630
14
$124,542
10
$67,013
APPLICATIONS APPROVED, NOT ACCEPTED
0
$0
13
$68,428
24
$99,469
4
$19,505
0
$0
3
$61,997
10
$52,872
APPLICATIONS DENIED
1
$206,190
24
$146,750
100
$108,823
17
$31,183
0
$0
6
$60,837
17
$60,154
APPLICATIONS WITHDRAWN
0
$0
14
$109,366
59
$151,268
5
$108,948
0
$0
2
$54,685
2
$79,410
FILES CLOSED FOR INCOMPLETENESS
0
$0
3
$90,093
10
$108,182
0
$0
0
$0
0
$0
1
$83,590
Aggregated Statistics For Year 2004 (Based on 2 partial tracts)
A) FHA, FSA/RHS & VA Home Purchase Loans
B) Conventional Home Purchase Loans
C) Refinancings
D) Home Improvement Loans
E) Loans on Dwellings For 5+ Families
F) Non-occupant Loans on < 5 Family Dwellings (A B C & D)
G) Loans On Manufactured Home Dwelling (A B C & D)
Number
Average Value
Number
Average Value
Number
Average Value
Number
Average Value
Number
Average Value
Number
Average Value
Number
Average Value
LOANS ORIGINATED
10
$106,789
63
$119,450
133
$102,500
12
$34,888
1
$378,950
6
$104,142
10
$51,897
APPLICATIONS APPROVED, NOT ACCEPTED
1
$34,130
14
$104,689
21
$116,465
3
$34,597
0
$0
1
$53,640
7
$50,553
APPLICATIONS DENIED
2
$82,200
19
$82,235
79
$107,708
13
$53,638
0
$0
3
$41,797
28
$61,649
APPLICATIONS WITHDRAWN
3
$101,703
7
$111,257
60
$113,023
1
$66,180
0
$0
0
$0
6
$74,420
FILES CLOSED FOR INCOMPLETENESS
0
$0
1
$36,220
4
$111,978
0
$0
0
$0
0
$0
1
$51,550
Aggregated Statistics For Year 2003 (Based on 2 partial tracts)
A) FHA, FSA/RHS & VA Home Purchase Loans
B) Conventional Home Purchase Loans
C) Refinancings
D) Home Improvement Loans
F) Non-occupant Loans on < 5 Family Dwellings (A B C & D)
Number
Average Value
Number
Average Value
Number
Average Value
Number
Average Value
Number
Average Value
LOANS ORIGINATED
15
$103,979
60
$115,891
192
$113,803
7
$38,910
10
$151,998
APPLICATIONS APPROVED, NOT ACCEPTED
1
$22,990
13
$99,025
38
$102,125
1
$39,010
3
$132,820
APPLICATIONS DENIED
1
$69,660
17
$108,588
82
$99,750
11
$12,602
2
$139,320
APPLICATIONS WITHDRAWN
5
$97,384
10
$100,101
40
$105,936
1
$24,380
1
$91,250
FILES CLOSED FOR INCOMPLETENESS
0
$0
2
$105,885
10
$114,103
0
$0
1
$59,210
Aggregated Statistics For Year 1999 (Based on 1 partial tract)
A) FHA, FSA/RHS & VA Home Purchase Loans
B) Conventional Home Purchase Loans
C) Refinancings
D) Home Improvement Loans
F) Non-occupant Loans on < 5 Family Dwellings (A B C & D)
Detailed PMIC statistics for the following Tracts:0101.02
2003 - 2018 National Fire Incident Reporting System (NFIRS) incidents
Based on the data from the years 2003 - 2018 the average number of fire incidents per year is 11. The highest number of reported fire incidents - 18 took place in 2007, and the least - 4 in 2012. The data has an increasing trend.
When looking into fire subcategories, the most incidents belonged to: Outside Fires (46.6%), and Structure Fires (33.0%).
Fire incident types reported to NFIRS in Zip Code 37308


 Nearest zip codes: 37336, 37373, 37341, 37312, 37321, 37379.


 Based on the data from the years 2003 - 2018 the average number of fire incidents per year is 11. The highest number of reported fire incidents - 18 took place in 2007, and the least - 4 in 2012. The data has an increasing trend.
 When looking into fire subcategories, the most incidents belonged to: Outside Fires (46.6%), and Structure Fires (33.0%).