Estimated zip code population in 2022: 3,393 Zip code population in 2010: 3,074 Zip code population in 2000: 2,658
Houses and condos: 1,265 Renter-occupied apartments: 187
% of renters here:
16%
State:
33%
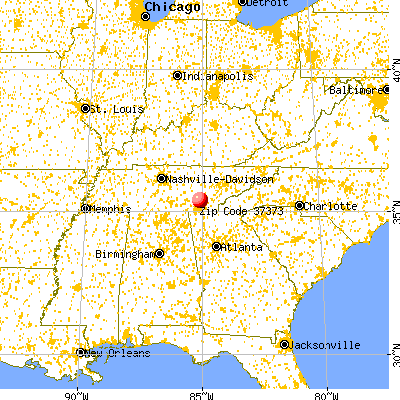
March 2022 cost of living index in zip code 37373: 82.8 (low, U.S. average is 100)
Land area: 41.4 sq. mi. Water area: 2.5 sq. mi.
Population density: 82 people per square mile
(very low).
OSM Map
General Map
Google Map
MSN Map
OSM Map
General Map
Google Map
MSN Map
OSM Map
General Map
Google Map
MSN Map
OSM Map
General Map
Google Map
MSN Map
Please wait while loading the map...
Real estate property taxes paid for housing units in 2022:
This zip code:
0.4% ($1,367)
Tennessee:
0.5% ($1,376)
Median real estate property taxes paid for housing units with mortgages in 2022: $1,745 (0.4%) Median real estate property taxes paid for housing units with no mortgage in 2022: $911 (0.5%)
Estimated median house/condo value in 2022: $333,637
37373:
$333,637
Tennessee:
$284,800
According to our research of Tennessee and other state lists, there were 4 registered sex offenders living in 37373 zip code as of May 29, 2024. The ratio of all residents to sex offenders in zip code 37373 is 627 to 1. The ratio of registered sex offenders to all residents in this zip code is lower than the state average.
Median resident age:
This zip code:
47.9 years
Tennessee median age:
39.2 years
Average household size:
This zip code:
2.9 people
Tennessee:
2.4 people
Averages for the 2020 tax year for zip code 37373, filed in 2021:
Average Adjusted Gross Income (AGI) in 2020: $60,287 (Individual Income Tax Returns)
Here:
$60,287
State:
$69,014
Salary/wage: $52,563 (reported on 80.5% of returns)
Here:
$52,563
State:
$55,872
(% of AGI for various income ranges: 1038.9% for AGIs below $25k, 3196.6% for AGIs $25k-50k, 6307.1% for AGIs $50k-75k, 9278.0% for AGIs $75k-100k, 14927.9% for AGIs $100k-200k)
Taxable interest for individuals: $788 (reported on 26.8% of returns)
This zip code:
$788
Tennessee:
$1,945
(% of AGI for various income ranges: 8.3% for AGIs below $25k, 16.9% for AGIs $25k-50k, 11.2% for AGIs $50k-75k, 32.0% for AGIs $75k-100k, 49.3% for AGIs $100k-200k)
Ordinary dividends: $3,262 (reported on 10.7% of returns)
Here:
$3,262
State:
$8,105
(% of AGI for various income ranges: 2.5% for AGIs below $25k, 28.1% for AGIs $25k-50k, 18.2% for AGIs $50k-75k, 150.0% for AGIs $100k-200k)
Net capital gain/loss in AGI: +$28,836 (reported on 9.4% of returns)
Here:
+$28,836
State:
+$33,664
(% of AGI for various income ranges: 68.2% for AGIs $50k-75k, 2801.4% for AGIs $100k-200k)
Profit/loss from business: +$16,674 (reported on 15.4% of returns)
Here:
+$16,674
State:
+$18,991
(% of AGI for various income ranges: 154.2% for AGIs below $25k, 138.1% for AGIs $25k-50k, 400.0% for AGIs $50k-75k, 281.0% for AGIs $75k-100k, 1340.7% for AGIs $100k-200k)
Taxable individual retirement arrangement distribution: $16,608 (reported on 8.7% of returns)
37373:
$16,608
Tennessee:
$20,036
(% of AGI for various income ranges: 70.8% for AGIs below $25k, 131.9% for AGIs $25k-50k, 283.5% for AGIs $50k-75k, 714.3% for AGIs $100k-200k)
Total itemized deductions: $34,980 (reported on 3.4% of returns)
Here:
$34,980
State:
$40,136
(% of AGI for various income ranges: 1249.3% for AGIs $100k-200k)
Charity contributions: $20,875 (reported on 2.7% of returns)
Here:
$20,875
State:
$19,852
(% of AGI for various income ranges: 596.4% for AGIs $100k-200k)
Taxes paid: $5,400 (reported on 3.4% of returns)
37373:
$5,400
State:
$6,038
(% of AGI for various income ranges: 192.9% for AGIs $100k-200k)
Earned income credit: $2,116 (reported on 16.8% of returns)
Here:
$2,116
State:
$2,391
(% of AGI for various income ranges: 90.3% for AGIs below $25k, 63.7% for AGIs $25k-50k)
Percentage of individuals using paid preparers for their 2020 taxes: 93.3%
Here:
93%
State:
93%
(% for various income ranges: 91.5% for AGIs below $25k, 94.9% for AGIs $25k-50k, 95.7% for AGIs $50k-75k, 93.3% for AGIs $75k-100k, 90.5% for AGIs $100k-200k, 100.0% for AGIs over 200k)
Averages for the 2012 tax year for zip code 37373, filed in 2013:
Average Adjusted Gross Income (AGI) in 2012: $49,314 (Individual Income Tax Returns)
Here:
$49,314
State:
$53,767
Salary/wage: $46,863 (reported on 81.6% of returns)
Here:
$46,863
State:
$45,421
(% of AGI for various income ranges: 64.6% for AGIs below $25k, 77.9% for AGIs $25k-50k, 80.9% for AGIs $50k-75k, 81.9% for AGIs $75k-100k, 77.0% for AGIs $100k-200k)
Taxable interest for individuals: $779 (reported on 27.2% of returns)
This zip code:
$779
Tennessee:
$1,732
(% of AGI for various income ranges: 1.2% for AGIs below $25k, 0.6% for AGIs $25k-50k, 0.1% for AGIs $50k-75k, 0.5% for AGIs $100k-200k)
Ordinary dividends: $1,792 (reported on 9.6% of returns)
Here:
$1,792
State:
$6,739
(% of AGI for various income ranges: 0.3% for AGIs below $25k, 0.1% for AGIs $25k-50k, 0.5% for AGIs $50k-75k, 0.6% for AGIs $100k-200k)
Net capital gain/loss in AGI: +$344 (reported on 7.2% of returns)
Here:
+$344
State:
+$19,082
(% of AGI for various income ranges: 0.3% for AGIs $100k-200k)
Profit/loss from business: +$12,950 (reported on 17.6% of returns)
Here:
+$12,950
State:
+$15,240
(% of AGI for various income ranges: 10.7% for AGIs below $25k, 4.8% for AGIs $25k-50k, 3.4% for AGIs $50k-75k, 5.6% for AGIs $100k-200k)
Taxable individual retirement arrangement distribution: $13,109 (reported on 8.8% of returns)
37373:
$13,109
Tennessee:
$15,505
(% of AGI for various income ranges: 2.6% for AGIs below $25k, 2.4% for AGIs $25k-50k, 3.5% for AGIs $50k-75k, 2.5% for AGIs $100k-200k)
Total itemized deductions: $20,172 (21% of AGI, reported on 20.0% of returns)
Here:
$20,172
State:
$21,976
Here:
21.1% of AGI
State:
17.8% of AGI
(% of AGI for various income ranges: 4.7% for AGIs below $25k, 6.6% for AGIs $25k-50k, 7.5% for AGIs $50k-75k, 9.9% for AGIs $75k-100k, 9.7% for AGIs $100k-200k)
Charity contributions: $5,358 (reported on 15.2% of returns)
Here:
$5,358
State:
$6,709
(% of AGI for various income ranges: 1.1% for AGIs $25k-50k, 1.5% for AGIs $50k-75k, 2.0% for AGIs $75k-100k, 2.3% for AGIs $100k-200k)
Taxes paid: $4,025 (reported on 19.2% of returns)
37373:
$4,025
State:
$4,829
(% of AGI for various income ranges: 0.7% for AGIs below $25k, 1.1% for AGIs $25k-50k, 1.3% for AGIs $50k-75k, 1.5% for AGIs $75k-100k, 2.2% for AGIs $100k-200k)
Earned income credit: $2,220 (reported on 20.0% of returns)
Here:
$2,220
State:
$2,404
(% of AGI for various income ranges: 6.8% for AGIs below $25k, 1.3% for AGIs $25k-50k)
Percentage of individuals using paid preparers for their 2012 taxes: 56.0%
Here:
56%
State:
52%
(% for various income ranges: 51.1% for AGIs below $25k, 54.5% for AGIs $25k-50k, 57.1% for AGIs $50k-75k, 63.6% for AGIs $75k-100k, 69.2% for AGIs $100k-200k)
Averages for the 2004 tax year for zip code 37373, filed in 2005:
Average Adjusted Gross Income (AGI) in 2004: $36,950 (Individual Income Tax Returns)
Here:
$36,950
State:
$44,088
Salary/wage: $36,091 (reported on 84.9% of returns)
Here:
$36,091
State:
$38,825
(% of AGI for various income ranges: 84.2% for AGIs below $10k, 70.4% for AGIs $10k-25k, 85.8% for AGIs $25k-50k, 86.7% for AGIs $50k-75k, 91.0% for AGIs $75k-100k, 75.4% for AGIs over 100k)
Taxable interest for individuals: $661 (reported on 33.5% of returns)
This zip code:
$661
Tennessee:
$1,802
(% of AGI for various income ranges: 1.5% for AGIs below $10k, 1.1% for AGIs $10k-25k, 0.5% for AGIs $25k-50k, 0.3% for AGIs $50k-75k, 0.2% for AGIs $75k-100k, 1.0% for AGIs over 100k)
Taxable dividends: $583 (reported on 10.1% of returns)
Here:
$583
State:
$3,727
(% of AGI for various income ranges: 0.1% for AGIs $10k-25k, 0.1% for AGIs $25k-50k, 0.2% for AGIs $50k-75k, 0.2% for AGIs $75k-100k, 0.3% for AGIs over 100k)
Net capital gain/loss: +$5,881 (reported on 8.1% of returns)
Here:
+$5,881
State:
+$15,776
(% of AGI for various income ranges: -0.8% for AGIs below $10k, -0.4% for AGIs $10k-25k, 0.2% for AGIs $25k-50k, -0.1% for AGIs $50k-75k, 0.5% for AGIs $75k-100k, 6.9% for AGIs over 100k)
Profit/loss from business: +$4,953 (reported on 17.2% of returns)
Here:
+$4,953
State:
+$12,882
(% of AGI for various income ranges: 12.9% for AGIs below $10k, 10.8% for AGIs $10k-25k, 3.1% for AGIs $25k-50k, 0.0% for AGIs $50k-75k, -1.4% for AGIs $75k-100k)
IRA payment deduction: $1,143 (reported on 1.1% of returns)
37373:
$1,143
Tennessee:
$2,934
Total itemized deductions: $15,747 (24% of AGI, reported on 18.0% of returns)
Here:
$15,747
State:
$18,035
Here:
23.6% of AGI
State:
19.9% of AGI
(% of AGI for various income ranges: 5.8% for AGIs $10k-25k, 6.9% for AGIs $25k-50k, 6.6% for AGIs $50k-75k, 10.4% for AGIs $75k-100k, 10.2% for AGIs over 100k)
Charity contributions deductions: $4,348 (6% of AGI, reported on 14.7% of returns)
Here:
$4,348
State:
$5,167
Here:
6.3% of AGI
State:
5.3% of AGI
(% of AGI for various income ranges: 0.6% for AGIs $10k-25k, 1.1% for AGIs $25k-50k, 1.5% for AGIs $50k-75k, 2.5% for AGIs $75k-100k, 3.3% for AGIs over 100k)
Total tax: $4,421 (reported on 75.7% of returns)
37373:
$4,421
State:
$7,482
(% of AGI for various income ranges: 4.9% for AGIs below $10k, 4.5% for AGIs $10k-25k, 6.4% for AGIs $25k-50k, 8.5% for AGIs $50k-75k, 11.0% for AGIs $75k-100k, 16.0% for AGIs over 100k)
Earned income credit: $1,721 (reported on 18.1% of returns)
Here:
$1,721
State:
$1,826
Percentage of individuals using paid preparers for their 2004 taxes: 64.9%
Here:
65%
State:
60%
(% for various income ranges: 57.2% for AGIs below $10k, 69.1% for AGIs $10k-25k, 64.9% for AGIs $25k-50k, 69.5% for AGIs $50k-75k, 59.3% for AGIs $75k-100k, 66.7% for AGIs over 100k)
Household received Food Stamps/SNAP in the past 12 months: 112 Household did not receive Food Stamps/SNAP in the past 12 months: 1,079
Women who had a birth in the past 12 months: 8 (9 now married, 0 unmarried) Women who did not have a birth in the past 12 months: 663 (323 now married, 339 unmarried)
Housing units in zip code 37373 with a mortgage: 577 (11 second mortgage, 11 both second mortgage and home equity loan) Median monthly owner costs for units with a mortgage: $1,746 Median monthly owner costs for units without a mortgage: $431
Residents with income below the poverty level in 2022:
This zip code:
1.5%
Whole state:
13.3%
Residents with income below 50% of the poverty level in 2022:
This zip code:
1.4%
Whole state:
7.1%
Median number of rooms in houses and condos:
Here:
5.9
State:
6.5
Median number of rooms in apartments:
Here:
4.8
State:
4.4
Notable locations in this zip code not listed on our city pages
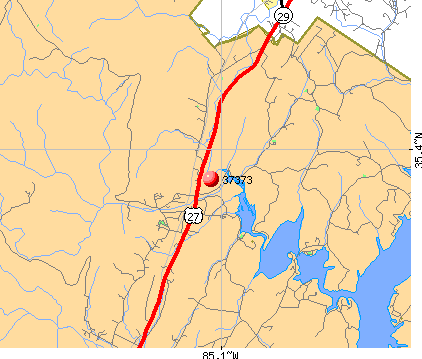
Notable locations in zip code 37373: Harbor Lights Boat Dock (A), Lake Drive (B), Sale Creek Volunteer Fire and Rescue Station 1 (C), Sale Creek Volunteer Fire and Rescue Station 4 (D), Sale Creek Volunteer Fire and Rescue Station 2 (E). Display/hide their locations on the map
Churches in zip code 37373 include: First Baptist Church of Sale Creek (A), Lake Drive Baptist Church (B), New Providence Church (C), Mount Vernon Church (D), Mayflower Church (E). Display/hide their locations on the map
Cemeteries: Welch Cemetery (1), Gray Cemetery (2), McDonald Cemetery (3), Miller-Nelson Cemetery (4), Mount Vernon Cemetery (5), Lake Drive Cemetery (6), Shelton Cemetery (7). Display/hide their locations on the map
Streams, rivers, and creeks: Hall Creek (A), Flat Branch (B), Channel Branch (C), Hodgetown Branch (D), Skiles Branch (E), Thomas Branch (F), Rocky Branch (G), Rock Creek (H). Display/hide their locations on the map
Size of family households: 430 2-persons, 229 3-persons, 122 4-persons, 144 5-persons, 9 6-persons, 34 7-or-more-persons
Size of nonfamily households: 215 1-person, 6 2-persons
539 married couples with children.
166 single-parent households (57 men, 109 women).
97.4% of residents of 37373 zip code speak English at home.
2.6% of residents speak Spanish at home (100% very well).
Foreign born population: 48 (1.4%) (0.0% of them are naturalized citizens)
:
1.4%
Whole state:
5.6%
127%Chile
19%English
19%American
18%Irish
10%Scotch-Irish
9%German
2%Italian
1%European
Year of entry for the foreign-born population
02010 or later
02000 to 2009
01990 to 1999
41Before 1990
Facilities with environmental interests located in this zip code:
DELTA CARPETS INC (PO BOX 516 in SALE CREEK, TN)
(Resource Conservation and Recovery Act (tracking hazardous waste))
56.8%Electricity
35.1%Utility gas
5.9%Bottled, tank, or LP gas
1.2%Solar energy
1.1%Wood
Population in 1990: 2,464. Population change in the 1990s: +194 (+7.9%).
Place of birth for U.S.-born residents:
This state: 2,452
Northeast: 66
Midwest: 201
South: 430
West: 174
68% of the 37373 zip code residents lived in the same house 5 years ago. Out of people who lived in different houses, 65% lived in this county. Out of people who lived in different counties, 50% lived in Tennessee.
96% of the 37373 zip code residents lived in the same house 1 year ago. Out of people who lived in different houses, 62% moved from this county. Out of people who lived in different houses, 3% moved from different county within same state. Out of people who lived in different houses, 42% moved from different state.
Private vs. public school enrollment:
Students in private schools in grades 1 to 8 (elementary and middle school): 78
Here:
17.7%
Tennessee:
15.0%
Students in private schools in grades 9 to 12 (high school): 40
Here:
25.1%
Tennessee:
16.2%
Students in private undergraduate colleges: 4
Here:
2.9%
Tennessee:
23.5%
Occupation by median earnings in the past 12 months ($)
137,319Health diagnosing and treating practitioners and other technical occupations
90,493Management occupations
86,639Business and financial operations occupations
72,762Material moving occupations
59,671Production occupations
57,715Installation, maintenance, and repair occupations
Top industries in this zip code by the number of employees in 2005:
Wholesale Trade: Sporting and Recreational Goods and Supplies Merchant Wholesalers (20-49 employees: 1 establishment)
Wholesale Trade: Industrial Machinery and Equipment Merchant Wholesalers (10-19: 1)
Construction: Site Preparation Contractors (10-19: 1)
Construction: Electrical Contractors (5-9: 2)
Construction: Highway, Street, and Bridge Construction (5-9: 1)
Health Care and Social Assistance: Services for the Elderly and Persons with Disabilities (5-9: 1)
Other Services (except Public Administration): Religious Organizations (1-4: 2)
Professional, Scientific, and Technical Services: Other Scientific and Technical Consulting Services (1-4: 1)
Fatal accident statistics in 2014:
Fatal accident count: 2
Vehicles involved in fatal accidents: 4
Fatal accidents caused by drunken drivers: 1
Fatalities: 2
Persons involved in fatal accidents: 4
Pedestrians involved in fatal accidents: 0
Fatal accident statistics in 2012:
Fatal accident count: 2
Vehicles involved in fatal accidents: 2
Fatal accidents caused by drunken drivers: 0
Fatalities: 2
Persons involved in fatal accidents: 4
Pedestrians involved in fatal accidents: 0
Home Mortgage Disclosure Act Aggregated Statistics For Year 2009 (Based on 4 partial tracts)
A) FHA, FSA/RHS & VA Home Purchase Loans
B) Conventional Home Purchase Loans
C) Refinancings
D) Home Improvement Loans
F) Non-occupant Loans on < 5 Family Dwellings (A B C & D)
G) Loans On Manufactured Home Dwelling (A B C & D)
Number
Average Value
Number
Average Value
Number
Average Value
Number
Average Value
Number
Average Value
Number
Average Value
LOANS ORIGINATED
39
$171,718
66
$195,317
240
$185,888
11
$63,502
22
$176,185
9
$79,064
APPLICATIONS APPROVED, NOT ACCEPTED
3
$189,843
4
$99,402
28
$179,732
4
$121,212
3
$119,397
3
$62,060
APPLICATIONS DENIED
9
$121,954
14
$231,688
83
$174,692
6
$39,845
9
$226,198
12
$57,934
APPLICATIONS WITHDRAWN
4
$153,150
8
$211,906
50
$177,692
2
$11,520
2
$210,295
4
$90,260
FILES CLOSED FOR INCOMPLETENESS
3
$137,970
3
$130,897
10
$194,475
1
$151,200
2
$134,415
0
$0
Aggregated Statistics For Year 2008 (Based on 4 partial tracts)
A) FHA, FSA/RHS & VA Home Purchase Loans
B) Conventional Home Purchase Loans
C) Refinancings
D) Home Improvement Loans
F) Non-occupant Loans on < 5 Family Dwellings (A B C & D)
G) Loans On Manufactured Home Dwelling (A B C & D)
Number
Average Value
Number
Average Value
Number
Average Value
Number
Average Value
Number
Average Value
Number
Average Value
LOANS ORIGINATED
40
$144,178
90
$236,485
185
$163,187
20
$84,348
26
$144,885
20
$81,522
APPLICATIONS APPROVED, NOT ACCEPTED
1
$294,180
3
$164,680
12
$201,922
2
$38,280
0
$0
3
$83,650
APPLICATIONS DENIED
7
$159,487
9
$267,103
119
$158,779
16
$62,322
9
$319,192
14
$85,204
APPLICATIONS WITHDRAWN
8
$124,105
11
$200,795
37
$211,153
3
$59,323
5
$101,652
0
$0
FILES CLOSED FOR INCOMPLETENESS
1
$303,440
6
$208,717
18
$170,764
0
$0
2
$79,650
1
$62,740
Aggregated Statistics For Year 2007 (Based on 4 partial tracts)
A) FHA, FSA/RHS & VA Home Purchase Loans
B) Conventional Home Purchase Loans
C) Refinancings
D) Home Improvement Loans
F) Non-occupant Loans on < 5 Family Dwellings (A B C & D)
G) Loans On Manufactured Home Dwelling (A B C & D)
Number
Average Value
Number
Average Value
Number
Average Value
Number
Average Value
Number
Average Value
Number
Average Value
LOANS ORIGINATED
13
$127,062
138
$185,984
171
$145,580
24
$39,127
26
$170,859
25
$64,899
APPLICATIONS APPROVED, NOT ACCEPTED
0
$0
22
$216,348
30
$193,714
2
$19,940
6
$265,052
3
$48,487
APPLICATIONS DENIED
6
$102,427
38
$169,214
156
$177,272
24
$71,439
22
$203,088
13
$64,231
APPLICATIONS WITHDRAWN
3
$72,003
19
$204,898
39
$186,103
4
$96,475
3
$205,720
2
$67,375
FILES CLOSED FOR INCOMPLETENESS
1
$94,630
10
$235,927
30
$189,031
3
$208,477
3
$369,127
2
$60,175
Aggregated Statistics For Year 2006 (Based on 4 partial tracts)
A) FHA, FSA/RHS & VA Home Purchase Loans
B) Conventional Home Purchase Loans
C) Refinancings
D) Home Improvement Loans
F) Non-occupant Loans on < 5 Family Dwellings (A B C & D)
G) Loans On Manufactured Home Dwelling (A B C & D)
Number
Average Value
Number
Average Value
Number
Average Value
Number
Average Value
Number
Average Value
Number
Average Value
LOANS ORIGINATED
22
$116,040
158
$155,700
186
$150,783
34
$53,723
30
$132,580
26
$73,278
APPLICATIONS APPROVED, NOT ACCEPTED
2
$107,490
20
$149,036
48
$130,389
5
$39,892
9
$79,201
16
$62,784
APPLICATIONS DENIED
6
$81,628
41
$106,561
122
$128,755
34
$60,255
16
$67,384
41
$63,000
APPLICATIONS WITHDRAWN
3
$106,513
15
$156,225
72
$163,824
4
$71,315
2
$215,360
4
$87,430
FILES CLOSED FOR INCOMPLETENESS
2
$73,545
5
$132,468
21
$162,711
0
$0
1
$206,990
1
$103,890
Aggregated Statistics For Year 2005 (Based on 4 partial tracts)
A) FHA, FSA/RHS & VA Home Purchase Loans
B) Conventional Home Purchase Loans
C) Refinancings
D) Home Improvement Loans
F) Non-occupant Loans on < 5 Family Dwellings (A B C & D)
G) Loans On Manufactured Home Dwelling (A B C & D)
Number
Average Value
Number
Average Value
Number
Average Value
Number
Average Value
Number
Average Value
Number
Average Value
LOANS ORIGINATED
18
$110,300
203
$149,796
218
$131,583
24
$44,655
28
$125,896
30
$67,586
APPLICATIONS APPROVED, NOT ACCEPTED
1
$80,230
21
$143,150
28
$116,855
2
$35,550
2
$120,815
9
$65,730
APPLICATIONS DENIED
2
$87,290
40
$78,512
153
$117,013
31
$42,121
11
$114,170
31
$59,026
APPLICATIONS WITHDRAWN
1
$73,990
21
$128,398
108
$122,288
14
$76,182
2
$150,060
4
$80,542
FILES CLOSED FOR INCOMPLETENESS
0
$0
4
$116,065
7
$91,653
0
$0
1
$73,680
1
$112,120
Aggregated Statistics For Year 2004 (Based on 4 partial tracts)
A) FHA, FSA/RHS & VA Home Purchase Loans
B) Conventional Home Purchase Loans
C) Refinancings
D) Home Improvement Loans
F) Non-occupant Loans on < 5 Family Dwellings (A B C & D)
G) Loans On Manufactured Home Dwelling (A B C & D)
Number
Average Value
Number
Average Value
Number
Average Value
Number
Average Value
Number
Average Value
Number
Average Value
LOANS ORIGINATED
16
$103,679
146
$152,016
266
$131,859
28
$46,755
17
$135,814
28
$67,880
APPLICATIONS APPROVED, NOT ACCEPTED
2
$59,145
21
$147,457
54
$95,952
9
$39,304
3
$76,723
18
$62,466
APPLICATIONS DENIED
6
$93,945
46
$87,834
156
$96,614
26
$39,376
1
$15,040
33
$63,655
APPLICATIONS WITHDRAWN
0
$0
22
$124,216
98
$112,223
4
$53,130
3
$141,260
15
$70,784
FILES CLOSED FOR INCOMPLETENESS
1
$91,970
5
$100,776
19
$119,930
0
$0
1
$146,060
4
$65,058
Aggregated Statistics For Year 2003 (Based on 4 partial tracts)
A) FHA, FSA/RHS & VA Home Purchase Loans
B) Conventional Home Purchase Loans
C) Refinancings
D) Home Improvement Loans
F) Non-occupant Loans on < 5 Family Dwellings (A B C & D)
Number
Average Value
Number
Average Value
Number
Average Value
Number
Average Value
Number
Average Value
LOANS ORIGINATED
27
$94,877
130
$148,444
400
$133,277
18
$59,364
20
$101,322
APPLICATIONS APPROVED, NOT ACCEPTED
2
$92,575
19
$93,373
57
$101,913
3
$33,447
2
$69,345
APPLICATIONS DENIED
3
$83,143
44
$97,316
169
$90,212
16
$13,152
5
$110,670
APPLICATIONS WITHDRAWN
4
$92,130
22
$149,075
71
$118,480
2
$36,840
1
$80,430
FILES CLOSED FOR INCOMPLETENESS
0
$0
6
$67,653
13
$136,133
0
$0
0
$0
Aggregated Statistics For Year 2002 (Based on 2 partial tracts)
A) FHA, FSA/RHS & VA Home Purchase Loans
B) Conventional Home Purchase Loans
C) Refinancings
D) Home Improvement Loans
F) Non-occupant Loans on < 5 Family Dwellings (A B C & D)
Number
Average Value
Number
Average Value
Number
Average Value
Number
Average Value
Number
Average Value
LOANS ORIGINATED
10
$87,122
82
$109,772
208
$107,217
25
$20,613
15
$88,254
APPLICATIONS APPROVED, NOT ACCEPTED
2
$77,145
29
$97,823
28
$80,598
6
$25,200
0
$0
APPLICATIONS DENIED
2
$99,260
30
$62,916
86
$95,983
16
$19,029
7
$54,516
APPLICATIONS WITHDRAWN
1
$96,690
7
$129,604
42
$105,015
0
$0
3
$92,230
FILES CLOSED FOR INCOMPLETENESS
0
$0
2
$66,860
3
$121,033
0
$0
0
$0
Aggregated Statistics For Year 2001 (Based on 2 partial tracts)
A) FHA, FSA/RHS & VA Home Purchase Loans
B) Conventional Home Purchase Loans
C) Refinancings
D) Home Improvement Loans
F) Non-occupant Loans on < 5 Family Dwellings (A B C & D)
Number
Average Value
Number
Average Value
Number
Average Value
Number
Average Value
Number
Average Value
LOANS ORIGINATED
15
$91,203
74
$118,345
205
$107,852
24
$16,458
9
$119,547
APPLICATIONS APPROVED, NOT ACCEPTED
3
$91,203
20
$62,488
38
$101,236
0
$0
1
$19,540
APPLICATIONS DENIED
1
$29,830
46
$52,615
104
$84,889
11
$16,738
7
$95,366
APPLICATIONS WITHDRAWN
1
$41,140
5
$83,110
40
$86,197
1
$25,720
0
$0
FILES CLOSED FOR INCOMPLETENESS
0
$0
1
$68,920
11
$90,516
0
$0
0
$0
Aggregated Statistics For Year 2000 (Based on 2 partial tracts)
A) FHA, FSA/RHS & VA Home Purchase Loans
B) Conventional Home Purchase Loans
C) Refinancings
D) Home Improvement Loans
F) Non-occupant Loans on < 5 Family Dwellings (A B C & D)
Number
Average Value
Number
Average Value
Number
Average Value
Number
Average Value
Number
Average Value
LOANS ORIGINATED
13
$92,258
77
$91,692
78
$70,644
27
$18,781
5
$102,448
APPLICATIONS APPROVED, NOT ACCEPTED
5
$46,698
21
$55,838
39
$74,560
5
$12,138
0
$0
APPLICATIONS DENIED
7
$53,193
67
$47,853
67
$70,559
13
$18,594
1
$25,720
APPLICATIONS WITHDRAWN
2
$52,975
13
$58,076
44
$62,487
3
$6,170
4
$45,002
FILES CLOSED FOR INCOMPLETENESS
0
$0
3
$80,230
14
$88,386
0
$0
0
$0
Aggregated Statistics For Year 1999 (Based on 2 partial tracts)
A) FHA, FSA/RHS & VA Home Purchase Loans
B) Conventional Home Purchase Loans
C) Refinancings
D) Home Improvement Loans
F) Non-occupant Loans on < 5 Family Dwellings (A B C & D)
Detailed PMIC statistics for the following Tracts:0102.00
, 0110.00
2004 - 2018 National Fire Incident Reporting System (NFIRS) incidents
Based on the data from the years 2004 - 2018 the average number of fire incidents per year is 21. The highest number of reported fires - 58 took place in 2010, and the least - 0 in 2005. The data has a decreasing trend.
When looking into fire subcategories, the most reports belonged to: Outside Fires (51.9%), and Structure Fires (30.7%).
Fire incident types reported to NFIRS in Zip Code 37373


 Nearest zip codes: 37308, 37338, 37321, 37379, 37341, 37336.


 Based on the data from the years 2004 - 2018 the average number of fire incidents per year is 21. The highest number of reported fires - 58 took place in 2010, and the least - 0 in 2005. The data has a decreasing trend.
 When looking into fire subcategories, the most reports belonged to: Outside Fires (51.9%), and Structure Fires (30.7%).