Estimated zip code population in 2022: 7,026 Zip code population in 2010: 6,784 Zip code population in 2000: 6,631
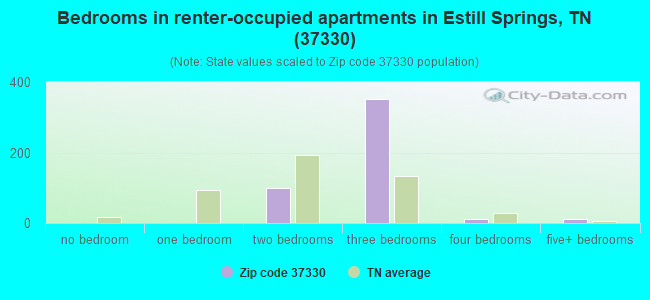
Houses and condos: 3,428 Renter-occupied apartments: 487
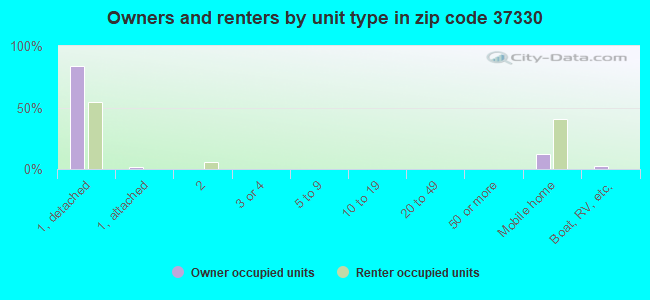
% of renters here:
16%
State:
33%
March 2022 cost of living index in zip code 37330: 80.9 (low, U.S. average is 100)
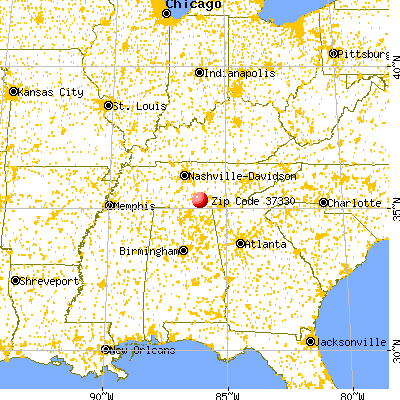
Land area: 36.0 sq. mi. Water area: 6.1 sq. mi.
Population density: 195 people per square mile
(very low).
OSM Map
General Map
Google Map
MSN Map
OSM Map
General Map
Google Map
MSN Map
OSM Map
General Map
Google Map
MSN Map
OSM Map
General Map
Google Map
MSN Map
Please wait while loading the map...
Real estate property taxes paid for housing units in 2022:
This zip code:
0.4% ($1,003)
Tennessee:
0.5% ($1,376)
Median real estate property taxes paid for housing units with mortgages in 2022: $981 (0.4%) Median real estate property taxes paid for housing units with no mortgage in 2022: $1,145 (0.5%)
Business Search- 14 Million verified businesses
Males: 3,585
(51.0%)
Females: 3,440
(49.0%)
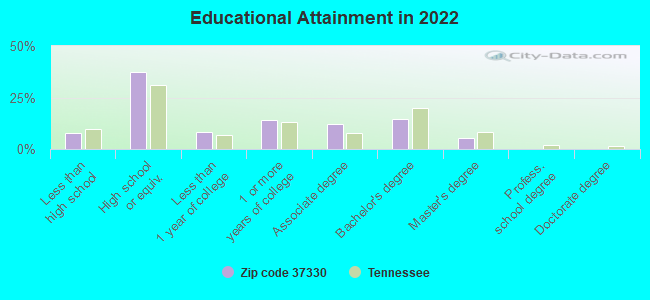
For population 25 years and over in 37330:
High school or higher: 91.6%
Bachelor's degree or higher: 20.1%
Graduate or professional degree: 5.8%
Unemployed: 2.1%
Mean travel time to work (commute): 25.0 minutes
For population 15 years and over in 37330:
Never married: 19.7%
Now married: 58.9%
Separated: 2.5%
Widowed: 5.9%
Divorced: 13.1%
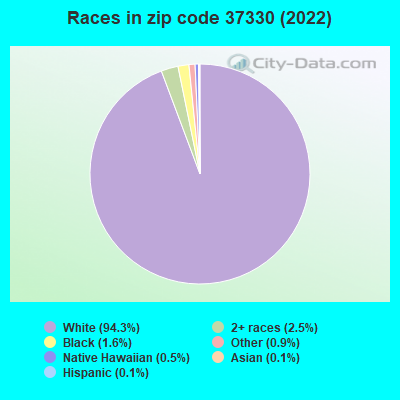
Zip code 37330 compared to state average:
Black race population percentage significantly below state average.
Hispanic race population percentage significantly below state average.
Foreign-born population percentage significantly below state average.
Renting percentage below state average.
Length of stay since moving in significantly above state average.
Averages for the 2020 tax year for zip code 37330, filed in 2021:
Average Adjusted Gross Income (AGI) in 2020: $58,388 (Individual Income Tax Returns)
Here:
$58,388
State:
$69,014
Salary/wage: $46,630 (reported on 80.5% of returns)
Here:
$46,630
State:
$55,872
(% of AGI for various income ranges: 1016.4% for AGIs below $25k, 3353.1% for AGIs $25k-50k, 5863.7% for AGIs $50k-75k, 8555.0% for AGIs $75k-100k, 13588.0% for AGIs $100k-200k)
Taxable interest for individuals: $1,094 (reported on 31.7% of returns)
This zip code:
$1,094
Tennessee:
$1,945
(% of AGI for various income ranges: 20.6% for AGIs below $25k, 28.3% for AGIs $25k-50k, 36.6% for AGIs $50k-75k, 43.3% for AGIs $75k-100k, 128.0% for AGIs $100k-200k)
Ordinary dividends: $5,920 (reported on 12.3% of returns)
Here:
$5,920
State:
$8,105
(% of AGI for various income ranges: 21.3% for AGIs below $25k, 13.7% for AGIs $25k-50k, 41.3% for AGIs $50k-75k, 97.3% for AGIs $75k-100k, 181.2% for AGIs $100k-200k)
Net capital gain/loss in AGI: +$18,932 (reported on 11.4% of returns)
Here:
+$18,932
State:
+$33,664
(% of AGI for various income ranges: 4.9% for AGIs below $25k, 14.9% for AGIs $25k-50k, 54.5% for AGIs $50k-75k, 91.0% for AGIs $75k-100k, 562.4% for AGIs $100k-200k)
Profit/loss from business: +$12,726 (reported on 12.9% of returns)
Here:
+$12,726
State:
+$18,991
(% of AGI for various income ranges: 116.6% for AGIs below $25k, 95.5% for AGIs $25k-50k, 197.4% for AGIs $50k-75k, 243.0% for AGIs $75k-100k, 375.6% for AGIs $100k-200k)
Taxable individual retirement arrangement distribution: $21,665 (reported on 10.2% of returns)
37330:
$21,665
Tennessee:
$20,036
(% of AGI for various income ranges: 86.5% for AGIs below $25k, 126.3% for AGIs $25k-50k, 211.6% for AGIs $50k-75k, 448.3% for AGIs $75k-100k, 1410.4% for AGIs $100k-200k)
Total itemized deductions: $36,538 (reported on 2.4% of returns)
Here:
$36,538
State:
$40,136
(% of AGI for various income ranges: 296.3% for AGIs $50k-75k, 718.8% for AGIs $100k-200k)
Charity contributions: $19,867 (reported on 1.8% of returns)
Here:
$19,867
State:
$19,852
(% of AGI for various income ranges: 22.7% for AGIs $25k-50k, 408.8% for AGIs $100k-200k)
Taxes paid: $5,471 (reported on 2.1% of returns)
37330:
$5,471
State:
$6,038
(% of AGI for various income ranges: 12.8% for AGIs $25k-50k, 114.8% for AGIs $100k-200k)
Earned income credit: $2,102 (reported on 17.7% of returns)
Here:
$2,102
State:
$2,391
(% of AGI for various income ranges: 96.7% for AGIs below $25k, 54.4% for AGIs $25k-50k)
Percentage of individuals using paid preparers for their 2020 taxes: 93.4%
Here:
93%
State:
93%
(% for various income ranges: 93.8% for AGIs below $25k, 94.3% for AGIs $25k-50k, 93.8% for AGIs $50k-75k, 92.7% for AGIs $75k-100k, 89.5% for AGIs $100k-200k, 100.0% for AGIs over 200k)
Averages for the 2012 tax year for zip code 37330, filed in 2013:
Average Adjusted Gross Income (AGI) in 2012: $42,873 (Individual Income Tax Returns)
Here:
$42,873
State:
$53,767
Salary/wage: $38,961 (reported on 83.1% of returns)
Here:
$38,961
State:
$45,421
(% of AGI for various income ranges: 70.7% for AGIs below $25k, 79.9% for AGIs $25k-50k, 80.0% for AGIs $50k-75k, 78.8% for AGIs $75k-100k, 72.3% for AGIs $100k-200k, 54.7% for AGIs over 200k)
Taxable interest for individuals: $895 (reported on 34.4% of returns)
This zip code:
$895
Tennessee:
$1,732
(% of AGI for various income ranges: 1.3% for AGIs below $25k, 0.6% for AGIs $25k-50k, 0.7% for AGIs $50k-75k, 0.4% for AGIs $75k-100k, 0.5% for AGIs $100k-200k, 1.6% for AGIs over 200k)
Ordinary dividends: $1,824 (reported on 13.3% of returns)
Here:
$1,824
State:
$6,739
(% of AGI for various income ranges: 0.6% for AGIs below $25k, 0.4% for AGIs $25k-50k, 0.6% for AGIs $50k-75k, 0.3% for AGIs $75k-100k, 0.7% for AGIs $100k-200k, 1.2% for AGIs over 200k)
Net capital gain/loss in AGI: +$2,242 (reported on 8.4% of returns)
Here:
+$2,242
State:
+$19,082
(% of AGI for various income ranges: 0.3% for AGIs $25k-50k, 0.4% for AGIs $50k-75k, 1.0% for AGIs $75k-100k, 0.5% for AGIs $100k-200k)
Profit/loss from business: +$10,538 (reported on 13.6% of returns)
Here:
+$10,538
State:
+$15,240
(% of AGI for various income ranges: 8.2% for AGIs below $25k, 3.0% for AGIs $25k-50k, 2.3% for AGIs $50k-75k, 1.5% for AGIs $75k-100k, 4.8% for AGIs $100k-200k)
Taxable individual retirement arrangement distribution: $15,067 (reported on 9.7% of returns)
37330:
$15,067
Tennessee:
$15,505
(% of AGI for various income ranges: 3.8% for AGIs below $25k, 2.3% for AGIs $25k-50k, 3.2% for AGIs $50k-75k, 3.0% for AGIs $75k-100k, 6.4% for AGIs $100k-200k)
Total itemized deductions: $17,821 (22% of AGI, reported on 15.3% of returns)
Here:
$17,821
State:
$21,976
Here:
22.2% of AGI
State:
17.8% of AGI
(% of AGI for various income ranges: 4.9% for AGIs below $25k, 5.0% for AGIs $25k-50k, 5.9% for AGIs $50k-75k, 5.8% for AGIs $75k-100k, 7.8% for AGIs $100k-200k, 12.6% for AGIs over 200k)
Charity contributions: $5,877 (reported on 11.4% of returns)
Here:
$5,877
State:
$6,709
(% of AGI for various income ranges: 0.5% for AGIs below $25k, 0.9% for AGIs $25k-50k, 0.9% for AGIs $50k-75k, 1.5% for AGIs $75k-100k, 2.3% for AGIs $100k-200k, 6.3% for AGIs over 200k)
Taxes paid: $3,716 (reported on 14.6% of returns)
37330:
$3,716
State:
$4,829
(% of AGI for various income ranges: 0.7% for AGIs below $25k, 0.8% for AGIs $25k-50k, 1.1% for AGIs $50k-75k, 1.3% for AGIs $75k-100k, 1.8% for AGIs $100k-200k, 2.6% for AGIs over 200k)
Earned income credit: $2,167 (reported on 21.4% of returns)
Here:
$2,167
State:
$2,404
(% of AGI for various income ranges: 6.4% for AGIs below $25k, 1.4% for AGIs $25k-50k)
Percentage of individuals using paid preparers for their 2012 taxes: 52.3%
Here:
52%
State:
52%
(% for various income ranges: 50.4% for AGIs below $25k, 51.9% for AGIs $25k-50k, 57.4% for AGIs $50k-75k, 53.6% for AGIs $75k-100k, 50.0% for AGIs $100k-200k, 66.7% for AGIs over 200k)
Averages for the 2004 tax year for zip code 37330, filed in 2005:
Average Adjusted Gross Income (AGI) in 2004: $37,716 (Individual Income Tax Returns)
Here:
$37,716
State:
$44,088
Salary/wage: $35,075 (reported on 85.2% of returns)
Here:
$35,075
State:
$38,825
(% of AGI for various income ranges: 142.3% for AGIs below $10k, 74.3% for AGIs $10k-25k, 82.0% for AGIs $25k-50k, 83.5% for AGIs $50k-75k, 83.2% for AGIs $75k-100k, 63.8% for AGIs over 100k)
Taxable interest for individuals: $1,219 (reported on 43.4% of returns)
This zip code:
$1,219
Tennessee:
$1,802
(% of AGI for various income ranges: 6.6% for AGIs below $10k, 2.2% for AGIs $10k-25k, 1.1% for AGIs $25k-50k, 1.2% for AGIs $50k-75k, 0.6% for AGIs $75k-100k, 1.9% for AGIs over 100k)
Taxable dividends: $1,362 (reported on 14.3% of returns)
Here:
$1,362
State:
$3,727
(% of AGI for various income ranges: 2.3% for AGIs below $10k, 0.4% for AGIs $10k-25k, 0.5% for AGIs $25k-50k, 0.3% for AGIs $50k-75k, 0.3% for AGIs $75k-100k, 1.0% for AGIs over 100k)
Net capital gain/loss: +$4,750 (reported on 11.8% of returns)
Here:
+$4,750
State:
+$15,776
(% of AGI for various income ranges: 9.1% for AGIs below $10k, 0.3% for AGIs $10k-25k, 0.3% for AGIs $25k-50k, 1.0% for AGIs $50k-75k, 2.5% for AGIs $75k-100k, 3.2% for AGIs over 100k)
Profit/loss from business: +$8,561 (reported on 15.1% of returns)
Here:
+$8,561
State:
+$12,882
(% of AGI for various income ranges: -5.2% for AGIs below $10k, 5.3% for AGIs $10k-25k, 3.1% for AGIs $25k-50k, 2.2% for AGIs $50k-75k, 1.3% for AGIs $75k-100k, 7.0% for AGIs over 100k)
IRA payment deduction: $3,117 (reported on 2.0% of returns)
37330:
$3,117
Tennessee:
$2,934
Total itemized deductions: $15,032 (21% of AGI, reported on 17.3% of returns)
Here:
$15,032
State:
$18,035
Here:
21.4% of AGI
State:
19.9% of AGI
(% of AGI for various income ranges: 7.1% for AGIs below $10k, 5.0% for AGIs $10k-25k, 5.9% for AGIs $25k-50k, 7.2% for AGIs $50k-75k, 7.7% for AGIs $75k-100k, 8.4% for AGIs over 100k)
Charity contributions deductions: $4,076 (5% of AGI, reported on 14.3% of returns)
Here:
$4,076
State:
$5,167
Here:
5.4% of AGI
State:
5.3% of AGI
(% of AGI for various income ranges: 0.8% for AGIs $10k-25k, 1.0% for AGIs $25k-50k, 1.3% for AGIs $50k-75k, 1.9% for AGIs $75k-100k, 3.0% for AGIs over 100k)
Total tax: $4,785 (reported on 75.9% of returns)
37330:
$4,785
State:
$7,482
(% of AGI for various income ranges: 5.8% for AGIs below $10k, 3.9% for AGIs $10k-25k, 6.4% for AGIs $25k-50k, 8.9% for AGIs $50k-75k, 10.7% for AGIs $75k-100k, 18.5% for AGIs over 100k)
Earned income credit: $1,775 (reported on 17.8% of returns)
Here:
$1,775
State:
$1,826
Percentage of individuals using paid preparers for their 2004 taxes: 59.2%
Here:
59%
State:
60%
(% for various income ranges: 46.7% for AGIs below $10k, 65.0% for AGIs $10k-25k, 63.1% for AGIs $25k-50k, 61.5% for AGIs $50k-75k, 51.6% for AGIs $75k-100k, 58.3% for AGIs over 100k)
Likely homosexual households (counted as self-reported same-sex unmarried-partner households)
Lesbian couples: 0.6% of all households
Gay men: 0.2% of all households
Household received Food Stamps/SNAP in the past 12 months: 248 Household did not receive Food Stamps/SNAP in the past 12 months: 2,711
Women who had a birth in the past 12 months: 98 (28 now married, 67 unmarried) Women who did not have a birth in the past 12 months: 1,334 (773 now married, 560 unmarried)
Housing units in zip code 37330 with a mortgage: 1,483 (184 second mortgage, 158 both second mortgage and home equity loan) Median monthly owner costs for units with a mortgage: $1,216 Median monthly owner costs for units without a mortgage: $344
Residents with income below the poverty level in 2022:
This zip code:
14.7%
Whole state:
13.3%
Residents with income below 50% of the poverty level in 2022:
This zip code:
5.9%
Whole state:
7.1%
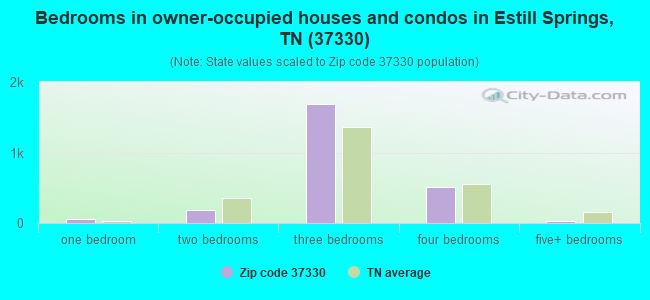
Median number of rooms in houses and condos:
Here:
6.2
State:
6.5
Median number of rooms in apartments:
Here:
4.9
State:
4.4
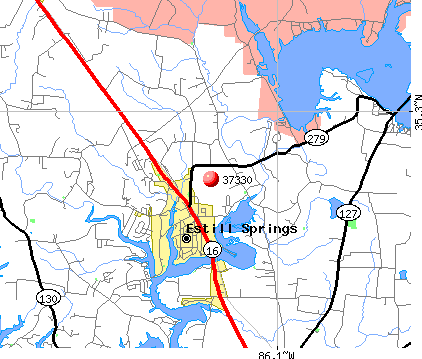
Notable locations in this zip code not listed on our city pages
Notable locations in zip code 37330: Morris Ferry Dock (A), Camp Arrowhead (B), Elklore Cabin Site (C), Highland Ridge CAbin Site (D), Estill Springs Volunteer Fire Department (E), Estill Springs City Hall (F), Trans Med Ambulance Franklin County (G). Display/hide their locations on the map
Churches in zip code 37330 include: Harris Chapel (A), Pleasant Grove Church (B), Allen Chapel (C), Capitol Hill Church of Christ (D), First Baptist Church (E), New Center Grove Church (F), New Brick Church (G), Mount Olivet Church (H), Cross Roads Baptist Church (I). Display/hide their locations on the map
Cemeteries: Hunt Cemetery (1), Beth Page Cemetery (2), Clemmons Cemetery (3), New Awalt Cemetery (4), Simpson Cemetery (5), Harris Chapel Cemetery (6), Harris Cemetery (7). Display/hide their locations on the map
Streams, rivers, and creeks: Long Branch (A), Little Hurricane Creek (B), Dry Creek (C), Childer Creek (D), Carvers Branch (E), Bear Branch (F), Winchester Springs Branch (G), Sarvis Branch (H), Taylor Creek (I). Display/hide their locations on the map
Parks in zip code 37330 include: Franklin County Park (1), Estill Springs Park (2), Rock Creek Public Use Area (3), Pleasant Grove Public Use Area (4). Display/hide their locations on the map
683 married couples with children.
502 single-parent households (117 men, 385 women).
98.8% of residents of 37330 zip code speak English at home.
0.1% of residents speak Spanish at home (100% very well).
0.1% of residents speak other Indo-European language at home (100% very well).
0.5% of residents speak Asian or Pacific Island language at home (100% well).
0.2% of residents speak other language at home (100% very well).
Foreign born population: 36 (0.5%) (48.2% of them are naturalized citizens)
This zip code:
0.5%
Whole state:
5.6%
56%Haiti
39%Czechoslovakia (includes Czech Republic and Slovakia)
19%France
8%Thailand
3%Hong Kong
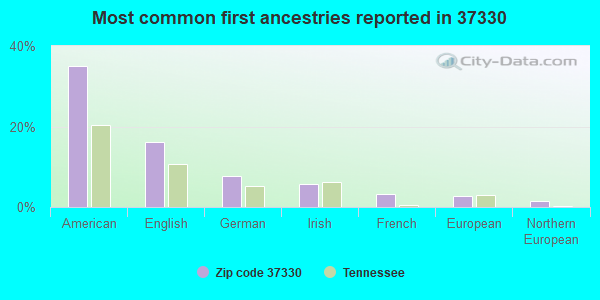
35%American
16%English
8%German
6%Irish
3%French
3%European
1%Northern European
Year of entry for the foreign-born population
212010 or later
72000 to 2009
581990 to 1999
74Before 1990
Facilities with environmental interests located in this zip code:
CENT. GROVE WINCHESTER SPRG UD (40 PLEASANT GROVE ROAD in ESTILL SPRINGS, TN)
National Pollutant Discharge Elimination System NON-MAJOR (Tracking pollutant discharge elimination systems) - permit Business SIC classification: WATER SUPPLY Organizations: CENTER GROVE-WINCHESTER SPRING (CONTACT/OPERATOR)
, DAVID STAFFORD (CONTACT/OWNER)
Alternative names: CENTER GROVE WAT TREAT PLANT, CENTER GROVE WINCHESTER SPG UD, CENTER GROVE WTP
Housing units lacking complete plumbing facilities: 5.3% Housing units lacking complete kitchen facilities: 5.4%
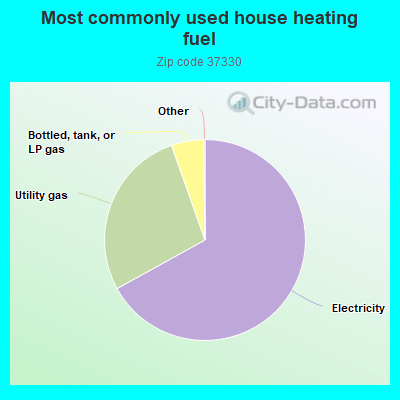
66.9%Electricity
27.6%Utility gas
5.2%Bottled, tank, or LP gas
Population in 1990: 5,778. Population change in the 1990s: +853 (+14.8%).
Place of birth for U.S.-born residents:
This state: 4,411
Northeast: 294
Midwest: 862
South: 944
West: 316
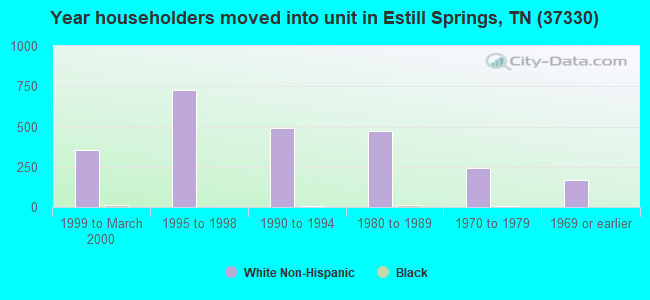
62% of the 37330 zip code residents lived in the same house 5 years ago. Out of people who lived in different houses, 53% lived in this county. Out of people who lived in different counties, 50% lived in Tennessee.
92% of the 37330 zip code residents lived in the same house 1 year ago. Out of people who lived in different houses, 66% moved from this county. Out of people who lived in different houses, 23% moved from different county within same state. Out of people who lived in different houses, 9% moved from different state.
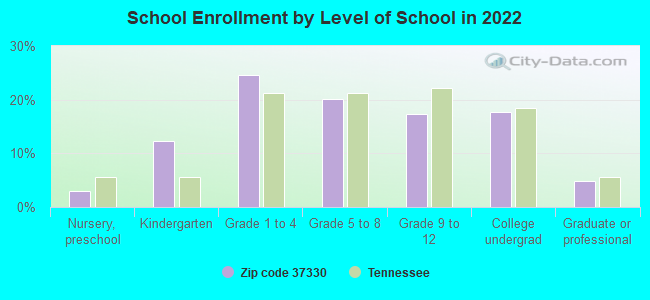
Private vs. public school enrollment:
Students in private schools in grades 1 to 8 (elementary and middle school): 36
Here:
6.0%
Tennessee:
15.0%
Students in private schools in grades 9 to 12 (high school): 106
Here:
44.9%
Tennessee:
16.2%
Students in private undergraduate colleges: 48
Here:
20.2%
Tennessee:
23.5%
Occupation by median earnings in the past 12 months ($)
126,610Architecture and engineering occupations
74,487Business and financial operations occupations
73,871Health diagnosing and treating practitioners and other technical occupations
49,538Construction and extraction occupations
48,654Education, training, and library occupations
46,406Community and social service occupations
Companies with federal contracts located in this zip code:
UNIVERSAL TECHNOLOGIES INC (165 ALSONIA STREET in ESTILL SPRINGS, TN; small business) : $47,991,502 in 142 contractsfrom 1999 to 2006
Contracts for Guns, through 30 mm, Miscellaneous Weapons, Waste Disposal Equipment, Aircraft Landing Gear Components, and moreby Army, Navy, Air Force, Defense Logistics Agency, and others Signed by year:2000: $1,503,679; 2001: $4,693,954; 2002: $3,139,547; 2003: $9,253,416; 2004: $7,539,656; 2005: $20,024,069; 2006: $1,130,029.
Biggest contracts:
$8,272,000 with Army for Guns, through 30 mm. Signed on 2005-07-20. Completion date: 2003-12-30.
$8,222,000, same as above.Signed on 2005-01-13. Completion date: 2003-12-30.
$4,000,000, same as above.Signed on 2003-11-24. Completion date: 2003-12-30.
$2,877,700, same as above.Signed on 2004-06-21. Completion date: 2003-12-30.
Top industries in this zip code by the number of employees in 2005:
Other Services (except Public Administration): Religious Organizations (10-19 employees: 1 establishment, 1-4 employees: 3 establishments)
Administrative and Support and Waste Management and Remediation Services: Solid Waste Landfill (10-19: 1)
Accommodation and Food Services: Full-Service Restaurants (10-19: 1)
Health Care and Social Assistance: All Other Outpatient Care Centers (10-19: 1)
Construction: New Single-Family Housing Construction (except Operative Builders) (5-9: 1, 1-4: 1)
People in group quarters in 2000:
13 people in other nonhousehold living situations
Fatal accident statistics in 2013:
Fatal accident count: 1
Vehicles involved in fatal accidents: 1
Fatal accidents caused by drunken drivers: 1
Fatalities: 2
Persons involved in fatal accidents: 2
Pedestrians involved in fatal accidents: 0
Fatal accident statistics in 2012:
Fatal accident count: 1
Vehicles involved in fatal accidents: 3
Fatal accidents caused by drunken drivers: 0
Fatalities: 1
Persons involved in fatal accidents: 4
Pedestrians involved in fatal accidents: 0
2002 - 2018 National Fire Incident Reporting System (NFIRS) incidents
Based on the data from the years 2002 - 2018 the average number of fires per year is 38. The highest number of fire incidents - 98 took place in 2011, and the least - 5 in 2002. The data has an increasing trend.
When looking into fire subcategories, the most incidents belonged to: Structure Fires (51.2%), and Outside Fires (37.6%).
Fire incident types reported to NFIRS in Zip Code 37330


 Nearest zip codes: 37398, 37388, 37324, 37318, 37306, 37360.


 Based on the data from the years 2002 - 2018 the average number of fires per year is 38. The highest number of fire incidents - 98 took place in 2011, and the least - 5 in 2002. The data has an increasing trend.
 When looking into fire subcategories, the most incidents belonged to: Structure Fires (51.2%), and Outside Fires (37.6%).