Estimated zip code population in 2022: 2,271 Zip code population in 2010: 2,760 Zip code population in 2000: 2,333
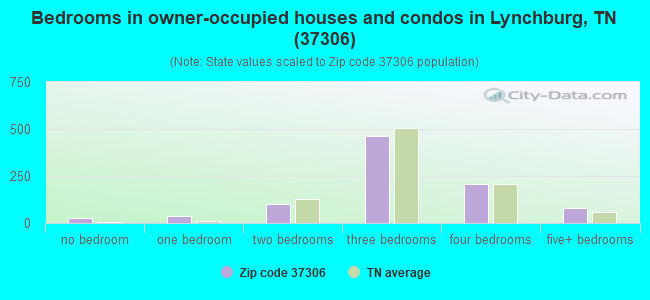
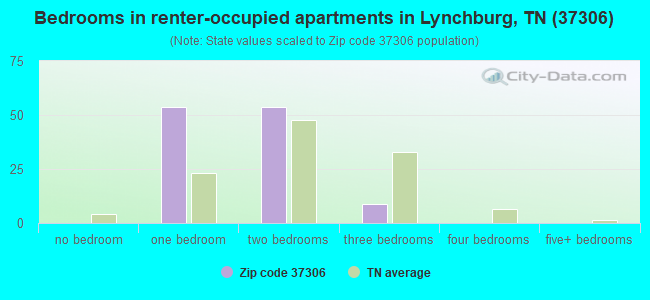
Houses and condos: 1,248 Renter-occupied apartments: 114
% of renters here:
11%
State:
33%
March 2022 cost of living index in zip code 37306: 77.9 (low, U.S. average is 100)
Land area: 118.8 sq. mi. Water area: 0.1 sq. mi.
Population density: 19 people per square mile
(very low).
OSM Map
General Map
Google Map
MSN Map
OSM Map
General Map
Google Map
MSN Map
OSM Map
General Map
Google Map
MSN Map
OSM Map
General Map
Google Map
MSN Map
Please wait while loading the map...
Real estate property taxes paid for housing units in 2022:
This zip code:
0.4% ($905)
Tennessee:
0.5% ($1,376)
Median real estate property taxes paid for housing units with mortgages in 2022: $847 (0.3%) Median real estate property taxes paid for housing units with no mortgage in 2022: $957 (0.4%)
Business Search- 14 Million verified businesses
Males: 1,187
(52.3%)
Females: 1,083
(47.7%)
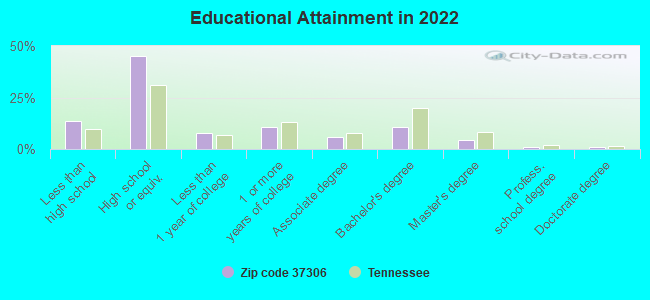
For population 25 years and over in 37306:
High school or higher: 84.4%
Bachelor's degree or higher: 16.7%
Graduate or professional degree: 6.3%
Mean travel time to work (commute): 26.8 minutes
For population 15 years and over in 37306:
Never married: 22.3%
Now married: 49.2%
Separated: 4.2%
Widowed: 12.5%
Divorced: 11.7%
Zip code 37306 compared to state average:
Unemployed percentage significantly below state average.
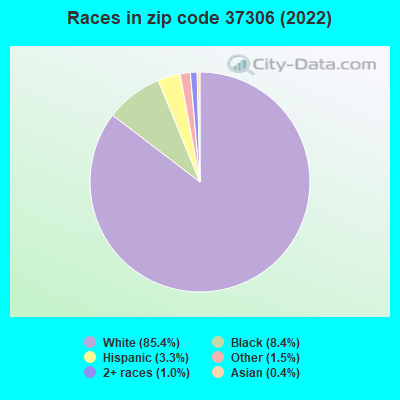
Black race population percentage below state average.
Hispanic race population percentage below state average.
Median age significantly above state average.
Foreign-born population percentage significantly below state average.
Renting percentage significantly below state average.
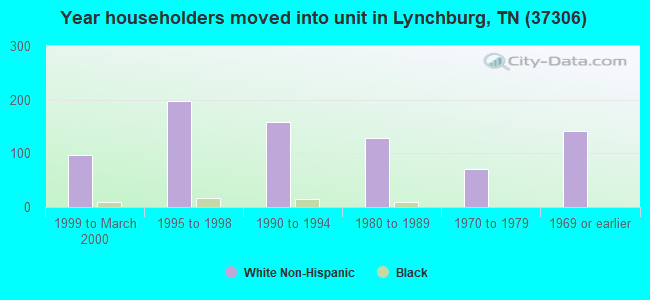
Length of stay since moving in significantly above state average.
Percentage of population with a bachelor's degree or higher below state average.
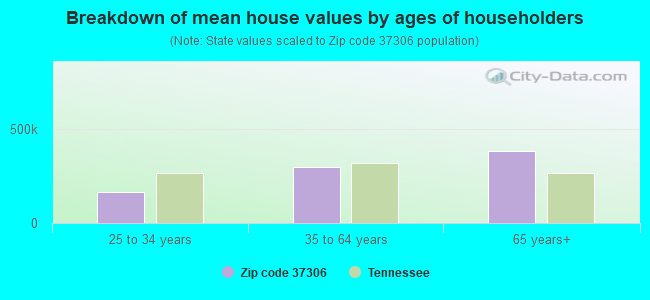
Estimated median house/condo value in 2022: $241,239
37306:
$241,239
Tennessee:
$284,800
According to our research of Tennessee and other state lists, there were 8 registered sex offenders living in 37306 zip code as of May 17, 2024. The ratio of all residents to sex offenders in zip code 37306 is 337 to 1. The ratio of registered sex offenders to all residents in this zip code is near the state average.
Median resident age:
This zip code:
50.7 years
Tennessee median age:
39.2 years
Average household size:
This zip code:
2.2 people
Tennessee:
2.4 people
Averages for the 2020 tax year for zip code 37306, filed in 2021:
Average Adjusted Gross Income (AGI) in 2020: $53,896 (Individual Income Tax Returns)
Here:
$53,896
State:
$69,014
Salary/wage: $46,724 (reported on 79.4% of returns)
Here:
$46,724
State:
$55,872
(% of AGI for various income ranges: 1150.6% for AGIs below $25k, 3621.6% for AGIs $25k-50k, 6004.2% for AGIs $50k-75k, 8851.2% for AGIs $75k-100k, 12350.8% for AGIs $100k-200k)
Taxable interest for individuals: $1,365 (reported on 31.7% of returns)
This zip code:
$1,365
Tennessee:
$1,945
(% of AGI for various income ranges: 18.5% for AGIs below $25k, 78.4% for AGIs $25k-50k, 25.8% for AGIs $50k-75k, 67.5% for AGIs $75k-100k, 81.7% for AGIs $100k-200k)
Ordinary dividends: $3,447 (reported on 11.9% of returns)
Here:
$3,447
State:
$8,105
(% of AGI for various income ranges: 18.0% for AGIs $25k-50k, 49.2% for AGIs $50k-75k, 93.8% for AGIs $75k-100k, 281.7% for AGIs $100k-200k)
Net capital gain/loss in AGI: +$13,979 (reported on 11.1% of returns)
Here:
+$13,979
State:
+$33,664
(% of AGI for various income ranges: 66.4% for AGIs $25k-50k, 220.8% for AGIs $50k-75k, 1271.7% for AGIs $100k-200k)
Profit/loss from business: +$12,771 (reported on 16.7% of returns)
Here:
+$12,771
State:
+$18,991
(% of AGI for various income ranges: 155.6% for AGIs below $25k, 262.8% for AGIs $25k-50k, 575.8% for AGIs $50k-75k, 670.8% for AGIs $100k-200k)
Taxable individual retirement arrangement distribution: $17,410 (reported on 7.9% of returns)
37306:
$17,410
Tennessee:
$20,036
(% of AGI for various income ranges: 58.2% for AGIs below $25k, 127.2% for AGIs $25k-50k, 1531.2% for AGIs $75k-100k)
Total itemized deductions: $27,000 (reported on 2.4% of returns)
Here:
$27,000
State:
$40,136
(% of AGI for various income ranges: 675.0% for AGIs $50k-75k)
Charity contributions: $8,650 (reported on 1.6% of returns)
Here:
$8,650
State:
$19,852
(% of AGI for various income ranges: 144.2% for AGIs $50k-75k)
Taxes paid: $4,267 (reported on 2.4% of returns)
37306:
$4,267
State:
$6,038
(% of AGI for various income ranges: 106.7% for AGIs $100k-200k)
Earned income credit: $2,183 (reported on 18.3% of returns)
Here:
$2,183
State:
$2,391
(% of AGI for various income ranges: 92.4% for AGIs below $25k, 75.2% for AGIs $25k-50k)
Percentage of individuals using paid preparers for their 2020 taxes: 92.1%
Here:
92%
State:
93%
(% for various income ranges: 91.3% for AGIs below $25k, 93.9% for AGIs $25k-50k, 94.1% for AGIs $50k-75k, 90.9% for AGIs $75k-100k, 87.5% for AGIs $100k-200k, 100.0% for AGIs over 200k)
Averages for the 2012 tax year for zip code 37306, filed in 2013:
Average Adjusted Gross Income (AGI) in 2012: $43,381 (Individual Income Tax Returns)
Here:
$43,381
State:
$53,767
Salary/wage: $37,870 (reported on 81.4% of returns)
Here:
$37,870
State:
$45,421
(% of AGI for various income ranges: 75.9% for AGIs below $25k, 76.2% for AGIs $25k-50k, 78.0% for AGIs $50k-75k, 79.3% for AGIs $75k-100k, 56.3% for AGIs $100k-200k)
Taxable interest for individuals: $1,438 (reported on 32.7% of returns)
This zip code:
$1,438
Tennessee:
$1,732
(% of AGI for various income ranges: 1.6% for AGIs below $25k, 1.1% for AGIs $25k-50k, 1.4% for AGIs $50k-75k, 0.5% for AGIs $75k-100k, 1.0% for AGIs $100k-200k)
Ordinary dividends: $1,893 (reported on 12.4% of returns)
Here:
$1,893
State:
$6,739
(% of AGI for various income ranges: 0.7% for AGIs below $25k, 0.6% for AGIs $25k-50k, 0.4% for AGIs $50k-75k, 0.8% for AGIs $100k-200k)
Net capital gain/loss in AGI: +$5,142 (reported on 10.6% of returns)
Here:
+$5,142
State:
+$19,082
(% of AGI for various income ranges: 1.0% for AGIs $25k-50k, 2.9% for AGIs $50k-75k, 1.6% for AGIs $100k-200k)
Profit/loss from business: +$9,784 (reported on 16.8% of returns)
Here:
+$9,784
State:
+$15,240
(% of AGI for various income ranges: 10.1% for AGIs below $25k, 7.8% for AGIs $25k-50k, 4.8% for AGIs $75k-100k)
Taxable individual retirement arrangement distribution: $14,822 (reported on 8.0% of returns)
37306:
$14,822
Tennessee:
$15,505
(% of AGI for various income ranges: 2.9% for AGIs below $25k, 4.5% for AGIs $25k-50k, 8.6% for AGIs $75k-100k)
Total itemized deductions: $18,385 (19% of AGI, reported on 11.5% of returns)
Here:
$18,385
State:
$21,976
Here:
19.0% of AGI
State:
17.8% of AGI
(% of AGI for various income ranges: 6.3% for AGIs $25k-50k, 5.2% for AGIs $50k-75k, 4.9% for AGIs $75k-100k, 5.9% for AGIs $100k-200k)
Charity contributions: $5,620 (reported on 8.8% of returns)
Here:
$5,620
State:
$6,709
(% of AGI for various income ranges: 0.8% for AGIs $25k-50k, 1.6% for AGIs $50k-75k, 2.3% for AGIs $100k-200k)
Taxes paid: $3,623 (reported on 11.5% of returns)
37306:
$3,623
State:
$4,829
(% of AGI for various income ranges: 0.7% for AGIs $25k-50k, 0.8% for AGIs $50k-75k, 1.1% for AGIs $75k-100k, 1.6% for AGIs $100k-200k)
Earned income credit: $2,404 (reported on 22.1% of returns)
Here:
$2,404
State:
$2,404
(% of AGI for various income ranges: 7.2% for AGIs below $25k, 1.1% for AGIs $25k-50k)
Percentage of individuals using paid preparers for their 2012 taxes: 64.6%
Here:
65%
State:
52%
(% for various income ranges: 56.9% for AGIs below $25k, 67.9% for AGIs $25k-50k, 68.8% for AGIs $50k-75k, 77.8% for AGIs $75k-100k, 77.8% for AGIs $100k-200k)
Averages for the 2004 tax year for zip code 37306, filed in 2005:
Average Adjusted Gross Income (AGI) in 2004: $33,261 (Individual Income Tax Returns)
Here:
$33,261
State:
$44,088
Salary/wage: $31,583 (reported on 83.1% of returns)
Here:
$31,583
State:
$38,825
(% of AGI for various income ranges: 224.6% for AGIs below $10k, 77.9% for AGIs $10k-25k, 85.5% for AGIs $25k-50k, 81.3% for AGIs $50k-75k, 72.9% for AGIs $75k-100k, 53.7% for AGIs over 100k)
Taxable interest for individuals: $1,575 (reported on 41.2% of returns)
This zip code:
$1,575
Tennessee:
$1,802
(% of AGI for various income ranges: 11.9% for AGIs below $10k, 2.4% for AGIs $10k-25k, 1.8% for AGIs $25k-50k, 1.1% for AGIs $50k-75k, 3.2% for AGIs $75k-100k, 1.6% for AGIs over 100k)
Taxable dividends: $1,480 (reported on 13.9% of returns)
Here:
$1,480
State:
$3,727
(% of AGI for various income ranges: 2.3% for AGIs below $10k, 0.8% for AGIs $10k-25k, 0.4% for AGIs $25k-50k, 0.3% for AGIs $50k-75k, 0.7% for AGIs $75k-100k, 1.4% for AGIs over 100k)
Net capital gain/loss: +$8,988 (reported on 14.9% of returns)
Here:
+$8,988
State:
+$15,776
(% of AGI for various income ranges: 6.4% for AGIs below $10k, 2.4% for AGIs $10k-25k, 1.6% for AGIs $25k-50k, 3.5% for AGIs $50k-75k, 4.4% for AGIs $75k-100k, 11.0% for AGIs over 100k)
Profit/loss from business: +$10,831 (reported on 17.3% of returns)
Here:
+$10,831
State:
+$12,882
(% of AGI for various income ranges: 13.1% for AGIs below $10k, 7.4% for AGIs $10k-25k, 4.7% for AGIs $25k-50k, 4.9% for AGIs $50k-75k, 4.6% for AGIs $75k-100k, 7.7% for AGIs over 100k)
IRA payment deduction: $3,435 (reported on 2.1% of returns)
37306:
$3,435
Tennessee:
$2,934
Total itemized deductions: $15,575 (24% of AGI, reported on 11.7% of returns)
Here:
$15,575
State:
$18,035
Here:
23.9% of AGI
State:
19.9% of AGI
(% of AGI for various income ranges: 4.7% for AGIs $10k-25k, 5.0% for AGIs $25k-50k, 5.6% for AGIs $50k-75k, 6.9% for AGIs $75k-100k, 6.2% for AGIs over 100k)
Charity contributions deductions: $4,685 (7% of AGI, reported on 8.4% of returns)
Here:
$4,685
State:
$5,167
Here:
6.7% of AGI
State:
5.3% of AGI
(% of AGI for various income ranges: 8.2% for AGIs below $10k, 0.9% for AGIs $25k-50k, 1.3% for AGIs $50k-75k, 1.7% for AGIs $75k-100k, 1.7% for AGIs over 100k)
Total tax: $4,043 (reported on 72.8% of returns)
37306:
$4,043
State:
$7,482
(% of AGI for various income ranges: 7.6% for AGIs below $10k, 4.0% for AGIs $10k-25k, 6.5% for AGIs $25k-50k, 8.0% for AGIs $50k-75k, 11.3% for AGIs $75k-100k, 17.7% for AGIs over 100k)
Earned income credit: $1,773 (reported on 19.4% of returns)
Here:
$1,773
State:
$1,826
Percentage of individuals using paid preparers for their 2004 taxes: 71.4%
Here:
71%
State:
60%
(% for various income ranges: 67.1% for AGIs below $10k, 72.9% for AGIs $10k-25k, 75.8% for AGIs $25k-50k, 68.0% for AGIs $50k-75k, 58.9% for AGIs $75k-100k, 90.6% for AGIs over 100k)
Notable locations in zip code 37306: Kaserman Switch (A), Salt Lick (B), Mount Zion (C), Rice Field (D), Hickory Ridge Point (E), Cal Place (F), Belvidere Rural Volunteer Fire Department (G), Belvidere Community Center (H), Keith Springs Volunteer Fire Department (I), Lexie Crossroads Volunteer Fire Department (J). Display/hide their locations on the map
Churches in zip code 37306 include: Walnut Grove United Methodist Church (A), Maxwell Baptist Church (B), Rowe Gap Church (C), Belvidere Church (D), Keith Spring Church (E), Belvidere United Church of Christ (F), Lexie Cross Roads Baptist Church (G), Lexie Church of Christ (H), Burning Bush Church (I). Display/hide their locations on the map
Cemeteries: Vanzant Cemetery (1), Wakefield Cemetery (2), Walker Cemetery (3), Waller Cemetery (4), Kaserman Cemetery (5), Keith Spring Cemetery (6), Limbaugh Cemetery (7). Display/hide their locations on the map
Lakes, reservoirs, and swamps: Long Pond (A), Kings Hole (B), Mingo Pond (C), Blue Hole (D), Glaus Pond (E), Lakeview Lake Number One (F), Mingo Swamp (G). Display/hide their locations on the map
Streams, rivers, and creeks: Keller Creek (A), Farris Creek (B), Factory Branch (C), Dry Creek (D), Collins Branch (E), Carter Branch (F), Caney Hollow Creek (G), Water Cure Creek (H), Neal Creek (I). Display/hide their locations on the map
Size of family households: 399 2-persons, 64 3-persons, 96 4-persons, 57 5-persons, 18 6-persons, 5 7-or-more-persons
Size of nonfamily households: 319 1-person, 63 2-persons
201 married couples with children.
51 single-parent households (19 men, 32 women).
97.6% of residents of 37306 zip code speak English at home.
1.8% of residents speak Spanish at home (60% very well, 22% not well, 18% not at all).
0.9% of residents speak other Indo-European language at home (100% very well).
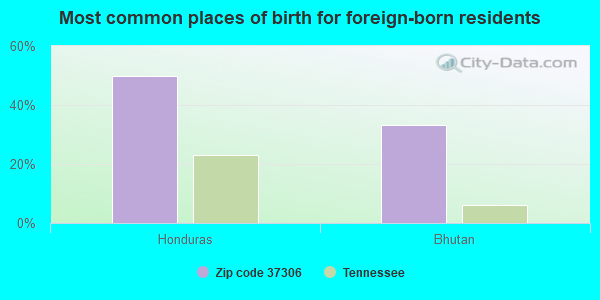
Foreign born population: 23 (1.1%) (60.5% of them are naturalized citizens)
This zip code:
1.1%
Whole state:
5.6%
50%Honduras
33%Bhutan
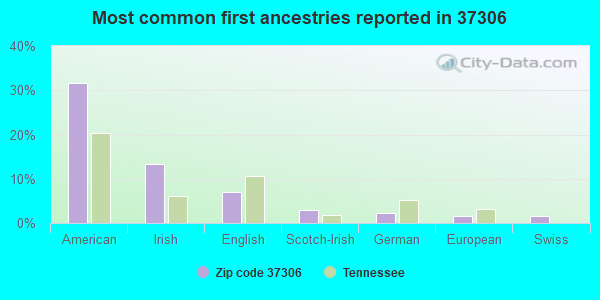
32%American
13%Irish
7%English
3%Scotch-Irish
2%German
2%European
2%Swiss
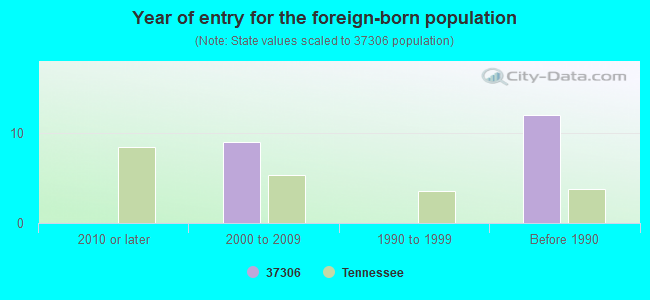
Year of entry for the foreign-born population
02010 or later
92000 to 2009
01990 to 1999
12Before 1990
Facilities with environmental interests located in this zip code:
FANDRICH FARM SUPPLY CO. (HWY 64 & COUNTY ROAD in BELVIDERE, TN)
AIR MINOR (AIRS/AFS) Business SIC classification: PREPARED FEEDS AND FEED INGREDIENTS FOR ANIMALS AND FOWLS, EXCEPT DOGS AND CATS
Housing units lacking complete plumbing facilities: 9.8% Housing units lacking complete kitchen facilities: 9.1%
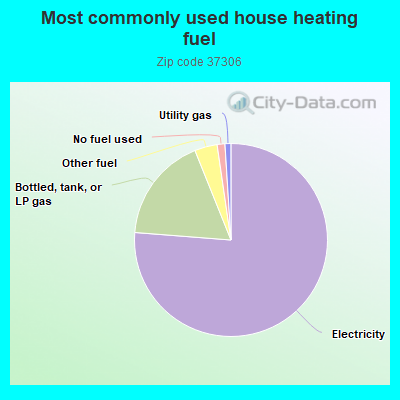
76.4%Electricity
17.7%Bottled, tank, or LP gas
3.8%Other fuel
1.3%No fuel used
1.0%Utility gas
Population in 1990: 4,670.
Place of birth for U.S.-born residents:
This state: 1,479
Northeast: 105
Midwest: 187
South: 277
West: 198
59% of the 37306 zip code residents lived in the same house 5 years ago. Out of people who lived in different houses, 80% lived in this county. Out of people who lived in different counties, 50% lived in Tennessee.
99% of the 37306 zip code residents lived in the same house 1 year ago. Out of people who lived in different houses, 33% moved from this county. Out of people who lived in different houses, 180% moved from abroad.
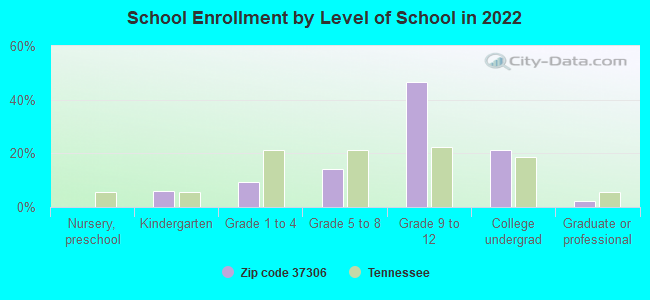
Private vs. public school enrollment:
Students in private schools in grades 1 to 8 (elementary and middle school): 39
Here:
36.1%
Tennessee:
15.0%
Students in private schools in grades 9 to 12 (high school): 26
Here:
12.8%
Tennessee:
16.2%
Students in private undergraduate colleges:
Here:
0.0%
Tennessee:
23.5%
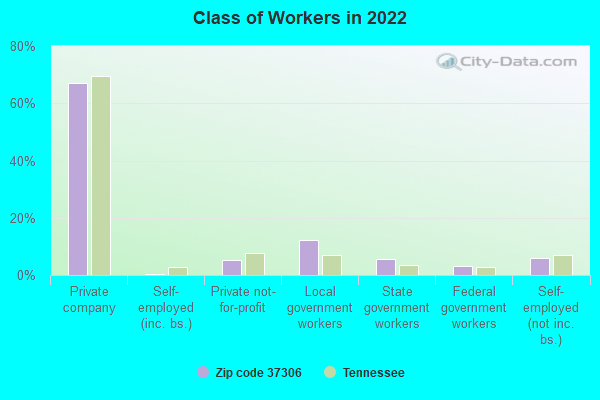
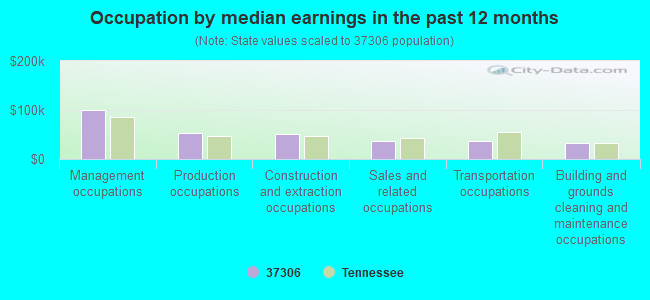
Occupation by median earnings in the past 12 months ($)
100,317Management occupations
53,254Production occupations
50,780Construction and extraction occupations
36,765Sales and related occupations
35,842Transportation occupations
32,135Building and grounds cleaning and maintenance occupations
Top industries in this zip code by the number of employees in 2005:
Health Care and Social Assistance: Child Day Care Services (20-49 employees: 1 establishment, 1-4 employees: 1 establishment)
Construction: New Single-Family Housing Construction (except Operative Builders) (1-4: 3)
Other Services (except Public Administration): Religious Organizations (1-4: 2)
People in group quarters in 2000:
4 people in other nonhousehold living situations
Fatal accident statistics in 2013:
Fatal accident count: 1
Vehicles involved in fatal accidents: 1
Fatal accidents caused by drunken drivers: 0
Fatalities: 1
Persons involved in fatal accidents: 2
Pedestrians involved in fatal accidents: 0
Fatal accident statistics in 2012:
Fatal accident count: 1
Vehicles involved in fatal accidents: 1
Fatal accidents caused by drunken drivers: 1
Fatalities: 1
Persons involved in fatal accidents: 4
Pedestrians involved in fatal accidents: 0
2002 - 2018 National Fire Incident Reporting System (NFIRS) incidents
Based on the data from the years 2002 - 2018 the average number of fire incidents per year is 21. The highest number of reported fire incidents - 36 took place in 2006, and the least - 4 in 2003. The data has an increasing trend.
When looking into fire subcategories, the most incidents belonged to: Structure Fires (48.1%), and Outside Fires (33.0%).
Fire incident types reported to NFIRS in Zip Code 37306

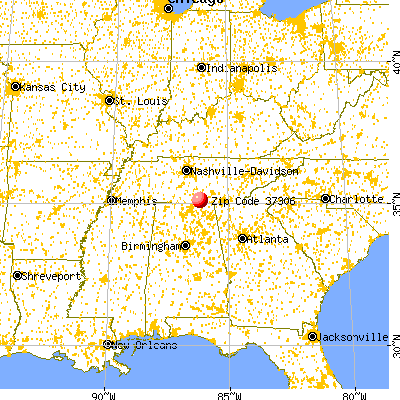


 Nearest zip codes: 37345, 37398, 35745, 37328, 37330, 37335.


 Based on the data from the years 2002 - 2018 the average number of fire incidents per year is 21. The highest number of reported fire incidents - 36 took place in 2006, and the least - 4 in 2003. The data has an increasing trend.
 When looking into fire subcategories, the most incidents belonged to: Structure Fires (48.1%), and Outside Fires (33.0%).