Estimated zip code population in 2022: 2,447 Zip code population in 2010: 2,486 Zip code population in 2000: 2,424
Houses and condos: 1,395 Renter-occupied apartments: 302
% of renters here:
30%
State:
33%
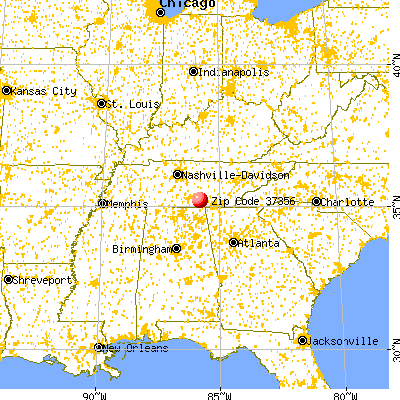
March 2022 cost of living index in zip code 37356: 81.1 (low, U.S. average is 100)
Land area: 24.2 sq. mi. Water area: 0.0 sq. mi.
Population density: 101 people per square mile
(very low).
OSM Map
General Map
Google Map
MSN Map
OSM Map
General Map
Google Map
MSN Map
OSM Map
General Map
Google Map
MSN Map
OSM Map
General Map
Google Map
MSN Map
Please wait while loading the map...
Real estate property taxes paid for housing units in 2022:
This zip code:
0.3% ($940)
Tennessee:
0.5% ($1,376)
Median real estate property taxes paid for housing units with mortgages in 2022: $834 (0.4%) Median real estate property taxes paid for housing units with no mortgage in 2022: $978 (0.3%)
Estimated median house/condo value in 2022: $315,845
37356:
$315,845
Tennessee:
$284,800
According to our research of Tennessee and other state lists, there were 5 registered sex offenders living in 37356 zip code as of May 29, 2024. The ratio of all residents to sex offenders in zip code 37356 is 549 to 1. The ratio of registered sex offenders to all residents in this zip code is lower than the state average.
Median resident age:
This zip code:
47.0 years
Tennessee median age:
39.2 years
Average household size:
This zip code:
2.3 people
Tennessee:
2.4 people
Averages for the 2020 tax year for zip code 37356, filed in 2021:
Average Adjusted Gross Income (AGI) in 2020: $61,917 (Individual Income Tax Returns)
Here:
$61,917
State:
$69,014
Salary/wage: $46,834 (reported on 77.2% of returns)
Here:
$46,834
State:
$55,872
(% of AGI for various income ranges: 1068.9% for AGIs below $25k, 3352.8% for AGIs $25k-50k, 6024.5% for AGIs $50k-75k, 8104.3% for AGIs $75k-100k, 12580.0% for AGIs $100k-200k)
Taxable interest for individuals: $1,845 (reported on 34.1% of returns)
This zip code:
$1,845
Tennessee:
$1,945
(% of AGI for various income ranges: 13.8% for AGIs below $25k, 22.4% for AGIs $25k-50k, 38.2% for AGIs $50k-75k, 117.1% for AGIs $75k-100k, 125.6% for AGIs $100k-200k)
Ordinary dividends: $10,043 (reported on 17.1% of returns)
Here:
$10,043
State:
$8,105
(% of AGI for various income ranges: 9.5% for AGIs below $25k, 50.8% for AGIs $25k-50k, 168.2% for AGIs $50k-75k, 248.6% for AGIs $75k-100k, 792.2% for AGIs $100k-200k)
Net capital gain/loss in AGI: +$24,765 (reported on 16.3% of returns)
Here:
+$24,765
State:
+$33,664
(% of AGI for various income ranges: 9.5% for AGIs below $25k, 41.6% for AGIs $25k-50k, 124.5% for AGIs $50k-75k, 232.9% for AGIs $75k-100k, 948.9% for AGIs $100k-200k)
Profit/loss from business: +$16,252 (reported on 20.3% of returns)
Here:
+$16,252
State:
+$18,991
(% of AGI for various income ranges: 197.8% for AGIs below $25k, 146.0% for AGIs $25k-50k, 220.9% for AGIs $50k-75k, 625.7% for AGIs $75k-100k, 2538.9% for AGIs $100k-200k)
Taxable individual retirement arrangement distribution: $23,900 (reported on 9.8% of returns)
37356:
$23,900
Tennessee:
$20,036
(% of AGI for various income ranges: 140.8% for AGIs $25k-50k, 562.7% for AGIs $50k-75k, 2107.8% for AGIs $100k-200k)
Total itemized deductions: $40,000 (reported on 3.3% of returns)
Here:
$40,000
State:
$40,136
(% of AGI for various income ranges: 1777.8% for AGIs $100k-200k)
Charity contributions: $13,767 (reported on 2.4% of returns)
Here:
$13,767
State:
$19,852
(% of AGI for various income ranges: 458.9% for AGIs $100k-200k)
Taxes paid: $5,600 (reported on 3.3% of returns)
37356:
$5,600
State:
$6,038
(% of AGI for various income ranges: 248.9% for AGIs $100k-200k)
Earned income credit: $2,157 (reported on 22.8% of returns)
Here:
$2,157
State:
$2,391
(% of AGI for various income ranges: 124.9% for AGIs below $25k, 56.8% for AGIs $25k-50k)
Percentage of individuals using paid preparers for their 2020 taxes: 93.5%
Here:
93%
State:
93%
(% for various income ranges: 91.7% for AGIs below $25k, 93.5% for AGIs $25k-50k, 93.3% for AGIs $50k-75k, 100.0% for AGIs $75k-100k, 92.9% for AGIs $100k-200k, 100.0% for AGIs over 200k)
Averages for the 2012 tax year for zip code 37356, filed in 2013:
Average Adjusted Gross Income (AGI) in 2012: $46,046 (Individual Income Tax Returns)
Here:
$46,046
State:
$53,767
Salary/wage: $34,299 (reported on 75.9% of returns)
Here:
$34,299
State:
$45,421
(% of AGI for various income ranges: 69.4% for AGIs below $25k, 75.3% for AGIs $25k-50k, 73.9% for AGIs $50k-75k, 55.9% for AGIs $75k-100k, 86.5% for AGIs $100k-200k)
Taxable interest for individuals: $1,297 (reported on 31.2% of returns)
This zip code:
$1,297
Tennessee:
$1,732
(% of AGI for various income ranges: 0.9% for AGIs below $25k, 0.7% for AGIs $25k-50k, 0.5% for AGIs $50k-75k, 0.7% for AGIs $75k-100k, 1.0% for AGIs $100k-200k, 1.2% for AGIs over 200k)
Ordinary dividends: $8,175 (reported on 14.3% of returns)
Here:
$8,175
State:
$6,739
(% of AGI for various income ranges: 2.0% for AGIs below $25k, 1.4% for AGIs $25k-50k, 2.9% for AGIs $50k-75k, 3.8% for AGIs $100k-200k, 3.7% for AGIs over 200k)
Net capital gain/loss in AGI: +$20,281 (reported on 14.3% of returns)
Here:
+$20,281
State:
+$19,082
(% of AGI for various income ranges: 0.5% for AGIs $25k-50k, 0.9% for AGIs $50k-75k, 5.8% for AGIs $100k-200k, 22.1% for AGIs over 200k)
Profit/loss from business: +$17,008 (reported on 23.2% of returns)
Here:
+$17,008
State:
+$15,240
(% of AGI for various income ranges: 15.7% for AGIs below $25k, 3.9% for AGIs $25k-50k, 5.3% for AGIs $50k-75k, 27.5% for AGIs $100k-200k)
Taxable individual retirement arrangement distribution: $26,073 (reported on 9.8% of returns)
37356:
$26,073
Tennessee:
$15,505
(% of AGI for various income ranges: 4.8% for AGIs below $25k, 8.9% for AGIs $50k-75k, 19.5% for AGIs $100k-200k)
Total itemized deductions: $24,945 (23% of AGI, reported on 17.9% of returns)
Here:
$24,945
State:
$21,976
Here:
22.5% of AGI
State:
17.8% of AGI
(% of AGI for various income ranges: 6.2% for AGIs below $25k, 5.1% for AGIs $25k-50k, 8.9% for AGIs $50k-75k, 11.2% for AGIs $75k-100k, 12.4% for AGIs $100k-200k, 12.9% for AGIs over 200k)
Charity contributions: $8,321 (reported on 12.5% of returns)
Here:
$8,321
State:
$6,709
(% of AGI for various income ranges: 1.8% for AGIs below $25k, 1.6% for AGIs $50k-75k, 3.0% for AGIs $75k-100k, 4.2% for AGIs $100k-200k, 2.8% for AGIs over 200k)
Taxes paid: $5,442 (reported on 17.0% of returns)
37356:
$5,442
State:
$4,829
(% of AGI for various income ranges: 0.8% for AGIs below $25k, 0.8% for AGIs $25k-50k, 1.4% for AGIs $50k-75k, 2.1% for AGIs $75k-100k, 2.5% for AGIs $100k-200k, 3.6% for AGIs over 200k)
Earned income credit: $2,068 (reported on 30.4% of returns)
Here:
$2,068
State:
$2,404
(% of AGI for various income ranges: 8.6% for AGIs below $25k, 1.3% for AGIs $25k-50k)
Percentage of individuals using paid preparers for their 2012 taxes: 67.9%
Here:
68%
State:
52%
(% for various income ranges: 67.9% for AGIs below $25k, 69.2% for AGIs $25k-50k, 61.5% for AGIs $50k-75k, 57.1% for AGIs $75k-100k, 71.4% for AGIs $100k-200k, 100.0% for AGIs over 200k)
Averages for the 2004 tax year for zip code 37356, filed in 2005:
Average Adjusted Gross Income (AGI) in 2004: $33,850 (Individual Income Tax Returns)
Here:
$33,850
State:
$44,088
Salary/wage: $29,274 (reported on 78.8% of returns)
Here:
$29,274
State:
$38,825
(% of AGI for various income ranges: 164.2% for AGIs below $10k, 69.3% for AGIs $10k-25k, 77.9% for AGIs $25k-50k, 77.9% for AGIs $50k-75k, 63.7% for AGIs $75k-100k, 43.4% for AGIs over 100k)
Taxable interest for individuals: $1,759 (reported on 34.9% of returns)
This zip code:
$1,759
Tennessee:
$1,802
(% of AGI for various income ranges: 7.9% for AGIs below $10k, 1.4% for AGIs $10k-25k, 1.0% for AGIs $25k-50k, 0.5% for AGIs $50k-75k, 3.2% for AGIs $75k-100k, 2.9% for AGIs over 100k)
Taxable dividends: $4,164 (reported on 15.2% of returns)
Here:
$4,164
State:
$3,727
(% of AGI for various income ranges: 6.5% for AGIs below $10k, 1.5% for AGIs $10k-25k, 0.9% for AGIs $25k-50k, 1.3% for AGIs $50k-75k, 1.0% for AGIs $75k-100k, 3.7% for AGIs over 100k)
Net capital gain/loss: +$12,854 (reported on 13.7% of returns)
Here:
+$12,854
State:
+$15,776
(% of AGI for various income ranges: -3.3% for AGIs below $10k, 1.1% for AGIs $10k-25k, 1.0% for AGIs $25k-50k, 1.9% for AGIs $50k-75k, 2.9% for AGIs $75k-100k, 16.8% for AGIs over 100k)
Profit/loss from business: +$9,138 (reported on 24.6% of returns)
Here:
+$9,138
State:
+$12,882
(% of AGI for various income ranges: 42.3% for AGIs below $10k, 14.7% for AGIs $10k-25k, 6.6% for AGIs $25k-50k, 4.7% for AGIs $50k-75k, 1.2% for AGIs $75k-100k, 4.1% for AGIs over 100k)
IRA payment deduction: $3,385 (reported on 2.6% of returns)
37356:
$3,385
Tennessee:
$2,934
Total itemized deductions: $17,059 (23% of AGI, reported on 17.0% of returns)
Here:
$17,059
State:
$18,035
Here:
23.3% of AGI
State:
19.9% of AGI
(% of AGI for various income ranges: 5.6% for AGIs $10k-25k, 8.4% for AGIs $25k-50k, 10.1% for AGIs $50k-75k, 10.1% for AGIs $75k-100k, 9.0% for AGIs over 100k)
Charity contributions deductions: $4,187 (5% of AGI, reported on 13.9% of returns)
Here:
$4,187
State:
$5,167
Here:
5.3% of AGI
State:
5.3% of AGI
(% of AGI for various income ranges: 4.8% for AGIs below $10k, 0.9% for AGIs $25k-50k, 1.6% for AGIs $50k-75k, 2.7% for AGIs $75k-100k, 2.9% for AGIs over 100k)
Total tax: $4,922 (reported on 72.2% of returns)
37356:
$4,922
State:
$7,482
(% of AGI for various income ranges: 9.8% for AGIs below $10k, 5.1% for AGIs $10k-25k, 7.1% for AGIs $25k-50k, 8.8% for AGIs $50k-75k, 11.7% for AGIs $75k-100k, 18.0% for AGIs over 100k)
Earned income credit: $1,763 (reported on 25.3% of returns)
Here:
$1,763
State:
$1,826
Percentage of individuals using paid preparers for their 2004 taxes: 72.5%
Here:
72%
State:
60%
(% for various income ranges: 70.7% for AGIs below $10k, 74.9% for AGIs $10k-25k, 74.1% for AGIs $25k-50k, 68.2% for AGIs $50k-75k, 62.7% for AGIs $75k-100k, 80.0% for AGIs over 100k)
Household received Food Stamps/SNAP in the past 12 months: 203 Household did not receive Food Stamps/SNAP in the past 12 months: 807
Women who had a birth in the past 12 months: 12 (12 now married, 0 unmarried) Women who did not have a birth in the past 12 months: 395 (156 now married, 238 unmarried)
Housing units in zip code 37356 with a mortgage: 370 (10 second mortgage, 10 both second mortgage and home equity loan) Houses without a mortgage: 4
Median monthly owner costs for units with a mortgage: $1,086 Median monthly owner costs for units without a mortgage: $498
Residents with income below the poverty level in 2022:
This zip code:
15.8%
Whole state:
13.3%
Residents with income below 50% of the poverty level in 2022:
This zip code:
8.8%
Whole state:
7.1%
Median number of rooms in houses and condos:
Here:
6.5
State:
6.5
Median number of rooms in apartments:
Here:
4.7
State:
4.4
Notable locations in this zip code not listed on our city pages
Streams, rivers, and creeks: Laurel Branch (A), Hurricane Creek (B), Falls Branch (C), Woodly Branch (D), Bridal Veil Creek (E), Wildcat Branch (F). Display/hide their locations on the map
In group quarters: 130 (-1 institutionalized population)
Size of family households: 349 2-persons, 125 3-persons, 92 4-persons, 38 5-persons, 1 6-persons
Size of nonfamily households: 213 1-person, 203 2-persons
264 married couples with children.
181 single-parent households (50 men, 131 women).
97.5% of residents of 37356 zip code speak English at home.
0.5% of residents speak Spanish at home (100% well).
1.7% of residents speak other Indo-European language at home (76% very well, 24% not well).
0.2% of residents speak other language at home (100% very well).
Foreign born population: 39 (1.6%) (44.4% of them are naturalized citizens)
This zip code:
1.6%
Whole state:
5.6%
79%Bhutan
13%El Salvador
36%English
21%Irish
17%American
5%German
5%Italian
2%Scotch-Irish
1%French Canadian
Year of entry for the foreign-born population
02010 or later
332000 to 2009
01990 to 1999
4Before 1990
Facilities with environmental interests located in this zip code:
EXXON MOBIL CORPORATION #50626 (I-24 & US 64 in MONTEAGLE, TN)
(Resource Conservation and Recovery Act (tracking hazardous waste)) Organizations: DAVID STURDEVANT (CONTACT/OPERATOR)
, EXXON USA (CONTACT/OWNER)
Alternative names: EXXON CO USA #50626
Housing units lacking complete plumbing facilities: 0.2% Housing units lacking complete kitchen facilities: 0.2%
55.2%Electricity
25.9%Utility gas
15.9%Bottled, tank, or LP gas
1.9%No fuel used
0.8%Other fuel
0.5%Wood
Population in 1990: 2,206. Population change in the 1990s: +218 (+9.9%).
Place of birth for U.S.-born residents:
This state: 1,679
Northeast: 160
Midwest: 226
South: 303
West: 20
58% of the 37356 zip code residents lived in the same house 5 years ago. Out of people who lived in different houses, 39% lived in this county. Out of people who lived in different counties, 50% lived in Tennessee.
93% of the 37356 zip code residents lived in the same house 1 year ago. Out of people who lived in different houses, 35% moved from this county. Out of people who lived in different houses, 35% moved from different county within same state. Out of people who lived in different houses, 34% moved from different state.
Private vs. public school enrollment:
Students in private schools in grades 1 to 8 (elementary and middle school):
Here:
0.0%
Tennessee:
15.0%
Students in private schools in grades 9 to 12 (high school): 23
Here:
17.4%
Tennessee:
16.2%
Students in private undergraduate colleges: 10
Here:
12.3%
Tennessee:
23.5%
Occupation by median earnings in the past 12 months ($)
82,335Health technologists and technicians
81,868Management occupations
71,149Production occupations
66,276Fire fighting and prevention, and other protective service workers including supervisors
50,942Education, training, and library occupations
30,317Transportation occupations
Companies with federal contracts located in this zip code:
SOUTHERN HEALTHCARE SYSTEMS IN (218 2ND ST NE in MONTEAGLE, TN) : $73,957 in 7 contractsfrom 2001 to 2002
Contracts for Nursing Home Care Contracts by Department of Veterans Affairs Signed by year:2000: $0; 2001: $42,000; 2002: $31,957; 2003: $0; 2004: $0; 2005: $0; 2006: $0.
Biggest contracts:
$17,000 with Department of Veterans Affairs for Nursing Home Care Contracts. Signed on 2001-10-15. Completion date: 2001-12-15.
$16,000, same as above.Signed on 2002-04-15. Completion date: 2002-06-15.
$15,000, same as above.Signed on 2002-07-15. Completion date: 2002-09-15.
$11,000, same as above.Signed on 2001-04-15. Completion date: 2001-06-15.
PILKINGTON COMPETITION EQUIPME (354 LITTLE TREES RAMBLE in MONTEAGLE, TN; small business)
$9,845 with Army for Guns, over 30 mm up to 75 mm. Signed on 2005-05-19. Completion date: 2005-06-27.
Top industries in this zip code by the number of employees in 2005:
Accommodation and Food Services: Hotels (except Casino Hotels) and Motels (50-99: 1, 10-19: 1, 5-9: 1)
Health Care and Social Assistance: Nursing Care Facilities (50-99: 1)
Accommodation and Food Services: Limited-Service Restaurants (20-49: 2)
Other Services (except Public Administration): Religious Organizations (10-19: 1, 1-4: 4)
People in group quarters in 2010:
126 people in nursing facilities/skilled-nursing facilities
10 people in group homes intended for adults
People in group quarters in 2000:
118 people in nursing homes
9 people in homes for the mentally ill
Fatal accident statistics in 2012:
Fatal accident count: 1
Vehicles involved in fatal accidents: 1
Fatal accidents caused by drunken drivers: 0
Fatalities: 1
Persons involved in fatal accidents: 1
Pedestrians involved in fatal accidents: 0
Fatal accident statistics in 2011:
Fatal accident count: 1
Vehicles involved in fatal accidents: 3
Fatal accidents caused by drunken drivers: 0
Fatalities: 2
Persons involved in fatal accidents: 6
Pedestrians involved in fatal accidents: 0
2004 - 2018 National Fire Incident Reporting System (NFIRS) incidents
Based on the data from the years 2004 - 2018 the average number of fire incidents per year is 30. The highest number of reported fire incidents - 61 took place in 2008, and the least - 3 in 2009. The data has a growing trend.
When looking into fire subcategories, the most incidents belonged to: Structure Fires (33.5%), and Mobile Property/Vehicle Fires (32.2%).
Fire incident types reported to NFIRS in Zip Code 37356


 Nearest zip codes: 37387, 37375, 37366, 37324, 37313, 37380.


 Based on the data from the years 2004 - 2018 the average number of fire incidents per year is 30. The highest number of reported fire incidents - 61 took place in 2008, and the least - 3 in 2009. The data has a growing trend.
 When looking into fire subcategories, the most incidents belonged to: Structure Fires (33.5%), and Mobile Property/Vehicle Fires (32.2%).