Estimated zip code population in 2022: 6,385 Zip code population in 2010: 6,289 Zip code population in 2000: 6,210
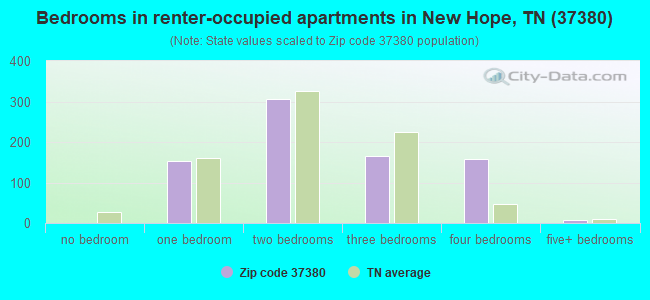
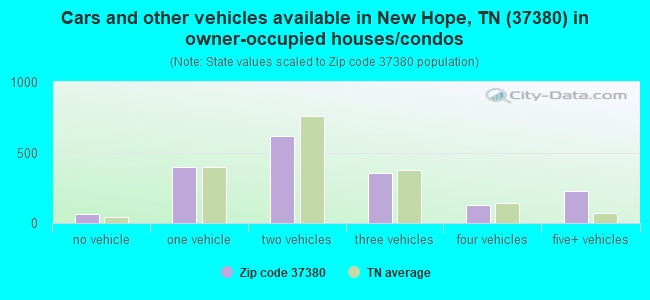
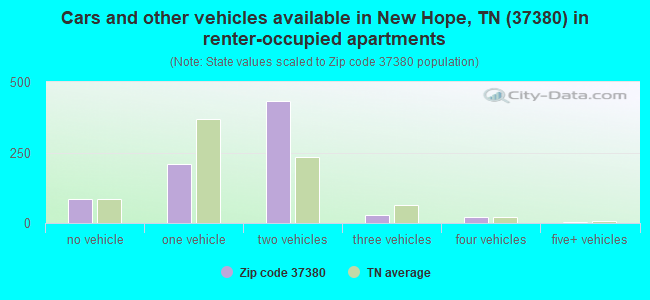
Houses and condos: 2,770 Renter-occupied apartments: 787
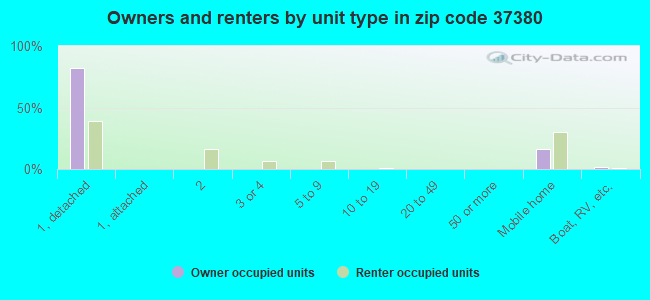
% of renters here:
31%
State:
33%
March 2022 cost of living index in zip code 37380: 79.8 (low, U.S. average is 100)
Land area: 130.9 sq. mi. Water area: 2.9 sq. mi.
Population density: 49 people per square mile
(very low).
OSM Map
General Map
Google Map
MSN Map
OSM Map
General Map
Google Map
MSN Map
OSM Map
General Map
Google Map
MSN Map
OSM Map
General Map
Google Map
MSN Map
Please wait while loading the map...
Real estate property taxes paid for housing units in 2022:
This zip code:
0.3% ($630)
Tennessee:
0.5% ($1,376)
Median real estate property taxes paid for housing units with mortgages in 2022: $795 (0.4%) Median real estate property taxes paid for housing units with no mortgage in 2022: $569 (0.3%)
Estimated median house/condo value in 2022: $195,225
37380:
$195,225
Tennessee:
$284,800
According to our research of Tennessee and other state lists, there were 16 registered sex offenders living in 37380 zip code as of May 28, 2024. The ratio of all residents to sex offenders in zip code 37380 is 419 to 1. The ratio of registered sex offenders to all residents in this zip code is lower than the state average.
Median resident age:
This zip code:
44.9 years
Tennessee median age:
39.2 years
Average household size:
This zip code:
2.4 people
Tennessee:
2.4 people
Averages for the 2020 tax year for zip code 37380, filed in 2021:
Average Adjusted Gross Income (AGI) in 2020: $53,724 (Individual Income Tax Returns)
Here:
$53,724
State:
$69,014
Salary/wage: $47,808 (reported on 82.1% of returns)
Here:
$47,808
State:
$55,872
(% of AGI for various income ranges: 1099.7% for AGIs below $25k, 3554.0% for AGIs $25k-50k, 6690.9% for AGIs $50k-75k, 9733.5% for AGIs $75k-100k, 16234.2% for AGIs $100k-200k, 67940.0% for AGIs over 200k)
Taxable interest for individuals: $943 (reported on 24.1% of returns)
This zip code:
$943
Tennessee:
$1,945
(% of AGI for various income ranges: 11.3% for AGIs below $25k, 12.9% for AGIs $25k-50k, 17.3% for AGIs $50k-75k, 55.9% for AGIs $75k-100k, 82.6% for AGIs $100k-200k, 910.0% for AGIs over 200k)
Ordinary dividends: $6,356 (reported on 9.3% of returns)
Here:
$6,356
State:
$8,105
(% of AGI for various income ranges: 12.5% for AGIs below $25k, 7.4% for AGIs $25k-50k, 81.2% for AGIs $50k-75k, 11.2% for AGIs $75k-100k, 167.4% for AGIs $100k-200k, 4830.0% for AGIs over 200k)
Net capital gain/loss in AGI: +$29,296 (reported on 8.6% of returns)
Here:
+$29,296
State:
+$33,664
(% of AGI for various income ranges: 1.0% for AGIs below $25k, 16.1% for AGIs $25k-50k, 74.5% for AGIs $50k-75k, 738.4% for AGIs $100k-200k, 27835.0% for AGIs over 200k)
Profit/loss from business: +$11,228 (reported on 13.8% of returns)
Here:
+$11,228
State:
+$18,991
(% of AGI for various income ranges: 168.7% for AGIs below $25k, 113.1% for AGIs $25k-50k, 162.1% for AGIs $50k-75k, 234.1% for AGIs $75k-100k, 802.1% for AGIs $100k-200k)
Taxable individual retirement arrangement distribution: $13,317 (reported on 6.2% of returns)
37380:
$13,317
Tennessee:
$20,036
(% of AGI for various income ranges: 35.9% for AGIs below $25k, 42.3% for AGIs $25k-50k, 133.6% for AGIs $50k-75k, 210.0% for AGIs $75k-100k, 554.2% for AGIs $100k-200k)
Total itemized deductions: $32,257 (reported on 2.4% of returns)
Here:
$32,257
State:
$40,136
(% of AGI for various income ranges: 110.0% for AGIs $25k-50k, 348.9% for AGIs $100k-200k, 4565.0% for AGIs over 200k)
Charity contributions: $12,450 (reported on 2.1% of returns)
Here:
$12,450
State:
$19,852
(% of AGI for various income ranges: 134.1% for AGIs $75k-100k, 2595.0% for AGIs over 200k)
Taxes paid: $5,817 (reported on 2.1% of returns)
37380:
$5,817
State:
$6,038
(% of AGI for various income ranges: 10.8% for AGIs $25k-50k, 60.0% for AGIs $100k-200k, 840.0% for AGIs over 200k)
Earned income credit: $2,327 (reported on 22.1% of returns)
Here:
$2,327
State:
$2,391
(% of AGI for various income ranges: 119.5% for AGIs below $25k, 87.9% for AGIs $25k-50k)
Percentage of individuals using paid preparers for their 2020 taxes: 93.8%
Here:
94%
State:
93%
(% for various income ranges: 94.3% for AGIs below $25k, 94.7% for AGIs $25k-50k, 93.5% for AGIs $50k-75k, 92.0% for AGIs $75k-100k, 93.5% for AGIs $100k-200k, 85.7% for AGIs over 200k)
Averages for the 2012 tax year for zip code 37380, filed in 2013:
Average Adjusted Gross Income (AGI) in 2012: $46,152 (Individual Income Tax Returns)
Here:
$46,152
State:
$53,767
Salary/wage: $39,570 (reported on 85.3% of returns)
Here:
$39,570
State:
$45,421
(% of AGI for various income ranges: 75.7% for AGIs below $25k, 85.5% for AGIs $25k-50k, 77.2% for AGIs $50k-75k, 78.9% for AGIs $75k-100k, 72.3% for AGIs $100k-200k, 47.6% for AGIs over 200k)
Taxable interest for individuals: $1,245 (reported on 24.4% of returns)
This zip code:
$1,245
Tennessee:
$1,732
(% of AGI for various income ranges: 0.8% for AGIs below $25k, 0.4% for AGIs $25k-50k, 0.8% for AGIs $50k-75k, 0.5% for AGIs $75k-100k, 1.0% for AGIs $100k-200k, 0.4% for AGIs over 200k)
Ordinary dividends: $3,891 (reported on 8.3% of returns)
Here:
$3,891
State:
$6,739
(% of AGI for various income ranges: 0.3% for AGIs below $25k, 0.3% for AGIs $25k-50k, 0.4% for AGIs $50k-75k, 0.4% for AGIs $75k-100k, 0.5% for AGIs $100k-200k, 2.2% for AGIs over 200k)
Net capital gain/loss in AGI: +$17,538 (reported on 7.9% of returns)
Here:
+$17,538
State:
+$19,082
(% of AGI for various income ranges: 1.2% for AGIs $75k-100k, 1.8% for AGIs $100k-200k, 15.3% for AGIs over 200k)
Profit/loss from business: +$12,968 (reported on 14.3% of returns)
Here:
+$12,968
State:
+$15,240
(% of AGI for various income ranges: 9.5% for AGIs below $25k, 2.0% for AGIs $25k-50k, 2.6% for AGIs $50k-75k, 3.1% for AGIs $75k-100k, 8.2% for AGIs $100k-200k)
Taxable individual retirement arrangement distribution: $11,584 (reported on 7.1% of returns)
37380:
$11,584
Tennessee:
$15,505
(% of AGI for various income ranges: 2.3% for AGIs below $25k, 1.8% for AGIs $25k-50k, 1.6% for AGIs $50k-75k, 2.2% for AGIs $75k-100k, 2.9% for AGIs $100k-200k)
Total itemized deductions: $19,946 (20% of AGI, reported on 17.3% of returns)
Here:
$19,946
State:
$21,976
Here:
20.0% of AGI
State:
17.8% of AGI
(% of AGI for various income ranges: 4.7% for AGIs below $25k, 6.3% for AGIs $25k-50k, 7.2% for AGIs $50k-75k, 10.2% for AGIs $75k-100k, 8.9% for AGIs $100k-200k, 7.5% for AGIs over 200k)
Charity contributions: $5,662 (reported on 12.0% of returns)
Here:
$5,662
State:
$6,709
(% of AGI for various income ranges: 0.4% for AGIs below $25k, 0.7% for AGIs $25k-50k, 1.0% for AGIs $50k-75k, 1.7% for AGIs $75k-100k, 1.9% for AGIs $100k-200k, 3.2% for AGIs over 200k)
Taxes paid: $3,893 (reported on 16.5% of returns)
37380:
$3,893
State:
$4,829
(% of AGI for various income ranges: 0.5% for AGIs below $25k, 0.9% for AGIs $25k-50k, 1.2% for AGIs $50k-75k, 1.9% for AGIs $75k-100k, 1.9% for AGIs $100k-200k, 1.8% for AGIs over 200k)
Earned income credit: $2,403 (reported on 26.3% of returns)
Here:
$2,403
State:
$2,404
(% of AGI for various income ranges: 9.4% for AGIs below $25k, 1.2% for AGIs $25k-50k)
Percentage of individuals using paid preparers for their 2012 taxes: 60.5%
Here:
61%
State:
52%
(% for various income ranges: 56.8% for AGIs below $25k, 58.6% for AGIs $25k-50k, 64.9% for AGIs $50k-75k, 68.4% for AGIs $75k-100k, 66.7% for AGIs $100k-200k, 100.0% for AGIs over 200k)
Averages for the 2004 tax year for zip code 37380, filed in 2005:
Average Adjusted Gross Income (AGI) in 2004: $36,862 (Individual Income Tax Returns)
Here:
$36,862
State:
$44,088
Salary/wage: $33,504 (reported on 87.9% of returns)
Here:
$33,504
State:
$38,825
(% of AGI for various income ranges: 128.0% for AGIs below $10k, 78.0% for AGIs $10k-25k, 86.5% for AGIs $25k-50k, 83.2% for AGIs $50k-75k, 85.8% for AGIs $75k-100k, 63.7% for AGIs over 100k)
Taxable interest for individuals: $1,281 (reported on 29.2% of returns)
This zip code:
$1,281
Tennessee:
$1,802
(% of AGI for various income ranges: 2.6% for AGIs below $10k, 2.0% for AGIs $10k-25k, 0.6% for AGIs $25k-50k, 1.1% for AGIs $50k-75k, 0.7% for AGIs $75k-100k, 0.9% for AGIs over 100k)
Taxable dividends: $3,134 (reported on 10.4% of returns)
Here:
$3,134
State:
$3,727
(% of AGI for various income ranges: 1.6% for AGIs below $10k, 0.2% for AGIs $10k-25k, 0.4% for AGIs $25k-50k, 1.0% for AGIs $50k-75k, 0.6% for AGIs $75k-100k, 1.8% for AGIs over 100k)
Net capital gain/loss: +$11,773 (reported on 9.2% of returns)
Here:
+$11,773
State:
+$15,776
(% of AGI for various income ranges: -0.6% for AGIs below $10k, -0.0% for AGIs $10k-25k, 0.2% for AGIs $25k-50k, 0.7% for AGIs $50k-75k, 0.2% for AGIs $75k-100k, 11.5% for AGIs over 100k)
Profit/loss from business: +$8,411 (reported on 13.7% of returns)
Here:
+$8,411
State:
+$12,882
(% of AGI for various income ranges: 20.0% for AGIs below $10k, 4.9% for AGIs $10k-25k, 1.7% for AGIs $25k-50k, 1.4% for AGIs $50k-75k, -0.3% for AGIs $75k-100k, 5.9% for AGIs over 100k)
IRA payment deduction: $2,720 (reported on 1.9% of returns)
37380:
$2,720
Tennessee:
$2,934
Total itemized deductions: $17,115 (23% of AGI, reported on 17.5% of returns)
Here:
$17,115
State:
$18,035
Here:
22.7% of AGI
State:
19.9% of AGI
(% of AGI for various income ranges: 6.5% for AGIs $10k-25k, 6.7% for AGIs $25k-50k, 9.0% for AGIs $50k-75k, 11.5% for AGIs $75k-100k, 8.8% for AGIs over 100k)
Charity contributions deductions: $3,862 (5% of AGI, reported on 13.8% of returns)
Here:
$3,862
State:
$5,167
Here:
4.7% of AGI
State:
5.3% of AGI
(% of AGI for various income ranges: 1.0% for AGIs $10k-25k, 0.8% for AGIs $25k-50k, 1.3% for AGIs $50k-75k, 2.0% for AGIs $75k-100k, 2.5% for AGIs over 100k)
Total tax: $5,417 (reported on 70.4% of returns)
37380:
$5,417
State:
$7,482
(% of AGI for various income ranges: 4.6% for AGIs below $10k, 3.9% for AGIs $10k-25k, 6.3% for AGIs $25k-50k, 8.7% for AGIs $50k-75k, 10.5% for AGIs $75k-100k, 20.6% for AGIs over 100k)
Earned income credit: $1,639 (reported on 23.7% of returns)
Here:
$1,639
State:
$1,826
Percentage of individuals using paid preparers for their 2004 taxes: 68.0%
Here:
68%
State:
60%
(% for various income ranges: 64.3% for AGIs below $10k, 69.5% for AGIs $10k-25k, 67.3% for AGIs $25k-50k, 67.1% for AGIs $50k-75k, 68.5% for AGIs $75k-100k, 83.3% for AGIs over 100k)
Household received Food Stamps/SNAP in the past 12 months: 607 Household did not receive Food Stamps/SNAP in the past 12 months: 1,945
Women who had a birth in the past 12 months: 186 (159 now married, 28 unmarried) Women who did not have a birth in the past 12 months: 1,241 (457 now married, 784 unmarried)
Housing units in zip code 37380 with a mortgage: 888 (131 second mortgage, 5 home equity loan, 96 both second mortgage and home equity loan) Houses without a mortgage: 6
Median monthly owner costs for units with a mortgage: $1,442 Median monthly owner costs for units without a mortgage: $357
Residents with income below the poverty level in 2022:
This zip code:
23.9%
Whole state:
13.3%
Residents with income below 50% of the poverty level in 2022:
This zip code:
13.0%
Whole state:
7.1%
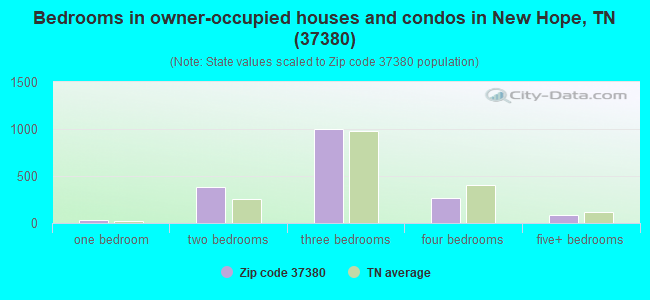
Median number of rooms in houses and condos:
Here:
6.1
State:
6.5
Median number of rooms in apartments:
Here:
4.9
State:
4.4
Notable locations in this zip code not listed on our city pages
Notable locations in zip code 37380: Mapleview Campsite (A), Richard City Industrial Park (B), Lodge (C), Moore Crossing (D), Sequatchie Valley Golf and Country Club (E), New Hope Volunteer Fire Department (F), Sweetens Cove Volunteer Fire Department (G), South Pittsburg City Hall (H), Beene-Pearson Memorial Library (I), Orme Volunteer Fire Department (J), South Pittsburg Mountain Volunteer Fire Department (K), Battle Creek Volunteer Fire Department (L), Irondale Volunteer Fire Department (M), South Pittsburg Volunteer Fire Department (N). Display/hide their locations on the map
Churches in zip code 37380 include: South Pittsburg First Baptist Church (A), Richard City First Baptist Church (B), Martin Springs Baptist Church (C), Wesley Methodist Church (D), South Pittsburg Primitive Baptist Church (E), South Pittsburg Cumberland Presbyterian Church (F), South Pittsburg Church of Christ (G), South Pittsburg Church of the Nazarene (H), Richard City Church of Christ (I). Display/hide their locations on the map
Cemeteries: Ladds Cemetery (1), Wynne Cemetery (2), Beene Cemetery (3), Bible Cemetery (4), Raulston Cemetery (5), Martin Cemetery (6), Thomas Cemetery (7). Display/hide their locations on the map
Streams, rivers, and creeks: Bethel Creek (A), Sweden Creek (B), Alley Gulf Branch (C), Beene Cove Branch (D), Denny Cove Branch (E), Gaines Cove Branch (F), Hargiss Cove Branch (G), Rogers Cove Branch (H), Roy Cove Branch (I). Display/hide their locations on the map
Parks in zip code 37380 include: Beene Stadium (1), Loyd Park (2), South Pittsburg Historic District (3), Maple View Public Use Area (4), South Pittsburg Municipal Park (5). Display/hide their locations on the map
In group quarters: 122 (-1 institutionalized population)
Size of family households: 876 2-persons, 451 3-persons, 133 4-persons, 148 5-persons, 197 6-persons, 4 7-or-more-persons
Size of nonfamily households: 499 1-person, 249 2-persons, 11 3-persons
517 married couples with children.
477 single-parent households (112 men, 365 women).
98.6% of residents of 37380 zip code speak English at home.
0.7% of residents speak Spanish at home (85% very well, 2% well, 12% not well).
0.3% of residents speak other Indo-European language at home (52% very well, 48% well).
0.1% of residents speak Asian or Pacific Island language at home (67% very well, 33% well).
Foreign born population: 96 (1.5%) (73.9% of them are naturalized citizens)
This zip code:
1.5%
Whole state:
5.6%
38%Afghanistan
23%Bhutan
23%Honduras
6%Taiwan
3%France
3%Laos
2%Malaysia
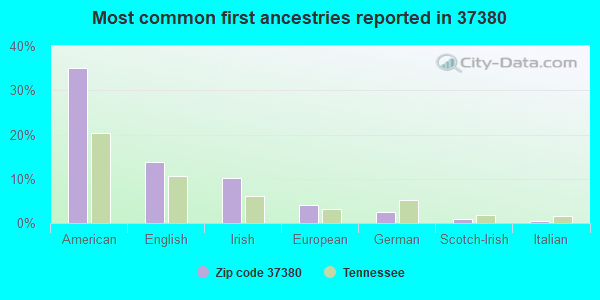
35%American
14%English
10%Irish
4%European
2%German
1%Scotch-Irish
0%Italian
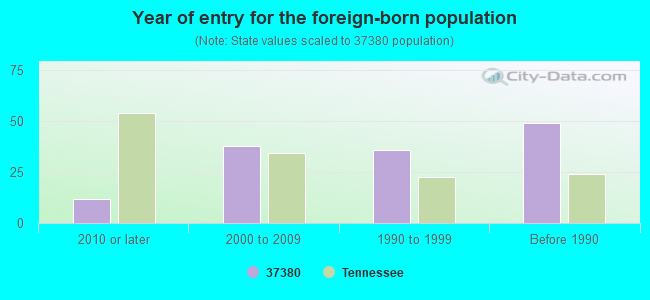
Year of entry for the foreign-born population
122010 or later
382000 to 2009
361990 to 1999
49Before 1990
Facilities with environmental interests located in this zip code:
AT&T (5 MI N OF SOUTH PITTSBURG in SOUTH PITTSBURG, TN)
(Resource Conservation and Recovery Act (tracking hazardous waste))
BROWN J I TREE EXPERT CO INC (PO BOX 376 in SOUTH PITTSBURG, TN)
(Resource Conservation and Recovery Act (tracking hazardous waste))
CITY OF SOUTH PITTSBURG (GENERAL DELIVERY in SOUTH PITTSBURG, TN)
AIR MINOR (AIRS/AFS) Business SIC classification: CEMENT, HYDRAULIC
Housing units lacking complete plumbing facilities: 3.1% Housing units lacking complete kitchen facilities: 2.7%
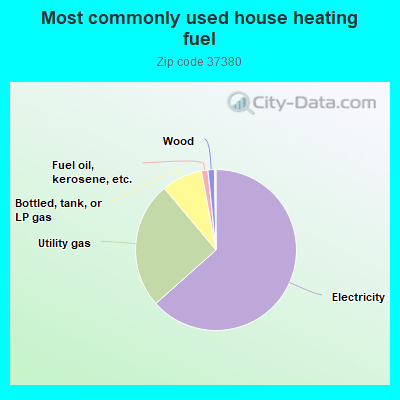
63.5%Electricity
25.5%Utility gas
8.2%Bottled, tank, or LP gas
1.3%Fuel oil, kerosene, etc.
1.3%Wood
Population in 1990: 6,151. Population change in the 1990s: +59 (+1.0%).
Place of birth for U.S.-born residents:
This state: 4,345
Northeast: 309
Midwest: 283
South: 1,205
West: 56
61% of the 37380 zip code residents lived in the same house 5 years ago. Out of people who lived in different houses, 68% lived in this county. Out of people who lived in different counties, 50% lived in Tennessee.
84% of the 37380 zip code residents lived in the same house 1 year ago. Out of people who lived in different houses, 26% moved from this county. Out of people who lived in different houses, 61% moved from different county within same state. Out of people who lived in different houses, 12% moved from different state. Out of people who lived in different houses, 1% moved from abroad.
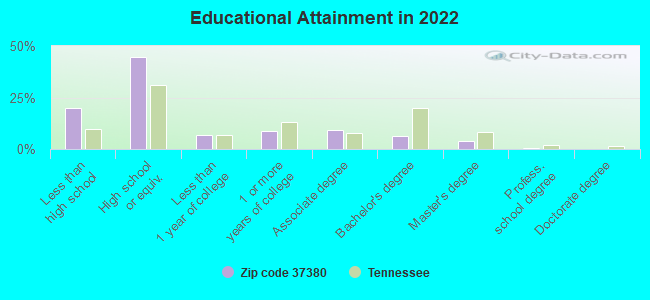
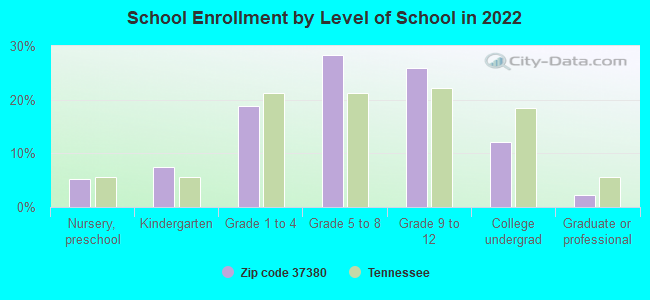
Private vs. public school enrollment:
Students in private schools in grades 1 to 8 (elementary and middle school): 40
Here:
8.1%
Tennessee:
15.0%
Students in private schools in grades 9 to 12 (high school):
Here:
0.0%
Tennessee:
16.2%
Students in private undergraduate colleges: 28
Here:
21.9%
Tennessee:
23.5%
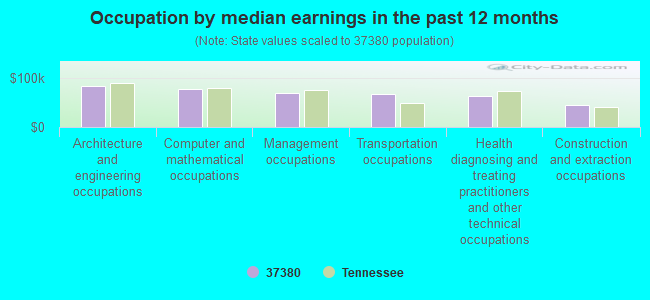
Occupation by median earnings in the past 12 months ($)
84,633Architecture and engineering occupations
77,831Computer and mathematical occupations
68,773Management occupations
67,123Transportation occupations
63,019Health diagnosing and treating practitioners and other technical occupations
45,543Construction and extraction occupations
Top industries in this zip code by the number of employees in 2005:
Health Care and Social Assistance: Nursing Care Facilities (100-249 employees: 1 establishment)
Administrative and Support and Waste Management and Remediation Services: Temporary Help Services (100-249: 1)
Accommodation and Food Services: Limited-Service Restaurants (50-99: 1, 20-49: 2)
Finance and Insurance: Commercial Banking (10-19: 1, 5-9: 3)
Management of Companies and Enterprises: Corporate, Subsidiary, and Regional Managing Offices (20-49: 1, 1-4: 1)
People in group quarters in 2010:
133 people in nursing facilities/skilled-nursing facilities
9 people in group homes intended for adults
2 people in other noninstitutional facilities
People in group quarters in 2000:
150 people in nursing homes
9 people in other noninstitutional group quarters
Fatal accident statistics in 2014:
Fatal accident count: 1
Vehicles involved in fatal accidents: 2
Fatal accidents caused by drunken drivers: 0
Fatalities: 1
Persons involved in fatal accidents: 3
Pedestrians involved in fatal accidents: 0
Fatal accident statistics in 2013:
Fatal accident count: 1
Vehicles involved in fatal accidents: 1
Fatal accidents caused by drunken drivers: 1
Fatalities: 2
Persons involved in fatal accidents: 3
Pedestrians involved in fatal accidents: 0
2002 - 2018 National Fire Incident Reporting System (NFIRS) incidents
According to the data from the years 2002 - 2018 the average number of fire incidents per year is 32. The highest number of fires - 65 took place in 2007, and the least - 4 in 2004. The data has a rising trend.
When looking into fire subcategories, the most reports belonged to: Structure Fires (28.4%), and Outside Fires (27.4%).
Fire incident types reported to NFIRS in Zip Code 37380

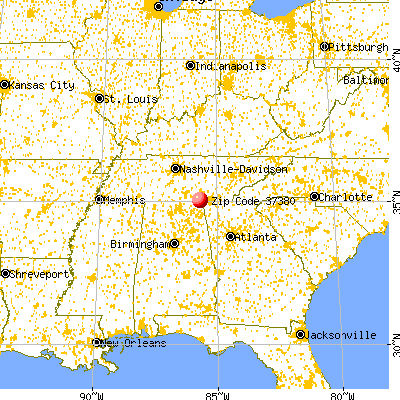


 Nearest zip codes: 35740, 37347, 37374, 37375, 37356, 35958.
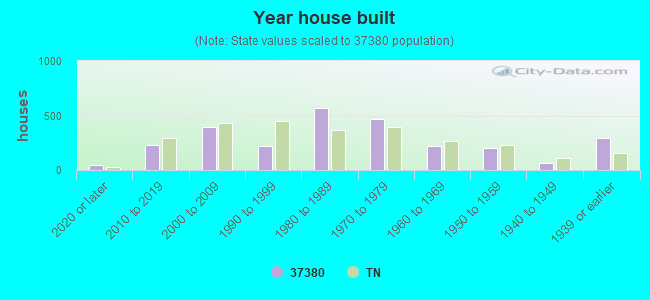


 According to the data from the years 2002 - 2018 the average number of fire incidents per year is 32. The highest number of fires - 65 took place in 2007, and the least - 4 in 2004. The data has a rising trend.
 When looking into fire subcategories, the most reports belonged to: Structure Fires (28.4%), and Outside Fires (27.4%).