Estimated zip code population in 2022: 13,938 Zip code population in 2010: 13,021 Zip code population in 2000: 12,474
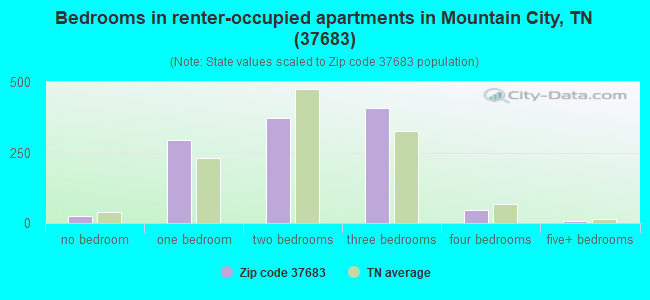
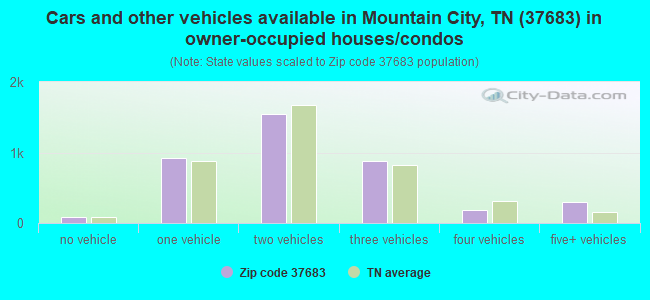
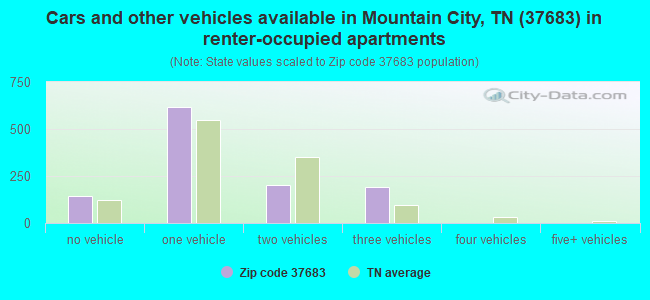
Houses and condos: 6,135 Renter-occupied apartments: 1,158
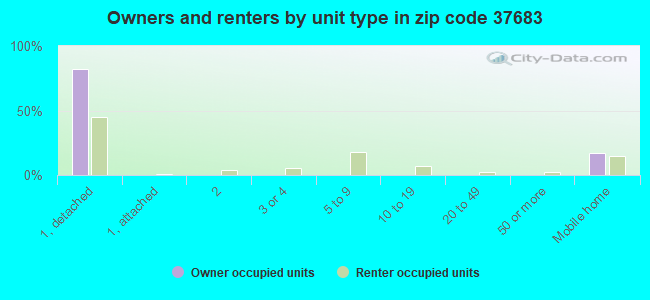
% of renters here:
23%
State:
33%
March 2022 cost of living index in zip code 37683: 79.0 (low, U.S. average is 100)
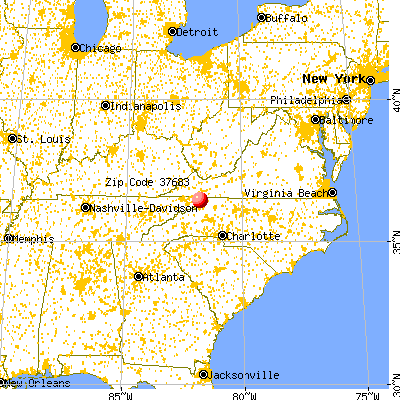
Land area: 135.9 sq. mi. Water area: 0.0 sq. mi.
Population density: 103 people per square mile
(very low).
OSM Map
General Map
Google Map
MSN Map
OSM Map
General Map
Google Map
MSN Map
OSM Map
General Map
Google Map
MSN Map
OSM Map
General Map
Google Map
MSN Map
Please wait while loading the map...
Real estate property taxes paid for housing units in 2022:
This zip code:
0.4% ($665)
Tennessee:
0.5% ($1,376)
Median real estate property taxes paid for housing units with mortgages in 2022: $643 (0.3%) Median real estate property taxes paid for housing units with no mortgage in 2022: $679 (0.4%)
Averages for the 2020 tax year for zip code 37683, filed in 2021:
Average Adjusted Gross Income (AGI) in 2020: $44,986 (Individual Income Tax Returns)
Here:
$44,986
State:
$69,014
Salary/wage: $39,181 (reported on 77.3% of returns)
Here:
$39,181
State:
$55,872
(% of AGI for various income ranges: 1039.1% for AGIs below $25k, 3262.2% for AGIs $25k-50k, 5986.1% for AGIs $50k-75k, 8567.1% for AGIs $75k-100k, 13095.0% for AGIs $100k-200k)
Taxable interest for individuals: $990 (reported on 30.8% of returns)
This zip code:
$990
Tennessee:
$1,945
(% of AGI for various income ranges: 16.4% for AGIs below $25k, 17.5% for AGIs $25k-50k, 35.7% for AGIs $50k-75k, 99.6% for AGIs $75k-100k, 163.2% for AGIs $100k-200k)
Ordinary dividends: $4,566 (reported on 10.1% of returns)
Here:
$4,566
State:
$8,105
(% of AGI for various income ranges: 12.4% for AGIs below $25k, 16.1% for AGIs $25k-50k, 49.6% for AGIs $50k-75k, 134.6% for AGIs $75k-100k, 315.9% for AGIs $100k-200k)
Net capital gain/loss in AGI: +$11,953 (reported on 10.5% of returns)
Here:
+$11,953
State:
+$33,664
(% of AGI for various income ranges: 14.6% for AGIs below $25k, 17.3% for AGIs $25k-50k, 81.4% for AGIs $50k-75k, 302.9% for AGIs $75k-100k, 1020.5% for AGIs $100k-200k)
Profit/loss from business: +$12,309 (reported on 15.8% of returns)
Here:
+$12,309
State:
+$18,991
(% of AGI for various income ranges: 166.8% for AGIs below $25k, 158.1% for AGIs $25k-50k, 213.5% for AGIs $50k-75k, 258.3% for AGIs $75k-100k, 873.2% for AGIs $100k-200k)
Taxable individual retirement arrangement distribution: $19,593 (reported on 8.8% of returns)
37683:
$19,593
Tennessee:
$20,036
(% of AGI for various income ranges: 53.0% for AGIs below $25k, 78.9% for AGIs $25k-50k, 232.7% for AGIs $50k-75k, 515.0% for AGIs $75k-100k, 1826.4% for AGIs $100k-200k)
Total itemized deductions: $36,173 (reported on 2.4% of returns)
Here:
$36,173
State:
$40,136
(% of AGI for various income ranges: 279.8% for AGIs $50k-75k, 565.5% for AGIs $100k-200k)
Charity contributions: $21,250 (reported on 1.7% of returns)
Here:
$21,250
State:
$19,852
(% of AGI for various income ranges: 42.0% for AGIs $50k-75k, 273.6% for AGIs $100k-200k)
Taxes paid: $5,340 (reported on 2.1% of returns)
37683:
$5,340
State:
$6,038
(% of AGI for various income ranges: 28.0% for AGIs $50k-75k, 90.0% for AGIs $100k-200k)
Earned income credit: $2,399 (reported on 23.1% of returns)
Here:
$2,399
State:
$2,391
(% of AGI for various income ranges: 114.6% for AGIs below $25k, 86.3% for AGIs $25k-50k)
Percentage of individuals using paid preparers for their 2020 taxes: 92.5%
Here:
93%
State:
93%
(% for various income ranges: 89.9% for AGIs below $25k, 95.6% for AGIs $25k-50k, 93.8% for AGIs $50k-75k, 94.3% for AGIs $75k-100k, 91.9% for AGIs $100k-200k, 85.7% for AGIs over 200k)
Averages for the 2012 tax year for zip code 37683, filed in 2013:
Average Adjusted Gross Income (AGI) in 2012: $36,740 (Individual Income Tax Returns)
Here:
$36,740
State:
$53,767
Salary/wage: $32,005 (reported on 81.2% of returns)
Here:
$32,005
State:
$45,421
(% of AGI for various income ranges: 73.1% for AGIs below $25k, 79.9% for AGIs $25k-50k, 78.1% for AGIs $50k-75k, 71.6% for AGIs $75k-100k, 64.9% for AGIs $100k-200k, 33.9% for AGIs over 200k)
Taxable interest for individuals: $1,332 (reported on 31.2% of returns)
This zip code:
$1,332
Tennessee:
$1,732
(% of AGI for various income ranges: 1.4% for AGIs below $25k, 0.7% for AGIs $25k-50k, 0.9% for AGIs $50k-75k, 0.5% for AGIs $75k-100k, 0.9% for AGIs $100k-200k, 3.6% for AGIs over 200k)
Ordinary dividends: $2,717 (reported on 11.1% of returns)
Here:
$2,717
State:
$6,739
(% of AGI for various income ranges: 0.7% for AGIs below $25k, 0.8% for AGIs $25k-50k, 0.8% for AGIs $50k-75k, 0.4% for AGIs $75k-100k, 1.0% for AGIs $100k-200k, 1.2% for AGIs over 200k)
Net capital gain/loss in AGI: +$4,477 (reported on 9.4% of returns)
Here:
+$4,477
State:
+$19,082
(% of AGI for various income ranges: 0.4% for AGIs below $25k, 0.6% for AGIs $25k-50k, 0.3% for AGIs $50k-75k, 0.6% for AGIs $75k-100k, 0.4% for AGIs $100k-200k, 7.5% for AGIs over 200k)
Profit/loss from business: +$8,829 (reported on 17.5% of returns)
Here:
+$8,829
State:
+$15,240
(% of AGI for various income ranges: 8.9% for AGIs below $25k, 3.0% for AGIs $25k-50k, 2.0% for AGIs $50k-75k, 2.3% for AGIs $75k-100k, 8.5% for AGIs $100k-200k)
Taxable individual retirement arrangement distribution: $13,555 (reported on 10.1% of returns)
37683:
$13,555
Tennessee:
$15,505
(% of AGI for various income ranges: 3.3% for AGIs below $25k, 2.3% for AGIs $25k-50k, 2.6% for AGIs $50k-75k, 4.7% for AGIs $75k-100k, 10.2% for AGIs $100k-200k)
Total itemized deductions: $19,513 (27% of AGI, reported on 15.1% of returns)
Here:
$19,513
State:
$21,976
Here:
26.9% of AGI
State:
17.8% of AGI
(% of AGI for various income ranges: 4.7% for AGIs below $25k, 6.6% for AGIs $25k-50k, 8.9% for AGIs $50k-75k, 11.2% for AGIs $75k-100k, 10.8% for AGIs $100k-200k, 8.5% for AGIs over 200k)
Charity contributions: $5,145 (reported on 12.3% of returns)
Here:
$5,145
State:
$6,709
(% of AGI for various income ranges: 0.5% for AGIs below $25k, 1.2% for AGIs $25k-50k, 1.8% for AGIs $50k-75k, 2.4% for AGIs $75k-100k, 2.6% for AGIs $100k-200k, 3.1% for AGIs over 200k)
Taxes paid: $3,760 (reported on 15.1% of returns)
37683:
$3,760
State:
$4,829
(% of AGI for various income ranges: 0.6% for AGIs below $25k, 1.1% for AGIs $25k-50k, 1.5% for AGIs $50k-75k, 2.2% for AGIs $75k-100k, 2.6% for AGIs $100k-200k, 2.2% for AGIs over 200k)
Earned income credit: $2,290 (reported on 28.8% of returns)
Here:
$2,290
State:
$2,404
(% of AGI for various income ranges: 8.0% for AGIs below $25k, 1.5% for AGIs $25k-50k)
Percentage of individuals using paid preparers for their 2012 taxes: 71.9%
Here:
72%
State:
52%
(% for various income ranges: 72.1% for AGIs below $25k, 73.3% for AGIs $25k-50k, 71.4% for AGIs $50k-75k, 68.2% for AGIs $75k-100k, 64.7% for AGIs $100k-200k, 75.0% for AGIs over 200k)
Averages for the 2004 tax year for zip code 37683, filed in 2005:
Average Adjusted Gross Income (AGI) in 2004: $29,729 (Individual Income Tax Returns)
Here:
$29,729
State:
$44,088
Salary/wage: $27,494 (reported on 83.4% of returns)
Here:
$27,494
State:
$38,825
(% of AGI for various income ranges: 170.6% for AGIs below $10k, 77.4% for AGIs $10k-25k, 84.2% for AGIs $25k-50k, 79.1% for AGIs $50k-75k, 73.9% for AGIs $75k-100k, 46.6% for AGIs over 100k)
Taxable interest for individuals: $1,561 (reported on 39.9% of returns)
This zip code:
$1,561
Tennessee:
$1,802
(% of AGI for various income ranges: 15.5% for AGIs below $10k, 2.0% for AGIs $10k-25k, 1.1% for AGIs $25k-50k, 1.6% for AGIs $50k-75k, 1.2% for AGIs $75k-100k, 3.4% for AGIs over 100k)
Taxable dividends: $2,073 (reported on 11.8% of returns)
Here:
$2,073
State:
$3,727
(% of AGI for various income ranges: 2.8% for AGIs below $10k, 0.5% for AGIs $10k-25k, 0.3% for AGIs $25k-50k, 0.7% for AGIs $50k-75k, 0.7% for AGIs $75k-100k, 2.3% for AGIs over 100k)
Net capital gain/loss: +$9,965 (reported on 9.3% of returns)
Here:
+$9,965
State:
+$15,776
(% of AGI for various income ranges: -1.3% for AGIs below $10k, 0.4% for AGIs $10k-25k, 1.0% for AGIs $25k-50k, 1.3% for AGIs $50k-75k, 1.6% for AGIs $75k-100k, 15.2% for AGIs over 100k)
Profit/loss from business: +$7,744 (reported on 18.4% of returns)
Here:
+$7,744
State:
+$12,882
(% of AGI for various income ranges: 15.2% for AGIs below $10k, 8.1% for AGIs $10k-25k, 3.0% for AGIs $25k-50k, 1.9% for AGIs $50k-75k, 1.9% for AGIs $75k-100k, 8.5% for AGIs over 100k)
IRA payment deduction: $2,986 (reported on 3.5% of returns)
37683:
$2,986
Tennessee:
$2,934
(% of AGI for various income ranges: 1.1% for AGIs below $10k, 0.3% for AGIs $10k-25k, 0.3% for AGIs $25k-50k, 0.4% for AGIs $50k-75k, 0.3% for AGIs $75k-100k, 0.3% for AGIs over 100k)
Total itemized deductions: $16,111 (24% of AGI, reported on 14.2% of returns)
Here:
$16,111
State:
$18,035
Here:
24.1% of AGI
State:
19.9% of AGI
(% of AGI for various income ranges: 9.5% for AGIs below $10k, 4.8% for AGIs $10k-25k, 6.4% for AGIs $25k-50k, 9.2% for AGIs $50k-75k, 11.4% for AGIs $75k-100k, 9.2% for AGIs over 100k)
Charity contributions deductions: $4,166 (6% of AGI, reported on 11.8% of returns)
Here:
$4,166
State:
$5,167
Here:
5.9% of AGI
State:
5.3% of AGI
(% of AGI for various income ranges: 0.5% for AGIs below $10k, 0.8% for AGIs $10k-25k, 1.0% for AGIs $25k-50k, 2.0% for AGIs $50k-75k, 3.4% for AGIs $75k-100k, 2.8% for AGIs over 100k)
Total tax: $3,914 (reported on 69.2% of returns)
37683:
$3,914
State:
$7,482
(% of AGI for various income ranges: 7.8% for AGIs below $10k, 4.0% for AGIs $10k-25k, 6.1% for AGIs $25k-50k, 8.9% for AGIs $50k-75k, 11.0% for AGIs $75k-100k, 21.1% for AGIs over 100k)
Earned income credit: $1,732 (reported on 26.3% of returns)
Here:
$1,732
State:
$1,826
Percentage of individuals using paid preparers for their 2004 taxes: 71.0%
Here:
71%
State:
60%
(% for various income ranges: 66.0% for AGIs below $10k, 73.6% for AGIs $10k-25k, 72.3% for AGIs $25k-50k, 71.8% for AGIs $50k-75k, 66.4% for AGIs $75k-100k, 75.0% for AGIs over 100k)
Household received Food Stamps/SNAP in the past 12 months: 925 Household did not receive Food Stamps/SNAP in the past 12 months: 4,126
Women who had a birth in the past 12 months: 182 (37 now married, 139 unmarried) Women who did not have a birth in the past 12 months: 2,124 (1,033 now married, 1,091 unmarried)
Housing units in zip code 37683 with a mortgage: 1,580 Houses without a mortgage: 47
Median monthly owner costs for units with a mortgage: $947 Median monthly owner costs for units without a mortgage: $329
Residents with income below the poverty level in 2022:
This zip code:
22.8%
Whole state:
13.3%
Residents with income below 50% of the poverty level in 2022:
This zip code:
11.8%
Whole state:
7.1%
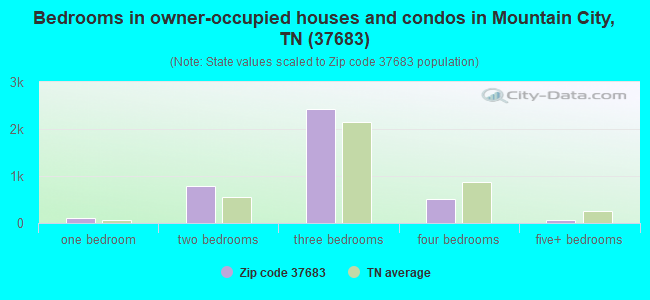
Median number of rooms in houses and condos:
Here:
5.9
State:
6.5
Median number of rooms in apartments:
Here:
4.5
State:
4.4
Notable locations in this zip code not listed on our city pages
Notable locations in zip code 37683: Bakers Gap (A), Mountain City Fire Department (B), Neva Volunteer Fire Department (C), Second District Volunteer Fire Department (D), Doe Valley Volunteer Fire Department (E), Johnson County Rescue Squad and EMS (F). Display/hide their locations on the map
Churches in zip code 37683 include: Damascus Church (A), Walnut Grove Baptist Church (B), Mountain City First Baptist Church (C), Bethel Church (D), Laurel Springs Church (E), Hammon Chapel (F), Valley View Church (G), Woods Hill Church (H), Berea Church (I). Display/hide their locations on the map
Cemeteries: Baker Cemetery (1), Greer Cemetery (2), McEwen Cemetery (3), Brown Cemetery (4), Phillips Cemetery (5), Cornett Cemetery (6), Wilson Cemetery (7). Display/hide their locations on the map
Streams, rivers, and creeks: Mack Branch (A), Avery Branch (B), Bee Cove Branch (C), McEwen Branch (D), Patrick Branch (E), Shaw Branch (F), Shingletown Branch (G), Slimp Branch (H), Smith Branch (I). Display/hide their locations on the map
935 married couples with children.
568 single-parent households (121 men, 447 women).
95.7% of residents of 37683 zip code speak English at home.
3.4% of residents speak Spanish at home (52% very well, 27% well, 20% not well).
0.5% of residents speak other Indo-European language at home (100% very well).
0.5% of residents speak Asian or Pacific Island language at home (57% very well, 43% well).
Foreign born population: 291 (2.1%) (24.9% of them are naturalized citizens)
This zip code:
2.1%
Whole state:
5.6%
57%El Salvador
26%United Kingdom, excluding England and Scotland
22%Sweden
11%Malaysia
5%Japan
2%North Macedonia (Macedonia)
1%Croatia
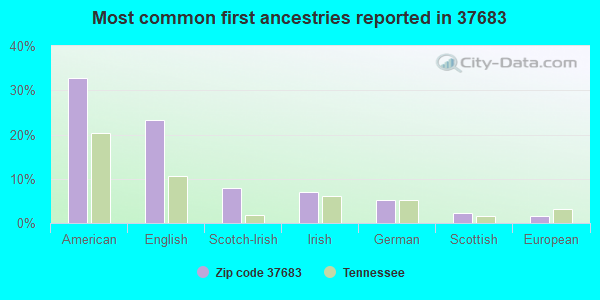
33%American
23%English
8%Scotch-Irish
7%Irish
5%German
2%Scottish
2%European
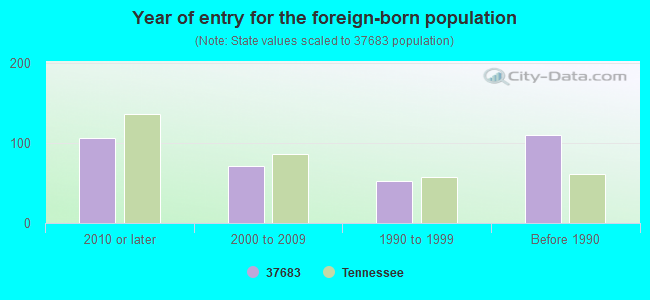
Year of entry for the foreign-born population
1062010 or later
712000 to 2009
531990 to 1999
110Before 1990
Facilities with environmental interests located in this zip code:
DOE ELEMENTARY SCHOOL (7164 HIGHWAY 67 WEST in MOUNTAIN CITY, TN)
(Geographic Names Information System) (National Center for Education Statistics) - STATE ID-0005 Organizations: JOHNSON COUNTY SCHOOL DISTRICT (SCHOOL DISTRICT)
CITY CLEANERS (122 E MAIN ST in MOUNTAIN CITY, TN)
(Resource Conservation and Recovery Act (tracking hazardous waste)) Business NAICS classification: ALL OTHER BUSINESS SUPPORT SERVICES.
AMERICAN WICKER AND WOOD (RT. 3 HIGHWAY 67 MOUNTAIN CITY in MOUNTAIN CITY, TN)
(Resource Conservation and Recovery Act (tracking hazardous waste))
BURLINGTON BOX (120 MTN CTY in MOUNTAIN CITY, TN)
CRITERIA AND HAZARDOUS AIR POLLUTANT INVENTORY (Inventory of air pollution sources) Business SIC classification: CELLULOSIC MANMADE FIBERS Business NAICS classification: CELLULOSIC ORGANIC FIBER MANUFACTURING. Alternative names: BURLINGTON BOX 120 MTN CTY JOHNSON 37683
Housing units lacking complete plumbing facilities: 2.7% Housing units lacking complete kitchen facilities: 3.3%
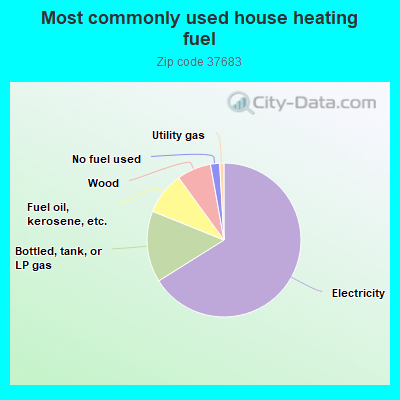
66.1%Electricity
15.0%Bottled, tank, or LP gas
8.9%Fuel oil, kerosene, etc.
7.2%Wood
1.9%No fuel used
0.9%Utility gas
Population in 1990: 9,205. Population change in the 1990s: +3,269 (+35.5%).
Place of birth for U.S.-born residents:
This state: 6,438
Northeast: 1,040
Midwest: 539
South: 5,056
West: 587
61% of the 37683 zip code residents lived in the same house 5 years ago. Out of people who lived in different houses, 57% lived in this county. Out of people who lived in different counties, 50% lived in Tennessee.
90% of the 37683 zip code residents lived in the same house 1 year ago. Out of people who lived in different houses, 31% moved from this county. Out of people who lived in different houses, 41% moved from different county within same state. Out of people who lived in different houses, 29% moved from different state. Out of people who lived in different houses, 3% moved from abroad.
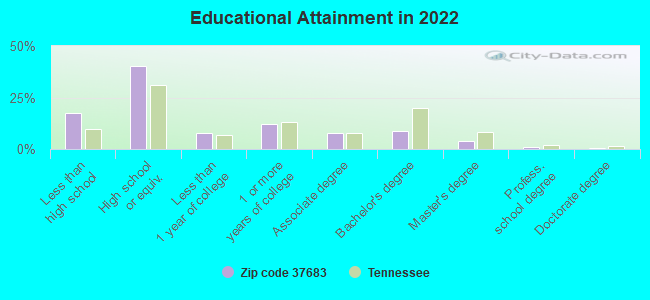
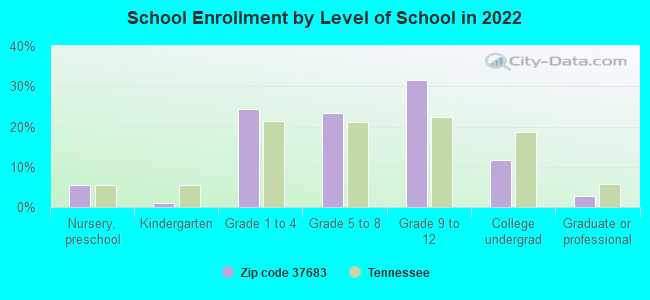
Private vs. public school enrollment:
Students in private schools in grades 1 to 8 (elementary and middle school): 105
Here:
9.5%
Tennessee:
15.0%
Students in private schools in grades 9 to 12 (high school): 248
Here:
33.6%
Tennessee:
16.2%
Students in private undergraduate colleges: 78
Here:
29.0%
Tennessee:
23.5%
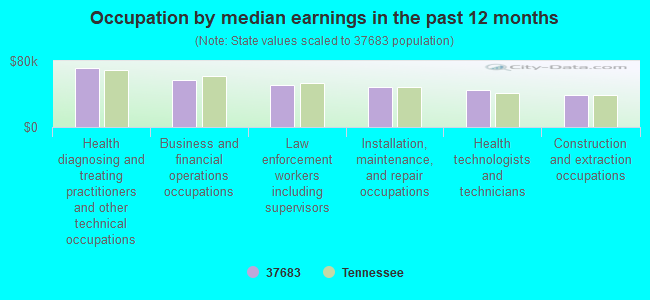
Occupation by median earnings in the past 12 months ($)
71,076Health diagnosing and treating practitioners and other technical occupations
57,241Business and financial operations occupations
50,386Law enforcement workers including supervisors
48,962Installation, maintenance, and repair occupations
45,106Health technologists and technicians
38,706Construction and extraction occupations
Companies with federal contracts located in this zip code:
CUSTOM CRATE AND PALLET (244 INDUSTRIAL PARK RD in MOUNTAIN CITY, TN; small business) : $1,069,397 in 9 contractsfrom 2001 to 2005
Contracts for Ammunition and Nuclear Ordnance Boxes, Packages and Special Containers, Boxes, Cartons, and Crates by Army Signed by year:2000: $0; 2001: $92,639; 2002: $705,726; 2003: $250,000; 2004: $0; 2005: $21,032; 2006: $0.
Biggest contracts:
$607,446 with Army for Ammunition and Nuclear Ordnance Boxes, Packages and Special Containers. Signed on 2002-05-30. Completion date: 2003-05-29.
$150,000, same as above.Signed on 2003-03-13. Completion date: 2003-05-29.
$100,000, same as above.Signed on 2003-05-12. Completion date: 2003-05-29.
$98,280, same as above.Signed on 2002-02-28. Completion date: 2002-05-01.
Top industries in this zip code by the number of employees in 2005:
Construction: Highway, Street, and Bridge Construction (100-249 employees: 1 establishment, 1-4 employees: 1 establishment)
Health Care and Social Assistance: Nursing Care Facilities (100-249: 1)
Finance and Insurance: Commercial Banking (20-49: 2, 5-9: 1)
Health Care and Social Assistance: Residential Mental Health and Substance Abuse Facilities (50-99: 1)
Health Care and Social Assistance: General Medical and Surgical Hospitals (50-99: 1)
People in group quarters in 2010:
1,548 people in state prisons
114 people in local jails and other municipal confinement facilities
105 people in nursing facilities/skilled-nursing facilities
49 people in residential treatment centers for juveniles (non-correctional)
11 people in workers' group living quarters and job corps centers
People in group quarters in 2000:
1,299 people in state prisons
117 people in nursing homes
46 people in local jails and other confinement facilities (including police lockups)
20 people in other noninstitutional group quarters
2 people in homes for the mentally ill
Fatal accident statistics in 2013:
Fatal accident count: 2
Vehicles involved in fatal accidents: 3
Fatal accidents caused by drunken drivers: 1
Fatalities: 2
Persons involved in fatal accidents: 3
Pedestrians involved in fatal accidents: 0
Fatal accident statistics in 2012:
Fatal accident count: 2
Vehicles involved in fatal accidents: 4
Fatal accidents caused by drunken drivers: 0
Fatalities: 3
Persons involved in fatal accidents: 8
Pedestrians involved in fatal accidents: 0
2002 - 2018 National Fire Incident Reporting System (NFIRS) incidents
Based on the data from the years 2002 - 2018 the average number of fire incidents per year is 70. The highest number of reported fires - 157 took place in 2007, and the least - 9 in 2003. The data has a growing trend.
When looking into fire subcategories, the most reports belonged to: Structure Fires (50.6%), and Outside Fires (34.0%).
Fire incident types reported to NFIRS in Zip Code 37683


 Nearest zip codes: 37691, 37688, 28698, 28615, 37680, 28692.


 Based on the data from the years 2002 - 2018 the average number of fire incidents per year is 70. The highest number of reported fires - 157 took place in 2007, and the least - 9 in 2003. The data has a growing trend.
 When looking into fire subcategories, the most reports belonged to: Structure Fires (50.6%), and Outside Fires (34.0%).