Estimated zip code population in 2022: 5,642 Zip code population in 2010: 4,559 Zip code population in 2000: 4,301
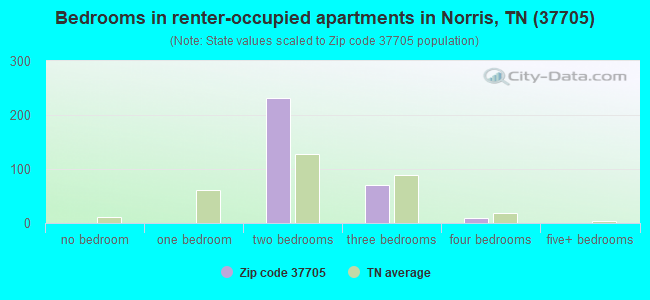
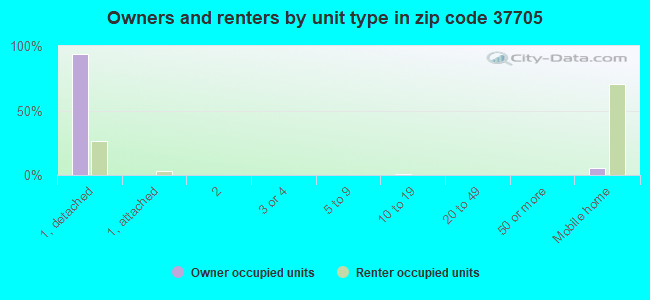
Houses and condos: 2,500 Renter-occupied apartments: 311
% of renters here:
16%
State:
33%
March 2022 cost of living index in zip code 37705: 82.0 (low, U.S. average is 100)
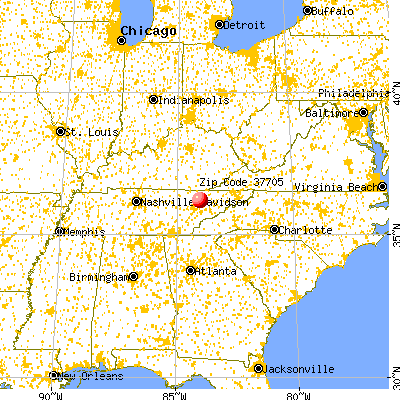
Land area: 43.5 sq. mi. Water area: 4.4 sq. mi.
Population density: 130 people per square mile
(very low).
OSM Map
General Map
Google Map
MSN Map
OSM Map
General Map
Google Map
MSN Map
OSM Map
General Map
Google Map
MSN Map
OSM Map
General Map
Google Map
MSN Map
Please wait while loading the map...
Real estate property taxes paid for housing units in 2022:
This zip code:
0.4% ($1,296)
Tennessee:
0.5% ($1,376)
Median real estate property taxes paid for housing units with mortgages in 2022: $1,288 (0.3%) Median real estate property taxes paid for housing units with no mortgage in 2022: $1,322 (0.6%)
Estimated median house/condo value in 2022: $297,439
37705:
$297,439
Tennessee:
$284,800
According to our research of Tennessee and other state lists, there were 9 registered sex offenders living in 37705 zip code as of May 28, 2024. The ratio of all residents to sex offenders in zip code 37705 is 470 to 1. The ratio of registered sex offenders to all residents in this zip code is lower than the state average.
Median resident age:
This zip code:
35.5 years
Tennessee median age:
39.2 years
Average household size:
This zip code:
2.9 people
Tennessee:
2.4 people
Averages for the 2020 tax year for zip code 37705, filed in 2021:
Average Adjusted Gross Income (AGI) in 2020: $70,122 (Individual Income Tax Returns)
Here:
$70,122
State:
$69,014
Salary/wage: $60,044 (reported on 79.9% of returns)
Here:
$60,044
State:
$55,872
(% of AGI for various income ranges: 1105.4% for AGIs below $25k, 3362.9% for AGIs $25k-50k, 5946.5% for AGIs $50k-75k, 8687.4% for AGIs $75k-100k, 15859.2% for AGIs $100k-200k, 56795.0% for AGIs over 200k)
Taxable interest for individuals: $1,210 (reported on 34.2% of returns)
This zip code:
$1,210
Tennessee:
$1,945
(% of AGI for various income ranges: 11.9% for AGIs below $25k, 23.4% for AGIs $25k-50k, 27.3% for AGIs $50k-75k, 53.7% for AGIs $75k-100k, 59.6% for AGIs $100k-200k, 1235.0% for AGIs over 200k)
Ordinary dividends: $5,003 (reported on 14.5% of returns)
Here:
$5,003
State:
$8,105
(% of AGI for various income ranges: 17.1% for AGIs below $25k, 15.4% for AGIs $25k-50k, 71.2% for AGIs $50k-75k, 95.8% for AGIs $75k-100k, 146.2% for AGIs $100k-200k, 2077.5% for AGIs over 200k)
Net capital gain/loss in AGI: +$13,482 (reported on 14.5% of returns)
Here:
+$13,482
State:
+$33,664
(% of AGI for various income ranges: 8.8% for AGIs below $25k, 25.9% for AGIs $25k-50k, 98.1% for AGIs $50k-75k, 186.8% for AGIs $75k-100k, 488.3% for AGIs $100k-200k, 6625.0% for AGIs over 200k)
Profit/loss from business: +$18,622 (reported on 17.1% of returns)
Here:
+$18,622
State:
+$18,991
(% of AGI for various income ranges: 169.8% for AGIs below $25k, 136.1% for AGIs $25k-50k, 247.3% for AGIs $50k-75k, 327.4% for AGIs $75k-100k, 1025.0% for AGIs $100k-200k, 5707.5% for AGIs over 200k)
Taxable individual retirement arrangement distribution: $17,970 (reported on 9.8% of returns)
37705:
$17,970
Tennessee:
$20,036
(% of AGI for various income ranges: 63.7% for AGIs below $25k, 80.2% for AGIs $25k-50k, 194.2% for AGIs $50k-75k, 261.6% for AGIs $75k-100k, 539.6% for AGIs $100k-200k, 2940.0% for AGIs over 200k)
Total itemized deductions: $32,825 (reported on 5.1% of returns)
Here:
$32,825
State:
$40,136
(% of AGI for various income ranges: 385.0% for AGIs $50k-75k, 555.0% for AGIs $100k-200k, 4015.0% for AGIs over 200k)
Charity contributions: $12,356 (reported on 3.8% of returns)
Here:
$12,356
State:
$19,852
(% of AGI for various income ranges: 12.9% for AGIs below $25k, 148.8% for AGIs $100k-200k, 1720.0% for AGIs over 200k)
Taxes paid: $5,875 (reported on 5.1% of returns)
37705:
$5,875
State:
$6,038
(% of AGI for various income ranges: 51.5% for AGIs $50k-75k, 110.8% for AGIs $100k-200k, 762.5% for AGIs over 200k)
Earned income credit: $2,231 (reported on 15.0% of returns)
Here:
$2,231
State:
$2,391
(% of AGI for various income ranges: 97.3% for AGIs below $25k, 67.1% for AGIs $25k-50k)
Percentage of individuals using paid preparers for their 2020 taxes: 94.4%
Here:
94%
State:
93%
(% for various income ranges: 94.3% for AGIs below $25k, 94.1% for AGIs $25k-50k, 94.3% for AGIs $50k-75k, 96.3% for AGIs $75k-100k, 94.7% for AGIs $100k-200k, 92.3% for AGIs over 200k)
Averages for the 2012 tax year for zip code 37705, filed in 2013:
Average Adjusted Gross Income (AGI) in 2012: $52,210 (Individual Income Tax Returns)
Here:
$52,210
State:
$53,767
Salary/wage: $46,367 (reported on 82.7% of returns)
Here:
$46,367
State:
$45,421
(% of AGI for various income ranges: 69.8% for AGIs below $25k, 77.0% for AGIs $25k-50k, 75.4% for AGIs $50k-75k, 76.7% for AGIs $75k-100k, 77.9% for AGIs $100k-200k, 54.3% for AGIs over 200k)
Taxable interest for individuals: $978 (reported on 31.2% of returns)
This zip code:
$978
Tennessee:
$1,732
(% of AGI for various income ranges: 1.1% for AGIs below $25k, 0.7% for AGIs $25k-50k, 0.9% for AGIs $50k-75k, 0.6% for AGIs $75k-100k, 0.2% for AGIs $100k-200k, 0.5% for AGIs over 200k)
Ordinary dividends: $2,207 (reported on 13.4% of returns)
Here:
$2,207
State:
$6,739
(% of AGI for various income ranges: 0.8% for AGIs below $25k, 0.5% for AGIs $25k-50k, 0.2% for AGIs $50k-75k, 0.9% for AGIs $75k-100k, 0.8% for AGIs $100k-200k)
Net capital gain/loss in AGI: +$8,933 (reported on 10.4% of returns)
Here:
+$8,933
State:
+$19,082
(% of AGI for various income ranges: 0.3% for AGIs $25k-50k, 0.3% for AGIs $50k-75k, 1.6% for AGIs $75k-100k, 0.7% for AGIs $100k-200k, 9.6% for AGIs over 200k)
Profit/loss from business: +$12,509 (reported on 17.3% of returns)
Here:
+$12,509
State:
+$15,240
(% of AGI for various income ranges: 11.5% for AGIs below $25k, 4.0% for AGIs $25k-50k, 3.6% for AGIs $50k-75k, 1.7% for AGIs $75k-100k, 5.7% for AGIs $100k-200k)
Taxable individual retirement arrangement distribution: $12,672 (reported on 8.9% of returns)
37705:
$12,672
Tennessee:
$15,505
(% of AGI for various income ranges: 2.9% for AGIs below $25k, 3.2% for AGIs $25k-50k, 2.0% for AGIs $50k-75k, 2.0% for AGIs $75k-100k, 2.5% for AGIs $100k-200k)
Total itemized deductions: $20,324 (21% of AGI, reported on 22.8% of returns)
Here:
$20,324
State:
$21,976
Here:
20.7% of AGI
State:
17.8% of AGI
(% of AGI for various income ranges: 6.7% for AGIs below $25k, 7.4% for AGIs $25k-50k, 8.6% for AGIs $50k-75k, 7.9% for AGIs $75k-100k, 10.4% for AGIs $100k-200k, 10.7% for AGIs over 200k)
Charity contributions: $4,806 (reported on 17.8% of returns)
Here:
$4,806
State:
$6,709
(% of AGI for various income ranges: 0.5% for AGIs below $25k, 0.9% for AGIs $25k-50k, 1.4% for AGIs $50k-75k, 1.7% for AGIs $75k-100k, 1.9% for AGIs $100k-200k, 3.1% for AGIs over 200k)
Taxes paid: $4,089 (reported on 22.8% of returns)
37705:
$4,089
State:
$4,829
(% of AGI for various income ranges: 0.9% for AGIs below $25k, 1.2% for AGIs $25k-50k, 1.6% for AGIs $50k-75k, 1.6% for AGIs $75k-100k, 2.2% for AGIs $100k-200k, 2.8% for AGIs over 200k)
Earned income credit: $2,287 (reported on 19.3% of returns)
Here:
$2,287
State:
$2,404
(% of AGI for various income ranges: 7.4% for AGIs below $25k, 1.1% for AGIs $25k-50k)
Percentage of individuals using paid preparers for their 2012 taxes: 57.9%
Here:
58%
State:
52%
(% for various income ranges: 53.2% for AGIs below $25k, 57.8% for AGIs $25k-50k, 63.3% for AGIs $50k-75k, 63.6% for AGIs $75k-100k, 59.1% for AGIs $100k-200k, 75.0% for AGIs over 200k)
Averages for the 2004 tax year for zip code 37705, filed in 2005:
Average Adjusted Gross Income (AGI) in 2004: $38,912 (Individual Income Tax Returns)
Here:
$38,912
State:
$44,088
Salary/wage: $37,444 (reported on 85.5% of returns)
Here:
$37,444
State:
$38,825
(% of AGI for various income ranges: 102.0% for AGIs below $10k, 78.1% for AGIs $10k-25k, 84.5% for AGIs $25k-50k, 82.7% for AGIs $50k-75k, 87.1% for AGIs $75k-100k, 76.3% for AGIs over 100k)
Taxable interest for individuals: $1,058 (reported on 39.7% of returns)
This zip code:
$1,058
Tennessee:
$1,802
(% of AGI for various income ranges: 3.3% for AGIs below $10k, 1.4% for AGIs $10k-25k, 0.9% for AGIs $25k-50k, 1.2% for AGIs $50k-75k, 0.3% for AGIs $75k-100k, 1.3% for AGIs over 100k)
Taxable dividends: $877 (reported on 13.8% of returns)
Here:
$877
State:
$3,727
(% of AGI for various income ranges: 1.1% for AGIs below $10k, 0.3% for AGIs $10k-25k, 0.2% for AGIs $25k-50k, 0.4% for AGIs $50k-75k, 0.3% for AGIs $75k-100k, 0.3% for AGIs over 100k)
Net capital gain/loss: +$2,843 (reported on 10.7% of returns)
Here:
+$2,843
State:
+$15,776
(% of AGI for various income ranges: 1.2% for AGIs below $10k, -0.1% for AGIs $10k-25k, -0.1% for AGIs $25k-50k, 0.6% for AGIs $50k-75k, 0.4% for AGIs $75k-100k, 2.7% for AGIs over 100k)
Profit/loss from business: +$9,052 (reported on 19.9% of returns)
Here:
+$9,052
State:
+$12,882
(% of AGI for various income ranges: 20.0% for AGIs below $10k, 7.5% for AGIs $10k-25k, 5.1% for AGIs $25k-50k, 4.8% for AGIs $50k-75k, 3.0% for AGIs $75k-100k, 2.3% for AGIs over 100k)
IRA payment deduction: $3,258 (reported on 1.7% of returns)
37705:
$3,258
Tennessee:
$2,934
Total itemized deductions: $16,583 (23% of AGI, reported on 20.9% of returns)
Here:
$16,583
State:
$18,035
Here:
23.5% of AGI
State:
19.9% of AGI
(% of AGI for various income ranges: 6.0% for AGIs $10k-25k, 7.2% for AGIs $25k-50k, 10.2% for AGIs $50k-75k, 12.0% for AGIs $75k-100k, 9.5% for AGIs over 100k)
Charity contributions deductions: $3,553 (5% of AGI, reported on 17.4% of returns)
Here:
$3,553
State:
$5,167
Here:
4.9% of AGI
State:
5.3% of AGI
(% of AGI for various income ranges: 0.6% for AGIs $10k-25k, 1.1% for AGIs $25k-50k, 1.8% for AGIs $50k-75k, 2.1% for AGIs $75k-100k, 2.2% for AGIs over 100k)
Total tax: $4,872 (reported on 76.0% of returns)
37705:
$4,872
State:
$7,482
(% of AGI for various income ranges: 3.9% for AGIs below $10k, 4.2% for AGIs $10k-25k, 6.2% for AGIs $25k-50k, 8.6% for AGIs $50k-75k, 10.7% for AGIs $75k-100k, 16.6% for AGIs over 100k)
Earned income credit: $1,747 (reported on 17.9% of returns)
Here:
$1,747
State:
$1,826
Percentage of individuals using paid preparers for their 2004 taxes: 60.9%
Here:
61%
State:
60%
(% for various income ranges: 51.3% for AGIs below $10k, 67.2% for AGIs $10k-25k, 63.4% for AGIs $25k-50k, 62.7% for AGIs $50k-75k, 58.1% for AGIs $75k-100k, 54.6% for AGIs over 100k)
Household received Food Stamps/SNAP in the past 12 months: 24 Household did not receive Food Stamps/SNAP in the past 12 months: 1,899
Women who had a birth in the past 12 months: 87 (89 now married, 0 unmarried) Women who did not have a birth in the past 12 months: 939 (756 now married, 183 unmarried)
Housing units in zip code 37705 with a mortgage: 1,080 (137 second mortgage, 111 both second mortgage and home equity loan) Median monthly owner costs for units with a mortgage: $1,530 Median monthly owner costs for units without a mortgage: $376
Residents with income below the poverty level in 2022:
This zip code:
1.3%
Whole state:
13.3%
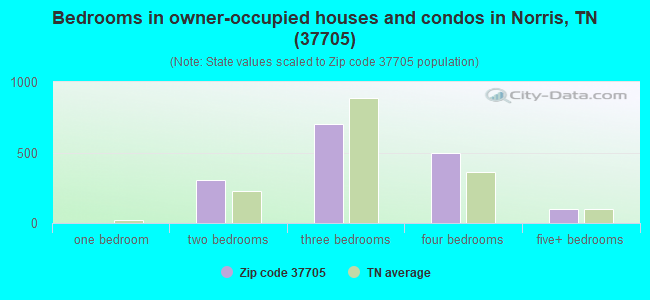
Median number of rooms in houses and condos:
Here:
6.7
State:
6.5
Median number of rooms in apartments:
Here:
3.3
State:
4.4
Notable locations in this zip code not listed on our city pages
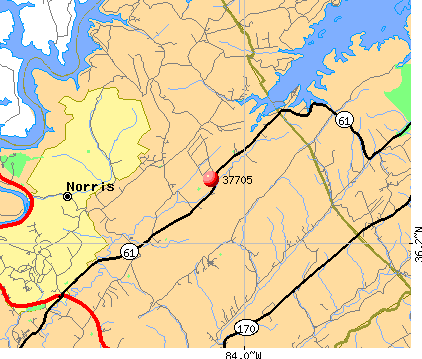
Notable locations in zip code 37705: Tanasi Council Girl Scout Camp (A), Fountain City Sportsmens Club (B), Star Dust Dock (C), Sequoyah Marina (D), Sequoyah Landing (E), Oak Ridge Yacht Club (F), Sequoyah Landing Cabin Area (G), Camp Pellissippi (H), Anderson County Sportsmens Club (I), Sequoyah Dock (J), Pellissippi Boat Dock (K), Pellissippi Point Cabin Area (L), Andersonville Dock (M), Andersonville Volunteer Fire Department Station 1 (N). Display/hide their locations on the map
Churches in zip code 37705 include: Lone Mountain Church (A), New Home Missionary Baptist Church (B), Mount Pleasant United Methodist Church (C), Mount Olive Baptist Church (D), Red Hill Baptist Church (E), Mount Zion Church (F), Indian Gap Church (G), Byrams Fork Church (H), Mount Pleasant Baptist Church (I). Display/hide their locations on the map
Cemeteries: Jones Cemetery (1), Warwick Cemetery (2), King Cemetery (3), Longmire Cemetery (4), Red Hill Cemetery (5), New Home Cemetery (6), Mount Pleasant Cemetery (7). Display/hide their locations on the map
Streams, rivers, and creeks: Dry Buffalo Branch (A), Blue Springs Branch (B), Cavespring Branch (C), Mill Creek (D). Display/hide their locations on the map
Parks in zip code 37705 include: Hemlock Bluff TVA Small Wild Area (1), Loyston Point Recreation Area (2), Anderson County Park (3), Norris Municipal Park (4). Display/hide their locations on the map
In group quarters: 87 (-1 institutionalized population)
Size of family households: 615 2-persons, 207 3-persons, 348 4-persons, 232 5-persons, 12 6-persons, 70 7-or-more-persons
Size of nonfamily households: 359 1-person, 61 2-persons, 9 4-persons
1,302 married couples with children.
220 single-parent households (220 women).
93.9% of residents of 37705 zip code speak English at home.
5.5% of residents speak Spanish at home (96% very well, 4% not well).
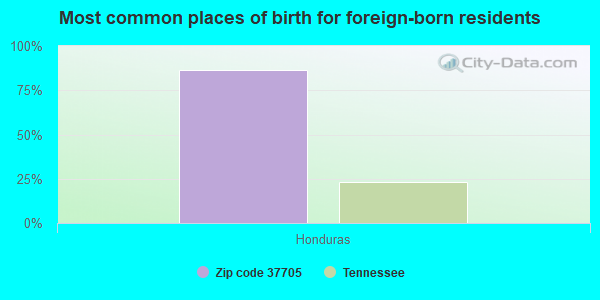
Foreign born population: 37 (0.7%) (0.0% of them are naturalized citizens)
:
0.7%
Whole state:
5.6%
86%Honduras
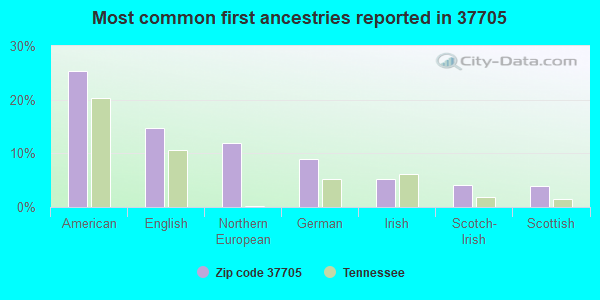
25%American
15%English
12%Northern European
9%German
5%Irish
4%Scotch-Irish
4%Scottish
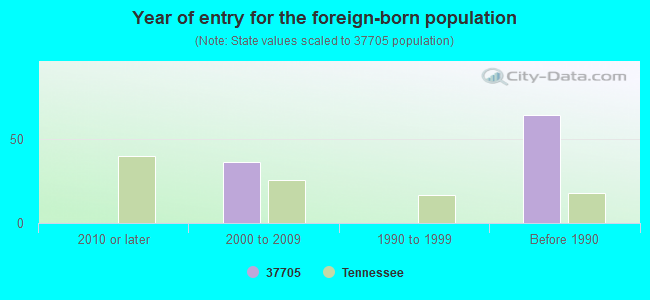
Year of entry for the foreign-born population
02010 or later
362000 to 2009
01990 to 1999
64Before 1990
Facilities with environmental interests located in this zip code:
ANDERSONVILLE ELEMENTARY (1951 MOUNTAIN RD in ANDERSONVILLE, TN)
(National Center for Education Statistics) - STATE ID-0005 Organizations: ANDERSON COUNTY SCHOOL DISTRCT (SCHOOL DISTRICT)
CLAYTON HOMES APPALACHIA (1420 MOUNTAIN RD. in ANDERSONVILLE, TN)
CRITERIA AND HAZARDOUS AIR POLLUTANT INVENTORY (Inventory of air pollution sources) TRI REPORTER (Tracking of toxic chemicals releasing facilities) Business SIC classification: MOBILE HOMES Business NAICS classification: MANUFACTURED HOME (MOBILE HOME) MANUFACTURING. Alternative names: APPALACHIA HOMES
Housing units lacking complete plumbing facilities: 4.0% Housing units lacking complete kitchen facilities: 5.1%
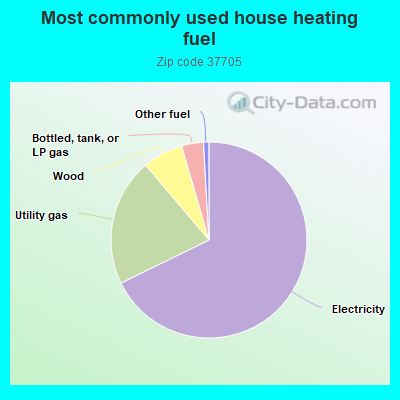
67.9%Electricity
21.1%Utility gas
6.7%Wood
3.6%Bottled, tank, or LP gas
0.9%Other fuel
Population in 1990: 5,761.
Place of birth for U.S.-born residents:
This state: 3,967
Northeast: 108
Midwest: 656
South: 566
West: 186
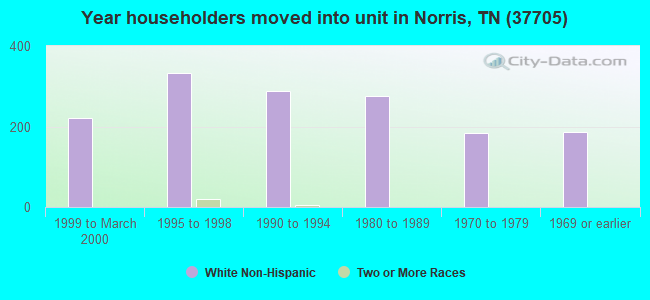
64% of the 37705 zip code residents lived in the same house 5 years ago. Out of people who lived in different houses, 56% lived in this county. Out of people who lived in different counties, 50% lived in Tennessee.
88% of the 37705 zip code residents lived in the same house 1 year ago. Out of people who lived in different houses, 26% moved from this county. Out of people who lived in different houses, 53% moved from different county within same state. Out of people who lived in different houses, 22% moved from different state.
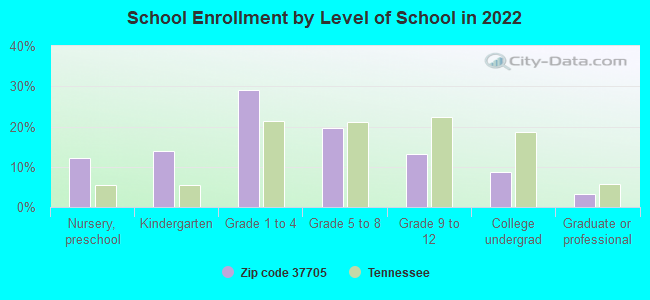
Private vs. public school enrollment:
Students in private schools in grades 1 to 8 (elementary and middle school): 9
Here:
1.7%
Tennessee:
15.0%
Students in private schools in grades 9 to 12 (high school):
Here:
0.0%
Tennessee:
16.2%
Students in private undergraduate colleges: 42
Here:
39.3%
Tennessee:
23.5%
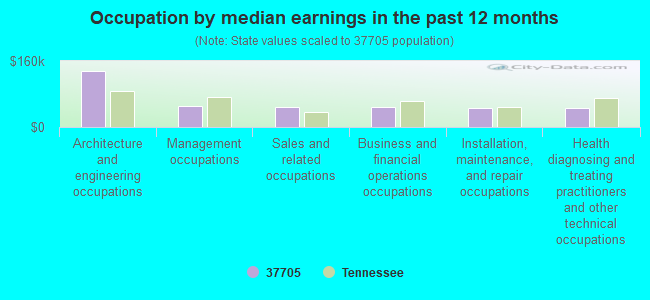
Occupation by median earnings in the past 12 months ($)
136,837Architecture and engineering occupations
52,007Management occupations
49,394Sales and related occupations
47,890Business and financial operations occupations
46,198Installation, maintenance, and repair occupations
45,657Health diagnosing and treating practitioners and other technical occupations
Top industries in this zip code by the number of employees in 2005:
Wholesale Trade: Medical, Dental, and Hospital Equipment and Supplies Merchant Wholesalers (20-49 employees: 1 establishment)
Administrative and Support and Waste Management and Remediation Services: Janitorial Services (20-49: 1)
Construction: Electrical Contractors (10-19: 1)
Wholesale Trade: Industrial Machinery and Equipment Merchant Wholesalers (10-19: 1)
Construction: Painting and Wall Covering Contractors (10-19: 1)
People in group quarters in 2010:
93 people in nursing facilities/skilled-nursing facilities
People in group quarters in 2000:
97 people in nursing homes
Fatal accident statistics in 2013:
Fatal accident count: 1
Vehicles involved in fatal accidents: 2
Fatal accidents caused by drunken drivers: 0
Fatalities: 1
Persons involved in fatal accidents: 4
Pedestrians involved in fatal accidents: 0
Fatal accident statistics in 2012:
Fatal accident count: 1
Vehicles involved in fatal accidents: 1
Fatal accidents caused by drunken drivers: 1
Fatalities: 1
Persons involved in fatal accidents: 1
Pedestrians involved in fatal accidents: 0
Home Mortgage Disclosure Act Aggregated Statistics For Year 2009 (Based on 4 partial tracts)
A) FHA, FSA/RHS & VA Home Purchase Loans
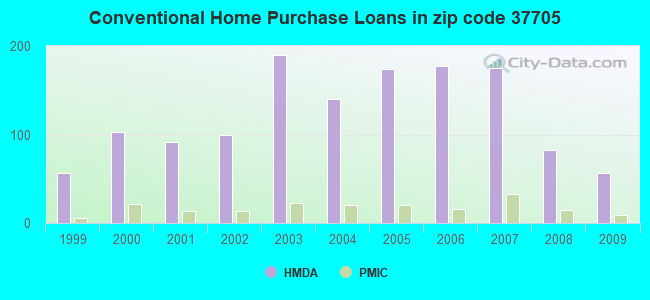
B) Conventional Home Purchase Loans
C) Refinancings
D) Home Improvement Loans
E) Loans on Dwellings For 5+ Families
F) Non-occupant Loans on < 5 Family Dwellings (A B C & D)
G) Loans On Manufactured Home Dwelling (A B C & D)
Number
Average Value
Number
Average Value
Number
Average Value
Number
Average Value
Number
Average Value
Number
Average Value
Number
Average Value
LOANS ORIGINATED
30
$144,265
57
$188,630
249
$170,418
23
$77,430
1
$125,850
44
$200,334
10
$90,980
APPLICATIONS APPROVED, NOT ACCEPTED
0
$0
3
$303,060
17
$189,024
1
$4,810
0
$0
0
$0
0
$0
APPLICATIONS DENIED
3
$156,907
6
$88,945
56
$180,490
8
$38,762
0
$0
4
$163,780
3
$53,143
APPLICATIONS WITHDRAWN
3
$146,560
6
$163,132
37
$166,004
3
$124,413
0
$0
0
$0
0
$0
FILES CLOSED FOR INCOMPLETENESS
1
$105,090
0
$0
18
$182,306
0
$0
0
$0
0
$0
0
$0
Aggregated Statistics For Year 2008 (Based on 4 partial tracts)
A) FHA, FSA/RHS & VA Home Purchase Loans
B) Conventional Home Purchase Loans
C) Refinancings
D) Home Improvement Loans
E) Loans on Dwellings For 5+ Families
F) Non-occupant Loans on < 5 Family Dwellings (A B C & D)
G) Loans On Manufactured Home Dwelling (A B C & D)
Number
Average Value
Number
Average Value
Number
Average Value
Number
Average Value
Number
Average Value
Number
Average Value
Number
Average Value
LOANS ORIGINATED
31
$147,226
82
$191,212
152
$161,044
32
$56,371
1
$3,329,130
32
$195,554
13
$65,450
APPLICATIONS APPROVED, NOT ACCEPTED
4
$123,252
15
$194,607
15
$131,177
3
$44,543
0
$0
4
$274,760
3
$76,113
APPLICATIONS DENIED
4
$160,025
16
$253,799
83
$153,693
25
$49,076
0
$0
5
$170,998
5
$48,734
APPLICATIONS WITHDRAWN
2
$223,095
7
$249,186
25
$161,201
2
$117,055
0
$0
0
$0
2
$101,410
FILES CLOSED FOR INCOMPLETENESS
0
$0
0
$0
11
$116,239
0
$0
0
$0
0
$0
0
$0
Aggregated Statistics For Year 2007 (Based on 4 partial tracts)
A) FHA, FSA/RHS & VA Home Purchase Loans
B) Conventional Home Purchase Loans
C) Refinancings
D) Home Improvement Loans
F) Non-occupant Loans on < 5 Family Dwellings (A B C & D)
G) Loans On Manufactured Home Dwelling (A B C & D)
Number
Average Value
Number
Average Value
Number
Average Value
Number
Average Value
Number
Average Value
Number
Average Value
LOANS ORIGINATED
8
$154,218
175
$154,510
134
$140,324
25
$57,484
51
$176,569
24
$53,712
APPLICATIONS APPROVED, NOT ACCEPTED
0
$0
23
$125,544
24
$90,714
2
$8,440
1
$347,700
9
$98,522
APPLICATIONS DENIED
0
$0
42
$151,765
79
$112,637
25
$80,735
7
$162,096
15
$54,980
APPLICATIONS WITHDRAWN
1
$140,120
10
$93,185
24
$150,005
9
$54,557
4
$89,198
5
$63,274
FILES CLOSED FOR INCOMPLETENESS
0
$0
12
$162,846
14
$124,039
1
$175,150
1
$108,980
0
$0
Aggregated Statistics For Year 2006 (Based on 4 partial tracts)
A) FHA, FSA/RHS & VA Home Purchase Loans
B) Conventional Home Purchase Loans
C) Refinancings
D) Home Improvement Loans
F) Non-occupant Loans on < 5 Family Dwellings (A B C & D)
G) Loans On Manufactured Home Dwelling (A B C & D)
Number
Average Value
Number
Average Value
Number
Average Value
Number
Average Value
Number
Average Value
Number
Average Value
LOANS ORIGINATED
14
$121,976
177
$126,246
142
$124,883
32
$70,183
65
$148,069
25
$47,883
APPLICATIONS APPROVED, NOT ACCEPTED
1
$224,450
31
$108,771
32
$107,190
6
$41,785
16
$104,319
16
$56,039
APPLICATIONS DENIED
0
$0
27
$103,489
75
$109,418
20
$35,196
15
$95,810
31
$50,065
APPLICATIONS WITHDRAWN
2
$85,920
12
$104,447
43
$138,891
5
$36,940
2
$178,150
4
$49,480
FILES CLOSED FOR INCOMPLETENESS
0
$0
7
$106,209
12
$148,512
2
$60,360
0
$0
0
$0
Aggregated Statistics For Year 2005 (Based on 4 partial tracts)
A) FHA, FSA/RHS & VA Home Purchase Loans
B) Conventional Home Purchase Loans
C) Refinancings
D) Home Improvement Loans
F) Non-occupant Loans on < 5 Family Dwellings (A B C & D)
G) Loans On Manufactured Home Dwelling (A B C & D)
Number
Average Value
Number
Average Value
Number
Average Value
Number
Average Value
Number
Average Value
Number
Average Value
LOANS ORIGINATED
11
$112,758
174
$138,297
180
$127,016
18
$32,451
25
$174,916
22
$60,079
APPLICATIONS APPROVED, NOT ACCEPTED
2
$65,310
24
$85,120
30
$95,451
3
$119,380
4
$105,558
20
$48,521
APPLICATIONS DENIED
0
$0
41
$76,763
84
$95,540
22
$62,842
7
$51,870
31
$51,195
APPLICATIONS WITHDRAWN
0
$0
18
$71,449
99
$120,359
7
$56,691
5
$75,372
7
$69,407
FILES CLOSED FOR INCOMPLETENESS
0
$0
5
$126,362
10
$172,884
0
$0
0
$0
0
$0
Aggregated Statistics For Year 2004 (Based on 4 partial tracts)
A) FHA, FSA/RHS & VA Home Purchase Loans
B) Conventional Home Purchase Loans
C) Refinancings
D) Home Improvement Loans
F) Non-occupant Loans on < 5 Family Dwellings (A B C & D)
G) Loans On Manufactured Home Dwelling (A B C & D)
Number
Average Value
Number
Average Value
Number
Average Value
Number
Average Value
Number
Average Value
Number
Average Value
LOANS ORIGINATED
11
$91,130
140
$132,441
154
$103,338
24
$33,430
20
$160,344
18
$62,820
APPLICATIONS APPROVED, NOT ACCEPTED
0
$0
31
$73,484
28
$105,289
3
$24,590
4
$152,770
25
$47,815
APPLICATIONS DENIED
4
$102,505
53
$58,886
94
$91,783
12
$29,255
3
$90,963
48
$49,389
APPLICATIONS WITHDRAWN
3
$117,833
8
$186,715
74
$97,191
2
$38,185
3
$141,417
9
$76,318
FILES CLOSED FOR INCOMPLETENESS
0
$0
3
$86,410
12
$105,277
0
$0
1
$77,840
0
$0
Aggregated Statistics For Year 2003 (Based on 4 partial tracts)
A) FHA, FSA/RHS & VA Home Purchase Loans
B) Conventional Home Purchase Loans
C) Refinancings
D) Home Improvement Loans
F) Non-occupant Loans on < 5 Family Dwellings (A B C & D)
Number
Average Value
Number
Average Value
Number
Average Value
Number
Average Value
Number
Average Value
LOANS ORIGINATED
18
$111,283
190
$84,876
330
$109,162
32
$35,804
29
$91,794
APPLICATIONS APPROVED, NOT ACCEPTED
3
$105,250
82
$62,130
59
$116,777
3
$15,137
7
$71,469
APPLICATIONS DENIED
7
$59,979
213
$44,265
114
$95,666
11
$10,310
8
$64,389
APPLICATIONS WITHDRAWN
4
$149,382
17
$106,495
57
$116,184
0
$0
4
$103,792
FILES CLOSED FOR INCOMPLETENESS
1
$210,180
3
$36,327
11
$99,773
0
$0
0
$0
Aggregated Statistics For Year 2002 (Based on 4 partial tracts)
A) FHA, FSA/RHS & VA Home Purchase Loans
B) Conventional Home Purchase Loans
C) Refinancings
D) Home Improvement Loans
F) Non-occupant Loans on < 5 Family Dwellings (A B C & D)
Number
Average Value
Number
Average Value
Number
Average Value
Number
Average Value
Number
Average Value
LOANS ORIGINATED
14
$111,534
100
$107,141
207
$107,768
24
$18,726
24
$76,520
APPLICATIONS APPROVED, NOT ACCEPTED
2
$72,855
14
$80,146
36
$83,913
4
$18,402
4
$73,952
APPLICATIONS DENIED
2
$72,865
21
$69,375
76
$87,465
19
$11,211
2
$44,240
APPLICATIONS WITHDRAWN
1
$203,690
8
$89,521
45
$84,533
4
$7,358
2
$52,125
FILES CLOSED FOR INCOMPLETENESS
0
$0
2
$70,195
6
$88,022
0
$0
1
$108,980
Aggregated Statistics For Year 2001 (Based on 4 partial tracts)
A) FHA, FSA/RHS & VA Home Purchase Loans
B) Conventional Home Purchase Loans
C) Refinancings
D) Home Improvement Loans
F) Non-occupant Loans on < 5 Family Dwellings (A B C & D)
Number
Average Value
Number
Average Value
Number
Average Value
Number
Average Value
Number
Average Value
LOANS ORIGINATED
15
$82,048
91
$87,280
218
$91,182
28
$32,928
15
$82,095
APPLICATIONS APPROVED, NOT ACCEPTED
0
$0
34
$65,979
40
$80,534
5
$34,476
3
$138,390
APPLICATIONS DENIED
0
$0
44
$45,597
91
$84,097
10
$11,495
5
$36,082
APPLICATIONS WITHDRAWN
2
$58,465
5
$87,826
49
$80,299
5
$11,524
0
$0
FILES CLOSED FOR INCOMPLETENESS
0
$0
3
$55,627
9
$90,637
0
$0
0
$0
Aggregated Statistics For Year 2000 (Based on 4 partial tracts)
A) FHA, FSA/RHS & VA Home Purchase Loans
B) Conventional Home Purchase Loans
C) Refinancings
D) Home Improvement Loans
F) Non-occupant Loans on < 5 Family Dwellings (A B C & D)
Number
Average Value
Number
Average Value
Number
Average Value
Number
Average Value
Number
Average Value
LOANS ORIGINATED
13
$97,442
103
$86,647
102
$82,558
21
$17,257
9
$76,596
APPLICATIONS APPROVED, NOT ACCEPTED
1
$26,450
36
$58,371
30
$75,582
9
$38,396
2
$64,610
APPLICATIONS DENIED
0
$0
80
$51,382
62
$74,733
9
$45,403
3
$88,223
APPLICATIONS WITHDRAWN
2
$79,795
7
$62,443
39
$77,693
3
$18,073
0
$0
FILES CLOSED FOR INCOMPLETENESS
0
$0
3
$99,467
9
$70,663
0
$0
0
$0
Aggregated Statistics For Year 1999 (Based on 2 partial tracts)
A) FHA, FSA/RHS & VA Home Purchase Loans
B) Conventional Home Purchase Loans
C) Refinancings
D) Home Improvement Loans
F) Non-occupant Loans on < 5 Family Dwellings (A B C & D)
Detailed PMIC statistics for the following Tracts:0209.01
, 0209.02
2002 - 2018 National Fire Incident Reporting System (NFIRS) incidents
Based on the data from the years 2002 - 2018 the average number of fires per year is 31. The highest number of fire incidents - 62 took place in 2010, and the least - 6 in 2003. The data has a growing trend.
When looking into fire subcategories, the most reports belonged to: Structure Fires (41.3%), and Outside Fires (35.8%).
Fire incident types reported to NFIRS in Zip Code 37705


 Nearest zip codes: 37828, 37754, 37938, 37769, 37757, 37849.


 Based on the data from the years 2002 - 2018 the average number of fires per year is 31. The highest number of fire incidents - 62 took place in 2010, and the least - 6 in 2003. The data has a growing trend.
 When looking into fire subcategories, the most reports belonged to: Structure Fires (41.3%), and Outside Fires (35.8%).