Estimated zip code population in 2022: 1,473 Zip code population in 2010: 1,430 Zip code population in 2000: 1,386
Houses and condos: 830 Renter-occupied apartments: 141
% of renters here:
18%
State:
33%
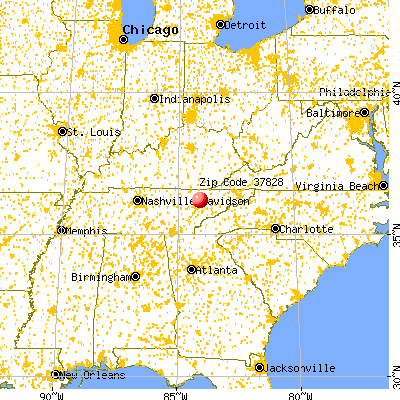
March 2022 cost of living index in zip code 37828: 87.1 (less than average, U.S. average is 100)
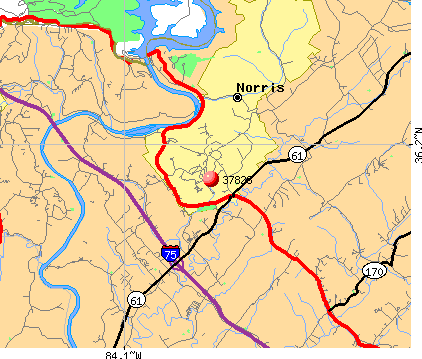
Land area: 3.2 sq. mi. Water area: 0.0 sq. mi.
Population density: 455 people per square mile
(low).
OSM Map
General Map
Google Map
MSN Map
OSM Map
General Map
Google Map
MSN Map
OSM Map
General Map
Google Map
MSN Map
OSM Map
General Map
Google Map
MSN Map
Please wait while loading the map...
Real estate property taxes paid for housing units in 2022:
This zip code:
0.5% ($1,887)
Tennessee:
0.5% ($1,376)
Median real estate property taxes paid for housing units with mortgages in 2022: $2,010 (0.5%) Median real estate property taxes paid for housing units with no mortgage in 2022: $1,752 (0.5%)
Business Search- 14 Million verified businesses
Males: 692
(47.0%)
Females: 781
(53.0%)
For population 25 years and over in 37828:
High school or higher: 101.4%
Bachelor's degree or higher: 62.2%
Graduate or professional degree: 31.8%
Mean travel time to work (commute): 24.7 minutes
For population 15 years and over in 37828:
Never married: 19.3%
Now married: 62.2%
Separated: 1.4%
Widowed: 9.1%
Divorced: 8.1%
Zip code 37828 compared to state average:
Unemployed percentage significantly below state average.
Black race population percentage significantly below state average.
Hispanic race population percentage significantly below state average.
Median age significantly above state average.
Foreign-born population percentage significantly below state average.
Renting percentage below state average.
Length of stay since moving in significantly above state average.
House age above state average.
Percentage of population with a bachelor's degree or higher significantly above state average.
Estimated median house/condo value in 2022: $364,927
37828:
$364,927
Tennessee:
$284,800
According to our research of Tennessee and other state lists, there was 1 registered sex offender living in 37828 zip code as of May 28, 2024. The ratio of all residents to sex offenders in zip code 37828 is 1,536 to 1. The ratio of registered sex offenders to all residents in this zip code is much lower than the state average.
Median resident age:
This zip code:
59.2 years
Tennessee median age:
39.2 years
Average household size:
This zip code:
1.9 people
Tennessee:
2.4 people
Averages for the 2004 tax year for zip code 37828, filed in 2005:
Average Adjusted Gross Income (AGI) in 2004: $59,121 (Individual Income Tax Returns)
Here:
$59,121
State:
$44,088
Salary/wage: $50,525 (reported on 76.7% of returns)
Here:
$50,525
State:
$38,825
(% of AGI for various income ranges: 79.4% for AGIs below $10k, 68.8% for AGIs $10k-25k, 73.4% for AGIs $25k-50k, 60.2% for AGIs $50k-75k, 76.2% for AGIs $75k-100k, 60.9% for AGIs over 100k)
Taxable interest for individuals: $1,740 (reported on 55.7% of returns)
This zip code:
$1,740
Tennessee:
$1,802
(% of AGI for various income ranges: 2.7% for AGIs below $10k, 2.5% for AGIs $10k-25k, 1.6% for AGIs $25k-50k, 3.3% for AGIs $50k-75k, 0.6% for AGIs $75k-100k, 1.3% for AGIs over 100k)
Taxable dividends: $2,749 (reported on 30.9% of returns)
Here:
$2,749
State:
$3,727
(% of AGI for various income ranges: 1.5% for AGIs below $10k, 2.4% for AGIs $10k-25k, 1.8% for AGIs $25k-50k, 1.1% for AGIs $50k-75k, 1.1% for AGIs $75k-100k, 1.4% for AGIs over 100k)
Net capital gain/loss: +$5,090 (reported on 21.4% of returns)
Here:
+$5,090
State:
+$15,776
(% of AGI for various income ranges: -5.2% for AGIs below $10k, 0.6% for AGIs $10k-25k, -0.1% for AGIs $25k-50k, 2.0% for AGIs $50k-75k, 0.4% for AGIs $75k-100k, 3.2% for AGIs over 100k)
Profit/loss from business: +$12,236 (reported on 19.1% of returns)
Here:
+$12,236
State:
+$12,882
(% of AGI for various income ranges: 22.0% for AGIs below $10k, 5.0% for AGIs $10k-25k, 2.9% for AGIs $25k-50k, 4.7% for AGIs $50k-75k, 2.4% for AGIs $75k-100k, 3.9% for AGIs over 100k)
IRA payment deduction: $3,769 (reported on 3.4% of returns)
37828:
$3,769
Tennessee:
$2,934
Total itemized deductions: $18,429 (17% of AGI, reported on 30.1% of returns)
Here:
$18,429
State:
$18,035
Here:
17.3% of AGI
State:
19.9% of AGI
(% of AGI for various income ranges: 9.3% for AGIs $10k-25k, 11.1% for AGIs $25k-50k, 9.1% for AGIs $50k-75k, 11.8% for AGIs $75k-100k, 8.5% for AGIs over 100k)
Charity contributions deductions: $4,702 (4% of AGI, reported on 26.9% of returns)
Here:
$4,702
State:
$5,167
Here:
4.2% of AGI
State:
5.3% of AGI
(% of AGI for various income ranges: 1.6% for AGIs $10k-25k, 1.7% for AGIs $25k-50k, 2.1% for AGIs $50k-75k, 2.3% for AGIs $75k-100k, 2.4% for AGIs over 100k)
Total tax: $10,680 (reported on 80.7% of returns)
37828:
$10,680
State:
$7,482
(% of AGI for various income ranges: 4.0% for AGIs below $10k, 4.6% for AGIs $10k-25k, 7.5% for AGIs $25k-50k, 9.8% for AGIs $50k-75k, 10.9% for AGIs $75k-100k, 20.7% for AGIs over 100k)
Earned income credit: $1,569 (reported on 8.4% of returns)
Here:
$1,569
State:
$1,826
Percentage of individuals using paid preparers for their 2004 taxes: 53.9%
Here:
54%
State:
60%
(% for various income ranges: 50.7% for AGIs below $10k, 53.0% for AGIs $10k-25k, 59.4% for AGIs $25k-50k, 54.2% for AGIs $50k-75k, 48.2% for AGIs $75k-100k, 55.0% for AGIs over 100k)
Household received Food Stamps/SNAP in the past 12 months: 0 Household did not receive Food Stamps/SNAP in the past 12 months: 789
Women who had a birth in the past 12 months: 15 (16 now married, 0 unmarried) Women who did not have a birth in the past 12 months: 216 (90 now married, 125 unmarried)
Housing units in zip code 37828 with a mortgage: 327 (34 second mortgage, 34 both second mortgage and home equity loan) Houses without a mortgage: 4
Median monthly owner costs for units with a mortgage: $1,675 Median monthly owner costs for units without a mortgage: $523
Residents with income below the poverty level in 2022:
This zip code:
5.3%
Whole state:
13.3%
Residents with income below 50% of the poverty level in 2022:
This zip code:
2.5%
Whole state:
7.1%
Median number of rooms in houses and condos:
Here:
7.2
State:
6.5
Median number of rooms in apartments:
Here:
3.7
State:
4.4
Notable locations in this zip code not listed on our city pages
In group quarters: 17 (-1 institutionalized population)
Size of family households: 311 2-persons, 83 3-persons, 59 4-persons, 13 6-persons
Size of nonfamily households: 295 1-person, 17 2-persons
132 married couples with children.
0 single-parent households ().
100.8% of residents of 37828 zip code speak English at home.
Foreign born population: 20 (1.4%) (59.6% of them are naturalized citizens)
This zip code:
1.4%
Whole state:
5.6%
40%Romania
35%Malaysia
31%English
24%American
10%European
7%Scottish
7%German
5%Scotch-Irish
4%Swedish
Year of entry for the foreign-born population
02010 or later
202000 to 2009
01990 to 1999
9Before 1990
Facilities with environmental interests located in this zip code:
CARTON SERVICE (FIRST QUALITY DRIVE in NORRIS, TN)
(Resource Conservation and Recovery Act (tracking hazardous waste)) Business NAICS classification: FOLDING PAPERBOARD BOX MANUFACTURING. Organizations: ROBERT LEDERER (CONTACT/OWNER)
APPALACHIA HOMES (US 441 AT MOUNTAIN ROAD in NORRIS, TN)
AIR MINOR (AIRS/AFS) Business SIC classification: MOBILE HOMES
Housing units lacking complete kitchen facilities: 1.2%
62.8%Electricity
35.9%Utility gas
1.5%Wood
Place of birth for U.S.-born residents:
This state: 951
Northeast: 55
Midwest: 74
South: 316
West: 37
62% of the 37828 zip code residents lived in the same house 5 years ago. Out of people who lived in different houses, 42% lived in this county. Out of people who lived in different counties, 50% lived in Tennessee.
94% of the 37828 zip code residents lived in the same house 1 year ago. Out of people who lived in different houses, 40% moved from this county. Out of people who lived in different houses, 60% moved from different county within same state. Out of people who lived in different houses, 3% moved from different state.
Private vs. public school enrollment:
Students in private schools in grades 1 to 8 (elementary and middle school): 1
Here:
1.7%
Tennessee:
15.0%
Students in private schools in grades 9 to 12 (high school): 16
Here:
22.9%
Tennessee:
16.2%
Students in private undergraduate colleges: 14
Here:
20.8%
Tennessee:
23.5%
Occupation by median earnings in the past 12 months ($)
127,544Sales and related occupations
124,651Architecture and engineering occupations
110,118Management occupations
106,557Business and financial operations occupations
69,987Health diagnosing and treating practitioners and other technical occupations
66,523Installation, maintenance, and repair occupations
Companies with federal contracts located in this zip code (NORRIS, TN):
TENNESSEE VALLEY AUTHORITY (17 RIDGEWAY RD) : $88,417,294 in 15 contractsfrom 1999 to 2003
Contracts for Electric Services by ENERGY, Department of Signed by year:2000: $23,528,000; 2001: $23,774,000; 2002: $23,492,444; 2003: $12,198,850; 2004: $0; 2005: $0; 2006: $0.
Biggest contracts:
$7,186,000 with ENERGY, Department of for Electric Services. Signed on 2002-09-15. Completion date: 2004-03-15.
$6,847,000, same as above.Signed on 2001-12-15. Completion date: 2004-03-15.
$6,655,000, same as above.Signed on 2000-09-15. Completion date: 2004-03-15.
$6,517,950, same as above.Signed on 2003-09-15. Completion date: 2004-03-15.
PO DESMARAIS COMPANY (CORNER HWY 61 & CROSSPIKE; small business) : $508,030 in 14 contractsfrom 1999 to 2005
Contracts for Electrical and Electronic Properties Measuring and Testing Instruments, Miscellaneous Electrical and Electronic Components, Pressure, Temperature, and Humidity Measuring and Controlling Instruments, Laboratory Equipment and Supplies, and moreby Tennessee Valley Authority, Army, U.S. Army Corps of Engineers - civil program financing only Signed by year:2000: $324,000; 2001: $0; 2002: $0; 2003: $0; 2004: $5,034; 2005: $41,996; 2006: $0.
Biggest contracts:
$78,000 with Tennessee Valley Authority for Electrical and Electronic Properties Measuring and Testing Instruments. Taking place in GA. Signed on 2000-09-15. Completion date: 2000-10-15.
$68,000 with Tennessee Valley Authority for Miscellaneous Electrical and Electronic Components. Taking place in GA. Signed on 2000-07-15. Completion date: 2000-10-15.
$49,000 with Tennessee Valley Authority for Pressure, Temperature, and Humidity Measuring and Controlling Instruments. Taking place in GA. Signed on 1999-11-15. Completion date: 2000-01-15.
$47,000 with Tennessee Valley Authority for Miscellaneous Electrical and Electronic Components. Taking place in GA. Signed on 2000-07-15. Completion date: 2000-09-15.
HYDRO RESOURCE SOLUTIONS LLC (129 PINE ROAD; small business)
$33,375 with U.S. Army Corps of Engineers - civil program financing only for ADP Software. Signed on 2002-08-13. Completion date: 2002-07-31.
RTE (135 SAWMILL RD; small business)
$28,560 with U.S. Army Corps of Engineers - civil program financing only for Modification of Equipment -- Pipe, Tubing, Hose, and Fittings. Signed on 2000-10-18. Completion date: 2000-11-15.
TRADEWATER POWER & ENERGY SYST (140 SAWMILL ROAD; small business)
$18,500 with Army for Maintenance, Repair and Rebuilding of Equipment -- Miscellaneous. Signed on 2004-04-08. Completion date: 2004-05-08.
Top industries in this zip code by the number of employees in 2005:
Health Care and Social Assistance: Nursing Care Facilities (100-249 employees: 1 establishment)
Construction: Flooring Contractors (50-99: 1)
Other Services (except Public Administration): Religious Organizations (5-9: 2, 1-4: 2)
Construction: Plumbing, Heating, and Air-Conditioning Contractors (10-19: 1)
Construction: New Single-Family Housing Construction (except Operative Builders) (5-9: 1, 1-4: 1)
People in group quarters in 2010:
25 people in residential treatment centers for juveniles (non-correctional)
Home Mortgage Disclosure Act Aggregated Statistics For Year 2009 (Based on 2 partial tracts)
A) FHA, FSA/RHS & VA Home Purchase Loans
B) Conventional Home Purchase Loans
C) Refinancings
D) Home Improvement Loans
F) Non-occupant Loans on < 5 Family Dwellings (A B C & D)
G) Loans On Manufactured Home Dwelling (A B C & D)
Number
Average Value
Number
Average Value
Number
Average Value
Number
Average Value
Number
Average Value
Number
Average Value
LOANS ORIGINATED
3
$148,643
6
$188,832
25
$170,934
2
$93,810
5
$196,514
1
$89,070
APPLICATIONS APPROVED, NOT ACCEPTED
0
$0
0
$0
2
$155,165
0
$0
0
$0
0
$0
APPLICATIONS DENIED
0
$0
0
$0
5
$190,674
1
$32,900
0
$0
0
$0
APPLICATIONS WITHDRAWN
0
$0
1
$94,550
4
$153,090
0
$0
0
$0
0
$0
FILES CLOSED FOR INCOMPLETENESS
0
$0
0
$0
2
$168,280
0
$0
0
$0
0
$0
Aggregated Statistics For Year 2008 (Based on 2 partial tracts)
A) FHA, FSA/RHS & VA Home Purchase Loans
B) Conventional Home Purchase Loans
C) Refinancings
D) Home Improvement Loans
F) Non-occupant Loans on < 5 Family Dwellings (A B C & D)
G) Loans On Manufactured Home Dwelling (A B C & D)
Number
Average Value
Number
Average Value
Number
Average Value
Number
Average Value
Number
Average Value
Number
Average Value
LOANS ORIGINATED
3
$160,203
8
$207,258
15
$159,997
3
$60,860
3
$233,120
1
$76,920
APPLICATIONS APPROVED, NOT ACCEPTED
0
$0
1
$306,630
1
$195,920
0
$0
0
$0
0
$0
APPLICATIONS DENIED
0
$0
2
$224,375
8
$164,131
3
$39,867
1
$97,660
0
$0
APPLICATIONS WITHDRAWN
0
$0
1
$192,960
3
$130,367
0
$0
0
$0
0
$0
FILES CLOSED FOR INCOMPLETENESS
0
$0
0
$0
1
$125,080
0
$0
0
$0
0
$0
Aggregated Statistics For Year 2007 (Based on 2 partial tracts)
A) FHA, FSA/RHS & VA Home Purchase Loans
B) Conventional Home Purchase Loans
C) Refinancings
D) Home Improvement Loans
F) Non-occupant Loans on < 5 Family Dwellings (A B C & D)
G) Loans On Manufactured Home Dwelling (A B C & D)
Number
Average Value
Number
Average Value
Number
Average Value
Number
Average Value
Number
Average Value
Number
Average Value
LOANS ORIGINATED
1
$112,190
18
$159,348
13
$139,912
2
$71,730
5
$198,470
2
$62,765
APPLICATIONS APPROVED, NOT ACCEPTED
0
$0
2
$155,015
2
$98,700
0
$0
0
$0
1
$92,920
APPLICATIONS DENIED
0
$0
5
$141,028
7
$107,571
2
$97,885
1
$121,820
1
$80,620
APPLICATIONS WITHDRAWN
0
$0
1
$100,780
2
$159,685
1
$40,760
0
$0
1
$33,640
FILES CLOSED FOR INCOMPLETENESS
0
$0
1
$220,370
1
$182,730
0
$0
0
$0
0
$0
Aggregated Statistics For Year 2006 (Based on 2 partial tracts)
A) FHA, FSA/RHS & VA Home Purchase Loans
B) Conventional Home Purchase Loans
C) Refinancings
D) Home Improvement Loans
F) Non-occupant Loans on < 5 Family Dwellings (A B C & D)
G) Loans On Manufactured Home Dwelling (A B C & D)
Number
Average Value
Number
Average Value
Number
Average Value
Number
Average Value
Number
Average Value
Number
Average Value
LOANS ORIGINATED
1
$185,250
18
$127,229
14
$126,394
3
$76,917
7
$153,197
2
$54,610
APPLICATIONS APPROVED, NOT ACCEPTED
0
$0
3
$116,387
3
$119,350
1
$23,120
1
$172,360
1
$80,620
APPLICATIONS DENIED
0
$0
3
$93,367
7
$113,310
2
$31,865
1
$143,010
3
$48,857
APPLICATIONS WITHDRAWN
0
$0
1
$140,050
4
$145,050
0
$0
0
$0
0
$0
FILES CLOSED FOR INCOMPLETENESS
0
$0
1
$63,870
1
$181,250
0
$0
0
$0
0
$0
Aggregated Statistics For Year 2005 (Based on 2 partial tracts)
A) FHA, FSA/RHS & VA Home Purchase Loans
B) Conventional Home Purchase Loans
C) Refinancings
D) Home Improvement Loans
F) Non-occupant Loans on < 5 Family Dwellings (A B C & D)
G) Loans On Manufactured Home Dwelling (A B C & D)
Number
Average Value
Number
Average Value
Number
Average Value
Number
Average Value
Number
Average Value
Number
Average Value
LOANS ORIGINATED
1
$116,340
17
$147,886
17
$132,578
2
$25,045
3
$158,130
2
$60,095
APPLICATIONS APPROVED, NOT ACCEPTED
0
$0
2
$95,440
3
$96,280
0
$0
0
$0
2
$45,350
APPLICATIONS DENIED
0
$0
4
$72,138
8
$94,236
2
$73,580
1
$38,830
2
$62,690
APPLICATIONS WITHDRAWN
0
$0
2
$60,170
10
$118,960
1
$37,940
0
$0
1
$53,500
FILES CLOSED FOR INCOMPLETENESS
0
$0
0
$0
1
$164,950
0
$0
0
$0
0
$0
Aggregated Statistics For Year 2004 (Based on 2 partial tracts)
A) FHA, FSA/RHS & VA Home Purchase Loans
B) Conventional Home Purchase Loans
C) Refinancings
D) Home Improvement Loans
F) Non-occupant Loans on < 5 Family Dwellings (A B C & D)
G) Loans On Manufactured Home Dwelling (A B C & D)
Number
Average Value
Number
Average Value
Number
Average Value
Number
Average Value
Number
Average Value
Number
Average Value
LOANS ORIGINATED
1
$89,660
14
$134,036
15
$101,458
2
$33,940
2
$175,545
2
$52,760
APPLICATIONS APPROVED, NOT ACCEPTED
0
$0
3
$78,447
3
$93,317
0
$0
0
$0
2
$58,985
APPLICATIONS DENIED
0
$0
4
$63,282
9
$91,143
1
$32,010
0
$0
4
$49,202
APPLICATIONS WITHDRAWN
0
$0
1
$125,230
7
$97,537
0
$0
0
$0
1
$72,770
FILES CLOSED FOR INCOMPLETENESS
0
$0
0
$0
1
$127,300
0
$0
0
$0
0
$0
Aggregated Statistics For Year 2003 (Based on 2 partial tracts)
A) FHA, FSA/RHS & VA Home Purchase Loans
B) Conventional Home Purchase Loans
C) Refinancings
D) Home Improvement Loans
F) Non-occupant Loans on < 5 Family Dwellings (A B C & D)
Number
Average Value
Number
Average Value
Number
Average Value
Number
Average Value
Number
Average Value
LOANS ORIGINATED
2
$100,035
20
$84,140
33
$110,476
3
$40,953
3
$95,293
APPLICATIONS APPROVED, NOT ACCEPTED
0
$0
9
$62,112
6
$115,967
0
$0
1
$55,720
APPLICATIONS DENIED
1
$44,160
23
$44,202
11
$95,589
1
$11,860
1
$51,570
APPLICATIONS WITHDRAWN
0
$0
2
$93,735
5
$125,436
0
$0
0
$0
FILES CLOSED FOR INCOMPLETENESS
0
$0
0
$0
1
$112,780
0
$0
0
$0
Aggregated Statistics For Year 2002 (Based on 2 partial tracts)
A) FHA, FSA/RHS & VA Home Purchase Loans
B) Conventional Home Purchase Loans
C) Refinancings
D) Home Improvement Loans
F) Non-occupant Loans on < 5 Family Dwellings (A B C & D)
Number
Average Value
Number
Average Value
Number
Average Value
Number
Average Value
Number
Average Value
LOANS ORIGINATED
1
$152,650
10
$110,572
20
$108,356
3
$16,053
3
$63,823
APPLICATIONS APPROVED, NOT ACCEPTED
0
$0
1
$109,820
4
$79,175
0
$0
0
$0
APPLICATIONS DENIED
0
$0
1
$101,370
7
$84,813
2
$9,855
0
$0
APPLICATIONS WITHDRAWN
0
$0
1
$70,390
4
$86,362
0
$0
0
$0
FILES CLOSED FOR INCOMPLETENESS
0
$0
0
$0
1
$50,240
0
$0
0
$0
Aggregated Statistics For Year 2001 (Based on 2 partial tracts)
A) FHA, FSA/RHS & VA Home Purchase Loans
B) Conventional Home Purchase Loans
C) Refinancings
D) Home Improvement Loans
F) Non-occupant Loans on < 5 Family Dwellings (A B C & D)
Number
Average Value
Number
Average Value
Number
Average Value
Number
Average Value
Number
Average Value
LOANS ORIGINATED
1
$127,750
9
$89,859
22
$89,742
3
$31,467
2
$69,285
APPLICATIONS APPROVED, NOT ACCEPTED
0
$0
3
$76,767
4
$83,695
1
$19,270
0
$0
APPLICATIONS DENIED
0
$0
4
$40,645
9
$82,514
1
$11,710
0
$0
APPLICATIONS WITHDRAWN
0
$0
0
$0
4
$83,622
0
$0
0
$0
FILES CLOSED FOR INCOMPLETENESS
0
$0
0
$0
1
$80,770
0
$0
0
$0
Aggregated Statistics For Year 2000 (Based on 2 partial tracts)
A) FHA, FSA/RHS & VA Home Purchase Loans
B) Conventional Home Purchase Loans
C) Refinancings
D) Home Improvement Loans
F) Non-occupant Loans on < 5 Family Dwellings (A B C & D)
Number
Average Value
Number
Average Value
Number
Average Value
Number
Average Value
Number
Average Value
LOANS ORIGINATED
1
$130,420
10
$92,521
10
$85,778
2
$15,040
1
$74,100
APPLICATIONS APPROVED, NOT ACCEPTED
0
$0
4
$53,685
3
$76,323
1
$39,270
0
$0
APPLICATIONS DENIED
0
$0
7
$55,701
6
$77,188
1
$42,680
0
$0
APPLICATIONS WITHDRAWN
0
$0
1
$46,680
4
$75,212
0
$0
0
$0
FILES CLOSED FOR INCOMPLETENESS
0
$0
0
$0
1
$58,690
0
$0
0
$0
Aggregated Statistics For Year 1999 (Based on 1 partial tract)
A) FHA, FSA/RHS & VA Home Purchase Loans
B) Conventional Home Purchase Loans
C) Refinancings
D) Home Improvement Loans
F) Non-occupant Loans on < 5 Family Dwellings (A B C & D)


 Nearest zip codes: 37705, 37754, 37769, 37757, 37849, 37716.


