Estimated zip code population in 2022: 2,299 Zip code population in 2010: 2,037 Zip code population in 2000: 1,709
Houses and condos: 844 Renter-occupied apartments: 84
% of renters here:
12%
State:
33%
March 2022 cost of living index in zip code 37726: 76.9 (low, U.S. average is 100)
Land area: 97.7 sq. mi. Water area: 0.0 sq. mi.
Population density: 24 people per square mile
(very low).
OSM Map
General Map
Google Map
MSN Map
OSM Map
General Map
Google Map
MSN Map
OSM Map
General Map
Google Map
MSN Map
OSM Map
General Map
Google Map
MSN Map
Please wait while loading the map...
Real estate property taxes paid for housing units in 2022:
This zip code:
0.4% ($534)
Tennessee:
0.5% ($1,376)
Median real estate property taxes paid for housing units with mortgages in 2022: $815 (0.3%) Median real estate property taxes paid for housing units with no mortgage in 2022: $455 (0.5%)
Business Search- 14 Million verified businesses
Males: 1,261
(54.9%)
Females: 1,038
(45.1%)
For population 25 years and over in 37726:
High school or higher: 76.2%
Bachelor's degree or higher: 10.5%
Graduate or professional degree: 3.9%
Mean travel time to work (commute): 39.3 minutes
For population 15 years and over in 37726:
Never married: 25.2%
Now married: 56.9%
Separated: 0.4%
Widowed: 13.0%
Divorced: 4.6%
Zip code 37726 compared to state average:
Median house value below state average.
Unemployed percentage significantly below state average.
Black race population percentage significantly below state average.
Hispanic race population percentage significantly below state average.
Foreign-born population percentage significantly below state average.
Renting percentage significantly below state average.
Length of stay since moving in below state average.
House age significantly below state average.
Number of college students significantly below state average.
Percentage of population with a bachelor's degree or higher significantly below state average.
Estimated median house/condo value in 2022: $142,829
37726:
$142,829
Tennessee:
$284,800
According to our research of Tennessee and other state lists, there were 6 registered sex offenders living in 37726 zip code as of May 28, 2024. The ratio of all residents to sex offenders in zip code 37726 is 279 to 1. The ratio of registered sex offenders to all residents in this zip code is near the state average.
Median resident age:
This zip code:
36.0 years
Tennessee median age:
39.2 years
Average household size:
This zip code:
3.3 people
Tennessee:
2.4 people
Averages for the 2020 tax year for zip code 37726, filed in 2021:
Average Adjusted Gross Income (AGI) in 2020: $41,658 (Individual Income Tax Returns)
Here:
$41,658
State:
$69,014
Salary/wage: $37,819 (reported on 71.6% of returns)
Here:
$37,819
State:
$55,872
(% of AGI for various income ranges: 1091.7% for AGIs below $25k, 3312.0% for AGIs $25k-50k, 5770.0% for AGIs $50k-75k, 7027.5% for AGIs $75k-100k, 16763.3% for AGIs $100k-200k)
Taxable interest for individuals: $618 (reported on 23.0% of returns)
This zip code:
$618
Tennessee:
$1,945
(% of AGI for various income ranges: 6.2% for AGIs below $25k, 11.3% for AGIs $25k-50k, 22.5% for AGIs $50k-75k, 183.3% for AGIs $100k-200k)
Ordinary dividends: $1,900 (reported on 4.1% of returns)
Here:
$1,900
State:
$8,105
(% of AGI for various income ranges: 38.0% for AGIs $25k-50k)
Net capital gain/loss in AGI: +$2,825 (reported on 5.4% of returns)
Here:
+$2,825
State:
+$33,664
(% of AGI for various income ranges: 141.2% for AGIs $50k-75k)
Profit/loss from business: +$15,919 (reported on 21.6% of returns)
Here:
+$15,919
State:
+$18,991
(% of AGI for various income ranges: 232.5% for AGIs below $25k, 550.7% for AGIs $25k-50k, 1453.8% for AGIs $50k-75k)
Taxable individual retirement arrangement distribution: $12,150 (reported on 5.4% of returns)
37726:
$12,150
Tennessee:
$20,036
(% of AGI for various income ranges: 324.0% for AGIs $25k-50k)
Earned income credit: $2,663 (reported on 25.7% of returns)
Here:
$2,663
State:
$2,391
(% of AGI for various income ranges: 143.3% for AGIs below $25k, 108.0% for AGIs $25k-50k)
Percentage of individuals using paid preparers for their 2020 taxes: 97.3%
Here:
97%
State:
93%
(% for various income ranges: 97.0% for AGIs below $25k, 100.0% for AGIs $25k-50k, 90.9% for AGIs $50k-75k, 100.0% for AGIs $75k-100k, 100.0% for AGIs $100k-200k)
Averages for the 2012 tax year for zip code 37726, filed in 2013:
Average Adjusted Gross Income (AGI) in 2012: $32,575 (Individual Income Tax Returns)
Here:
$32,575
State:
$53,767
Salary/wage: $30,830 (reported on 73.4% of returns)
Here:
$30,830
State:
$45,421
(% of AGI for various income ranges: 65.6% for AGIs below $25k, 73.1% for AGIs $25k-50k, 74.4% for AGIs $50k-75k, 64.7% for AGIs $75k-100k)
Taxable interest for individuals: $793 (reported on 23.4% of returns)
This zip code:
$793
Tennessee:
$1,732
(% of AGI for various income ranges: 1.4% for AGIs below $25k, 0.5% for AGIs $25k-50k, 0.3% for AGIs $50k-75k, 0.2% for AGIs $75k-100k)
Ordinary dividends: $533 (reported on 4.7% of returns)
Here:
$533
State:
$6,739
Net capital gain/loss in AGI: +$1,325 (reported on 6.2% of returns)
Here:
+$1,325
State:
+$19,082
Profit/loss from business: +$10,780 (reported on 23.4% of returns)
Here:
+$10,780
State:
+$15,240
(% of AGI for various income ranges: 18.7% for AGIs below $25k, 8.7% for AGIs $25k-50k, 5.9% for AGIs $50k-75k)
Taxable individual retirement arrangement distribution: $9,067 (reported on 4.7% of returns)
37726:
$9,067
Tennessee:
$15,505
Total itemized deductions: $19,600 (29% of AGI, reported on 10.9% of returns)
Here:
$19,600
State:
$21,976
Here:
29.4% of AGI
State:
17.8% of AGI
(% of AGI for various income ranges: 8.2% for AGIs $25k-50k, 8.7% for AGIs $50k-75k, 8.2% for AGIs $75k-100k)
Charity contributions: $4,560 (reported on 7.8% of returns)
Here:
$4,560
State:
$6,709
Taxes paid: $3,029 (reported on 10.9% of returns)
37726:
$3,029
State:
$4,829
(% of AGI for various income ranges: 1.0% for AGIs $25k-50k, 1.3% for AGIs $50k-75k, 1.5% for AGIs $75k-100k)
Earned income credit: $2,535 (reported on 31.2% of returns)
Here:
$2,535
State:
$2,404
(% of AGI for various income ranges: 9.2% for AGIs below $25k, 1.8% for AGIs $25k-50k)
Percentage of individuals using paid preparers for their 2012 taxes: 68.8%
Here:
69%
State:
52%
(% for various income ranges: 64.7% for AGIs below $25k, 75.0% for AGIs $25k-50k, 75.0% for AGIs $50k-75k, 66.7% for AGIs $75k-100k)
Averages for the 2004 tax year for zip code 37726, filed in 2005:
Average Adjusted Gross Income (AGI) in 2004: $26,775 (Individual Income Tax Returns)
Here:
$26,775
State:
$44,088
Salary/wage: $25,311 (reported on 78.9% of returns)
Here:
$25,311
State:
$38,825
(% of AGI for various income ranges: 68.6% for AGIs below $10k, 79.0% for AGIs $10k-25k, 78.1% for AGIs $25k-50k, 78.9% for AGIs $50k-75k, 139.7% for AGIs $75k-100k)
Taxable interest for individuals: $732 (reported on 31.7% of returns)
This zip code:
$732
Tennessee:
$1,802
(% of AGI for various income ranges: 1.5% for AGIs below $10k, 1.8% for AGIs $10k-25k, 0.4% for AGIs $25k-50k, 0.8% for AGIs $50k-75k, 1.2% for AGIs $75k-100k)
Taxable dividends: $290 (reported on 5.1% of returns)
Here:
$290
State:
$3,727
Net capital gain/loss: +$393 (reported on 4.6% of returns)
Here:
+$393
State:
+$15,776
Profit/loss from business: +$7,196 (reported on 22.5% of returns)
Here:
+$7,196
State:
+$12,882
(% of AGI for various income ranges: 32.2% for AGIs below $10k, 10.1% for AGIs $10k-25k, 7.6% for AGIs $25k-50k, -0.3% for AGIs $50k-75k)
Total itemized deductions: $14,784 (28% of AGI, reported on 12.1% of returns)
Here:
$14,784
State:
$18,035
Here:
27.8% of AGI
State:
19.9% of AGI
(% of AGI for various income ranges: 4.7% for AGIs $10k-25k, 7.8% for AGIs $25k-50k, 7.0% for AGIs $50k-75k, 18.6% for AGIs $75k-100k)
Charity contributions deductions: $3,920 (7% of AGI, reported on 8.2% of returns)
Here:
$3,920
State:
$5,167
Here:
7.0% of AGI
State:
5.3% of AGI
Total tax: $2,943 (reported on 66.0% of returns)
37726:
$2,943
State:
$7,482
(% of AGI for various income ranges: 4.4% for AGIs below $10k, 4.2% for AGIs $10k-25k, 6.8% for AGIs $25k-50k, 8.0% for AGIs $50k-75k, 10.6% for AGIs $75k-100k, 12.5% for AGIs over 100k)
Earned income credit: $1,746 (reported on 28.3% of returns)
Here:
$1,746
State:
$1,826
Percentage of individuals using paid preparers for their 2004 taxes: 69.0%
Here:
69%
State:
60%
(% for various income ranges: 63.1% for AGIs below $10k, 72.3% for AGIs $10k-25k, 70.6% for AGIs $25k-50k, 66.0% for AGIs $50k-75k, 118.8% for AGIs $75k-100k)
Household received Food Stamps/SNAP in the past 12 months: 74 Household did not receive Food Stamps/SNAP in the past 12 months: 629
Women who had a birth in the past 12 months: 23 (24 now married, 0 unmarried) Women who did not have a birth in the past 12 months: 329 (186 now married, 143 unmarried)
Housing units in zip code 37726 with a mortgage: 264 (10 second mortgage, 10 both second mortgage and home equity loan) Houses without a mortgage: 14
Median monthly owner costs for units with a mortgage: $1,222 Median monthly owner costs for units without a mortgage: $312
Residents with income below the poverty level in 2022:
This zip code:
21.0%
Whole state:
13.3%
Residents with income below 50% of the poverty level in 2022:
This zip code:
12.1%
Whole state:
7.1%
Median number of rooms in houses and condos:
Here:
5.8
State:
6.5
Median number of rooms in apartments:
Here:
6.8
State:
4.4
Notable locations in this zip code not listed on our city pages
Notable locations in zip code 37726: Twin Bridges (A), Clarence B Lane Memorial Park and Firehall / Chestnut Ridge Volunteer Fire Department (B), Deer Lodge Volunteer Fire Department (C). Display/hide their locations on the map
Churches in zip code 37726 include: Deer Lodge First Baptist Church (A), Flat Rock Church (B), D O Beaty Church (C), Pleasant Green Church (D), Pine Grove Church (E), Shadeland Church (F), Greenwood Chapel (G), Adams Hill Church (H), Friends Chapel (I). Display/hide their locations on the map
Cemeteries: Jones Cemetery (1), Westfelt Cemetery (2), Hall Cemetery (3), Neil Cemetery (4), Meister Hill Cemetery (5), Friends Chapel Cemetery (6), Flat Rock Cemetery (7). Display/hide their locations on the map
Reservoirs: Gene Rogers Lake (A), Land of Lakes Catfish Farm Lake (B), S Thomas Burnett Lake Number Two (C), Burnett Lake (D). Display/hide their locations on the map
Streams, rivers, and creeks: Luke Hall Mill Branch (A), Lovetts Branch (B), Little Creek (C), Bice Creek (D), Alice Creek (E), Witt Creek (F), White Creek (G), Hurricane Creek (H), Horse Creek (I). Display/hide their locations on the map
In group quarters: 13 (-1 institutionalized population)
Size of family households: 203 2-persons, 141 3-persons, 79 4-persons, 52 5-persons, 76 7-or-more-persons
Size of nonfamily households: 131 1-person, 22 2-persons
452 married couples with children.
84 single-parent households (84 women).
83.9% of residents of 37726 zip code speak English at home.
0.6% of residents speak Spanish at home (8% very well, 92% well).
15.5% of residents speak other Indo-European language at home (100% very well).
Foreign born population: 17 (0.8%) (40.8% of them are naturalized citizens)
This zip code:
0.8%
Whole state:
5.6%
100%Sweden
47%United Kingdom, excluding England and Scotland
6%Dominica
33%Pennsylvania German
23%American
13%German
12%Irish
7%English
3%European
3%Italian
Year of entry for the foreign-born population
12010 or later
92000 to 2009
01990 to 1999
6Before 1990
Housing units lacking complete plumbing facilities: 5.2% Housing units lacking complete kitchen facilities: 8.3%
52.6%Utility gas
21.3%Electricity
19.8%Wood
4.6%Bottled, tank, or LP gas
2.1%Fuel oil, kerosene, etc.
Population in 1990: 538. Population change in the 1990s: +1,171 (+217.7%).
Place of birth for U.S.-born residents:
This state: 1,295
Northeast: 484
Midwest: 324
South: 147
West: 38
68% of the 37726 zip code residents lived in the same house 5 years ago. Out of people who lived in different houses, 31% lived in this county. Out of people who lived in different counties, 50% lived in Tennessee.
91% of the 37726 zip code residents lived in the same house 1 year ago. Out of people who lived in different houses, 83% moved from this county. Out of people who lived in different houses, 11% moved from different county within same state.
Private vs. public school enrollment:
Students in private schools in grades 1 to 8 (elementary and middle school): 110
Here:
35.4%
Tennessee:
15.0%
Students in private schools in grades 9 to 12 (high school): 20
Here:
19.8%
Tennessee:
16.2%
Students in private undergraduate colleges:
Here:
0.0%
Tennessee:
23.5%
Occupation by median earnings in the past 12 months ($)
75,487Construction and extraction occupations
56,281Installation, maintenance, and repair occupations
34,922Management occupations
18,796Office and administrative support occupations
17,631Sales and related occupations
8,965Education, training, and library occupations
Top industries in this zip code by the number of employees in 2005:
Health Care and Social Assistance: Other Residential Care Facilities (20-49 employees: 1 establishment)
Construction: New Single-Family Housing Construction (except Operative Builders) (10-19: 1)
Other Services (except Public Administration): Automotive Body, Paint, and Interior Repair and Maintenance (1-4: 2)
Health Care and Social Assistance: Community Food Services (1-4: 1)
Other Services (except Public Administration): Religious Organizations (1-4: 1)
Health Care and Social Assistance: All Other Outpatient Care Centers (1-4: 1)
People in group quarters in 2010:
8 people in residential treatment centers for juveniles (non-correctional)
5 people in workers' group living quarters and job corps centers
People in group quarters in 2000:
53 people in training schools for juvenile delinquents
Fatal accident statistics in 2010:
Fatal accident count: 1
Vehicles involved in fatal accidents: 2
Fatal accidents caused by drunken drivers: 0
Fatalities: 1
Persons involved in fatal accidents: 4
Pedestrians involved in fatal accidents: 0
2003 - 2018 National Fire Incident Reporting System (NFIRS) incidents
Based on the data from the years 2003 - 2018 the average number of fires per year is 28. The highest number of fires - 53 took place in 2007, and the least - 7 in 2013. The data has an increasing trend.
When looking into fire subcategories, the most incidents belonged to: Outside Fires (51.7%), and Structure Fires (38.2%).
Fire incident types reported to NFIRS in Zip Code 37726

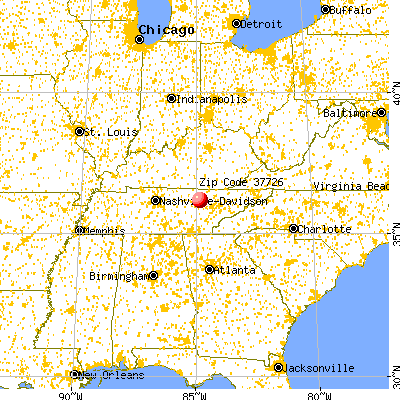


 Nearest zip codes: 37770, 38553, 38565, 37733, 37872, 38558.


 Based on the data from the years 2003 - 2018 the average number of fires per year is 28. The highest number of fires - 53 took place in 2007, and the least - 7 in 2013. The data has an increasing trend.
 When looking into fire subcategories, the most incidents belonged to: Outside Fires (51.7%), and Structure Fires (38.2%).