Estimated zip code population in 2022: 2,743 Zip code population in 2010: 2,312 Zip code population in 2000: 2,147
Houses and condos: 1,127 Renter-occupied apartments: 261
% of renters here:
24%
State:
33%
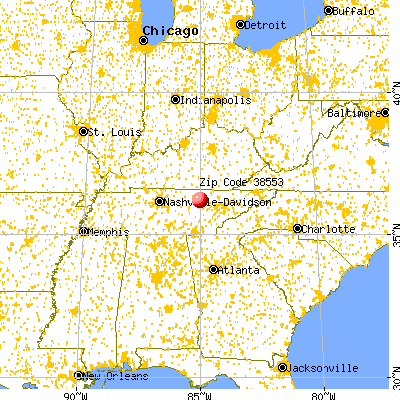
March 2022 cost of living index in zip code 38553: 80.0 (low, U.S. average is 100)
Land area: 47.9 sq. mi. Water area: 0.0 sq. mi.
Population density: 57 people per square mile
(very low).
OSM Map
General Map
Google Map
MSN Map
OSM Map
General Map
Google Map
MSN Map
OSM Map
General Map
Google Map
MSN Map
OSM Map
General Map
Google Map
MSN Map
Please wait while loading the map...
Real estate property taxes paid for housing units in 2022:
This zip code:
0.3% ($596)
Tennessee:
0.5% ($1,376)
Median real estate property taxes paid for housing units with mortgages in 2022: $660 (0.4%) Median real estate property taxes paid for housing units with no mortgage in 2022: $568 (0.2%)
Business Search- 14 Million verified businesses
Males: 1,507
(55.0%)
Females: 1,235
(45.0%)
For population 25 years and over in 38553:
High school or higher: 81.4%
Bachelor's degree or higher: 36.9%
Graduate or professional degree: 4.9%
Mean travel time to work (commute): 26.6 minutes
For population 15 years and over in 38553:
Never married: 27.3%
Now married: 49.7%
Separated: 3.5%
Widowed: 8.1%
Divorced: 11.3%
Zip code 38553 compared to state average:
Unemployed percentage significantly below state average.
Black race population percentage significantly below state average.
Hispanic race population percentage significantly below state average.
Foreign-born population percentage significantly below state average.
Length of stay since moving in significantly above state average.
Averages for the 2020 tax year for zip code 38553, filed in 2021:
Average Adjusted Gross Income (AGI) in 2020: $45,117 (Individual Income Tax Returns)
Here:
$45,117
State:
$69,014
Salary/wage: $40,788 (reported on 71.3% of returns)
Here:
$40,788
State:
$55,872
(% of AGI for various income ranges: 1004.8% for AGIs below $25k, 3169.2% for AGIs $25k-50k, 5722.3% for AGIs $50k-75k, 9980.0% for AGIs $75k-100k, 20352.5% for AGIs $100k-200k)
Taxable interest for individuals: $569 (reported on 26.9% of returns)
This zip code:
$569
Tennessee:
$1,945
(% of AGI for various income ranges: 23.8% for AGIs below $25k, 6.0% for AGIs $25k-50k, 26.9% for AGIs $50k-75k, 8.0% for AGIs $75k-100k, 105.0% for AGIs $100k-200k)
Ordinary dividends: $1,456 (reported on 8.3% of returns)
Here:
$1,456
State:
$8,105
(% of AGI for various income ranges: 11.7% for AGIs below $25k, 24.0% for AGIs $25k-50k, 92.5% for AGIs $100k-200k)
Net capital gain/loss in AGI: +$7,610 (reported on 9.3% of returns)
Here:
+$7,610
State:
+$33,664
(% of AGI for various income ranges: 8.3% for AGIs below $25k, 12.4% for AGIs $25k-50k, 66.2% for AGIs $50k-75k, 1550.0% for AGIs $100k-200k)
Profit/loss from business: +$16,762 (reported on 22.2% of returns)
Here:
+$16,762
State:
+$18,991
(% of AGI for various income ranges: 426.2% for AGIs below $25k, 390.0% for AGIs $25k-50k, 775.4% for AGIs $50k-75k, 2010.0% for AGIs $100k-200k)
Taxable individual retirement arrangement distribution: $13,357 (reported on 6.5% of returns)
38553:
$13,357
Tennessee:
$20,036
(% of AGI for various income ranges: 53.4% for AGIs below $25k, 92.8% for AGIs $25k-50k, 421.5% for AGIs $50k-75k)
Earned income credit: $2,564 (reported on 23.1% of returns)
Here:
$2,564
State:
$2,391
(% of AGI for various income ranges: 139.3% for AGIs below $25k, 94.8% for AGIs $25k-50k)
Percentage of individuals using paid preparers for their 2020 taxes: 94.4%
Here:
94%
State:
93%
(% for various income ranges: 95.3% for AGIs below $25k, 93.5% for AGIs $25k-50k, 94.1% for AGIs $50k-75k, 87.5% for AGIs $75k-100k, 100.0% for AGIs $100k-200k)
Averages for the 2012 tax year for zip code 38553, filed in 2013:
Average Adjusted Gross Income (AGI) in 2012: $32,648 (Individual Income Tax Returns)
Here:
$32,648
State:
$53,767
Salary/wage: $30,745 (reported on 77.4% of returns)
Here:
$30,745
State:
$45,421
(% of AGI for various income ranges: 68.3% for AGIs below $25k, 76.5% for AGIs $25k-50k, 78.0% for AGIs $50k-75k, 122.6% for AGIs $75k-100k)
Taxable interest for individuals: $820 (reported on 23.8% of returns)
This zip code:
$820
Tennessee:
$1,732
(% of AGI for various income ranges: 2.0% for AGIs below $25k, 0.2% for AGIs $25k-50k, 0.4% for AGIs $50k-75k, 0.5% for AGIs $75k-100k)
Ordinary dividends: $1,017 (reported on 7.1% of returns)
Here:
$1,017
State:
$6,739
Net capital gain/loss in AGI: +$2,800 (reported on 6.0% of returns)
Here:
+$2,800
State:
+$19,082
Profit/loss from business: +$11,553 (reported on 22.6% of returns)
Here:
+$11,553
State:
+$15,240
(% of AGI for various income ranges: 16.2% for AGIs below $25k, 9.5% for AGIs $25k-50k, 8.3% for AGIs $50k-75k)
Taxable individual retirement arrangement distribution: $11,700 (reported on 4.8% of returns)
38553:
$11,700
Tennessee:
$15,505
Total itemized deductions: $16,858 (28% of AGI, reported on 14.3% of returns)
Here:
$16,858
State:
$21,976
Here:
27.9% of AGI
State:
17.8% of AGI
(% of AGI for various income ranges: 9.4% for AGIs $25k-50k, 6.2% for AGIs $50k-75k, 21.0% for AGIs $75k-100k)
Charity contributions: $4,233 (reported on 10.7% of returns)
Here:
$4,233
State:
$6,709
(% of AGI for various income ranges: 1.5% for AGIs $25k-50k, 1.7% for AGIs $50k-75k, 3.7% for AGIs $75k-100k)
Taxes paid: $2,727 (reported on 13.1% of returns)
38553:
$2,727
State:
$4,829
(% of AGI for various income ranges: 1.1% for AGIs $25k-50k, 1.1% for AGIs $50k-75k, 3.4% for AGIs $75k-100k)
Earned income credit: $2,546 (reported on 31.0% of returns)
Here:
$2,546
State:
$2,404
(% of AGI for various income ranges: 9.0% for AGIs below $25k, 2.3% for AGIs $25k-50k)
Percentage of individuals using paid preparers for their 2012 taxes: 65.5%
Here:
65%
State:
52%
(% for various income ranges: 61.9% for AGIs below $25k, 62.5% for AGIs $25k-50k, 72.7% for AGIs $50k-75k, 80.0% for AGIs $75k-100k, 100.0% for AGIs $100k-200k)
Averages for the 2004 tax year for zip code 38553, filed in 2005:
Average Adjusted Gross Income (AGI) in 2004: $27,242 (Individual Income Tax Returns)
Here:
$27,242
State:
$44,088
Salary/wage: $26,593 (reported on 76.5% of returns)
Here:
$26,593
State:
$38,825
(% of AGI for various income ranges: 70.9% for AGIs below $10k, 69.0% for AGIs $10k-25k, 80.0% for AGIs $25k-50k, 84.0% for AGIs $50k-75k, 73.1% for AGIs $75k-100k, 47.1% for AGIs over 100k)
Taxable interest for individuals: $768 (reported on 31.2% of returns)
This zip code:
$768
Tennessee:
$1,802
(% of AGI for various income ranges: 5.0% for AGIs below $10k, 1.9% for AGIs $10k-25k, 0.6% for AGIs $25k-50k, 0.2% for AGIs $50k-75k, 0.1% for AGIs $75k-100k, 0.2% for AGIs over 100k)
Taxable dividends: $439 (reported on 6.9% of returns)
Here:
$439
State:
$3,727
Net capital gain/loss: +$5,102 (reported on 7.1% of returns)
Here:
+$5,102
State:
+$15,776
(% of AGI for various income ranges: 0.4% for AGIs $10k-25k, 1.5% for AGIs $25k-50k, 0.9% for AGIs $50k-75k, 5.4% for AGIs $75k-100k)
Profit/loss from business: +$9,460 (reported on 25.9% of returns)
Here:
+$9,460
State:
+$12,882
(% of AGI for various income ranges: 30.2% for AGIs below $10k, 14.1% for AGIs $10k-25k, 7.5% for AGIs $25k-50k, 10.6% for AGIs $50k-75k)
Total itemized deductions: $12,935 (25% of AGI, reported on 9.3% of returns)
Here:
$12,935
State:
$18,035
Here:
25.1% of AGI
State:
19.9% of AGI
(% of AGI for various income ranges: 2.4% for AGIs $10k-25k, 5.1% for AGIs $25k-50k, 5.4% for AGIs $50k-75k, 9.6% for AGIs $75k-100k)
Charity contributions deductions: $2,667 (5% of AGI, reported on 6.5% of returns)
Here:
$2,667
State:
$5,167
Here:
5.4% of AGI
State:
5.3% of AGI
Total tax: $3,017 (reported on 71.4% of returns)
38553:
$3,017
State:
$7,482
(% of AGI for various income ranges: 6.2% for AGIs below $10k, 4.5% for AGIs $10k-25k, 6.2% for AGIs $25k-50k, 8.4% for AGIs $50k-75k, 11.2% for AGIs $75k-100k, 19.2% for AGIs over 100k)
Earned income credit: $1,910 (reported on 29.5% of returns)
Here:
$1,910
State:
$1,826
Percentage of individuals using paid preparers for their 2004 taxes: 70.9%
Here:
71%
State:
60%
(% for various income ranges: 65.5% for AGIs below $10k, 70.8% for AGIs $10k-25k, 70.0% for AGIs $25k-50k, 78.5% for AGIs $50k-75k, 88.0% for AGIs $75k-100k, 92.3% for AGIs over 100k)
Household received Food Stamps/SNAP in the past 12 months: 207 Household did not receive Food Stamps/SNAP in the past 12 months: 893
Women who did not have a birth in the past 12 months: 586 (356 now married, 230 unmarried)
Housing units in zip code 38553 with a mortgage: 344 (13 second mortgage) Median monthly owner costs for units with a mortgage: $945 Median monthly owner costs for units without a mortgage: $344
Residents with income below the poverty level in 2022:
This zip code:
10.3%
Whole state:
13.3%
Residents with income below 50% of the poverty level in 2022:
This zip code:
5.8%
Whole state:
7.1%
Median number of rooms in houses and condos:
Here:
5.4
State:
6.5
Median number of rooms in apartments:
Here:
3.6
State:
4.4
Notable locations in this zip code not listed on our city pages
Churches in zip code 38553 include: Clarkrange Baptist Church (A), Clarkrange United Methodist Church (B), Mount Union Church (C), Clarkrange Church (D). Display/hide their locations on the map
Streams, rivers, and creeks: Johnson Mill Branch (A), Hurricane Creek (B), Guffy Branch (C), Glade Branch (D), Galer Branch (E), Shepherd Branch (F), Shoal Creek (G), Big Branch (H), Cooper Branch (I). Display/hide their locations on the map
In group quarters: 1 (-1 institutionalized population)
Size of family households: 332 2-persons, 230 3-persons, 105 4-persons, 59 5-persons, 26 6-persons, 13 7-or-more-persons
Size of nonfamily households: 334 1-person
268 married couples with children.
229 single-parent households (127 men, 102 women).
99.8% of residents of 38553 zip code speak English at home.
Foreign born population: 0 (0.0%)
:
0.0%
Whole state:
5.6%
25%English
22%American
10%German
7%French
4%Swiss
3%Irish
3%Scotch-Irish
Facilities with environmental interests located in this zip code:
CLARKRANGE ELEMENTARY SCHOOL (1026 W ROCK QUARRY RD in CLARKRANGE, TN)
(Geographic Names Information System) (National Center for Education Statistics) - STATE ID-0020 Organizations: FENTRESS COUNTY SCHOOL DISTRCT (SCHOOL DISTRICT)
CLARKRANGE HIGH SCHOOL (5801 S YORK HW in CLARKRANGE, TN)
(Geographic Names Information System) (National Center for Education Statistics) - STATE ID-0025 Organizations: FENTRESS COUNTY SCHOOL DISTRCT (SCHOOL DISTRICT)
45.2%Electricity
26.5%Bottled, tank, or LP gas
20.0%Utility gas
8.4%Wood
Population in 1990: 1,843. Population change in the 1990s: +304 (+16.5%).
Place of birth for U.S.-born residents:
This state: 1,906
Northeast: 226
Midwest: 297
South: 275
West: 18
63% of the 38553 zip code residents lived in the same house 5 years ago. Out of people who lived in different houses, 62% lived in this county. Out of people who lived in different counties, 50% lived in Tennessee.
86% of the 38553 zip code residents lived in the same house 1 year ago. Out of people who lived in different houses, 56% moved from this county. Out of people who lived in different houses, 31% moved from different county within same state. Out of people who lived in different houses, 8% moved from different state.
Private vs. public school enrollment:
Students in private schools in grades 1 to 8 (elementary and middle school): 149
Here:
40.2%
Tennessee:
15.0%
Students in private schools in grades 9 to 12 (high school): 2
Here:
5.1%
Tennessee:
16.2%
Students in private undergraduate colleges:
Here:
0.0%
Tennessee:
23.5%
Occupation by median earnings in the past 12 months ($)
50,076Construction and extraction occupations
42,679Production occupations
37,309Installation, maintenance, and repair occupations
21,095Management occupations
10,078Sales and related occupations
Companies with federal contracts located in this zip code:
INTL ASSOCIATION OF UNDERCOVER (984 KILBY RD in CLARKRANGE, TN; small business) : $203,250 in 5 contractsfrom 2004 to 2005
Contracts for Educational Services by Army Signed by year:2000: $0; 2001: $0; 2002: $0; 2003: $0; 2004: $96,750; 2005: $106,500; 2006: $0.
Biggest contracts:
$53,750 with Army for Educational Services. Taking place in IA. Signed on 2005-10-01. Completion date: 2005-09-30.
$53,750, same as above.Signed on 2004-11-14. Completion date: 2005-09-30.
$43,000, same as above.Signed on 2004-02-08. Completion date: 2004-07-23.
$35,250, same as above.Signed on 2005-11-29. Completion date: 2006-09-30.
Top industries in this zip code by the number of employees in 2005:
Finance and Insurance: Commercial Banking (5-9: 1, 1-4: 1)
Arts, Entertainment, and Recreation: Fitness and Recreational Sports Centers (5-9: 1)
Health Care and Social Assistance: Child Day Care Services (5-9: 1)
Fatal accident statistics in 2014:
Fatal accident count: 2
Vehicles involved in fatal accidents: 2
Fatal accidents caused by drunken drivers: 0
Fatalities: 2
Persons involved in fatal accidents: 2
Pedestrians involved in fatal accidents: 0
Fatal accident statistics in 2012:
Fatal accident count: 1
Vehicles involved in fatal accidents: 3
Fatal accidents caused by drunken drivers: 0
Fatalities: 1
Persons involved in fatal accidents: 9
Pedestrians involved in fatal accidents: 0
2003 - 2018 National Fire Incident Reporting System (NFIRS) incidents
According to the data from the years 2003 - 2018 the average number of fire incidents per year is 24. The highest number of fire incidents - 44 took place in 2008, and the least - 3 in 2013. The data has a decreasing trend.
When looking into fire subcategories, the most incidents belonged to: Structure Fires (40.8%), and Outside Fires (39.7%).
Fire incident types reported to NFIRS in Zip Code 38553


 Nearest zip codes: 38565, 38589, 38571, 38554, 37726, 38543.


 According to the data from the years 2003 - 2018 the average number of fire incidents per year is 24. The highest number of fire incidents - 44 took place in 2008, and the least - 3 in 2013. The data has a decreasing trend.
 When looking into fire subcategories, the most incidents belonged to: Structure Fires (40.8%), and Outside Fires (39.7%).