Estimated zip code population in 2022: 8,408 Zip code population in 2010: 8,340 Zip code population in 2000: 7,123
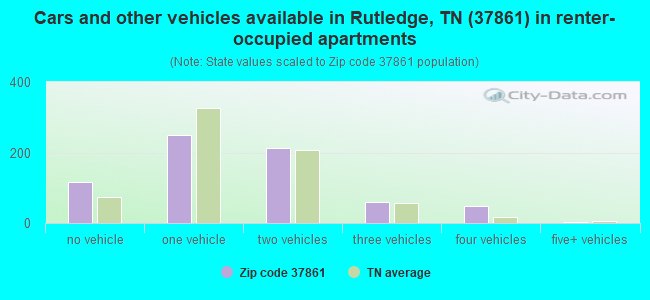
Houses and condos: 4,505 Renter-occupied apartments: 688
% of renters here:
19%
State:
33%
March 2022 cost of living index in zip code 37861: 79.1 (low, U.S. average is 100)
Land area: 99.9 sq. mi. Water area: 8.2 sq. mi.
Population density: 84 people per square mile
(very low).
OSM Map
General Map
Google Map
MSN Map
OSM Map
General Map
Google Map
MSN Map
OSM Map
General Map
Google Map
MSN Map
OSM Map
General Map
Google Map
MSN Map
Please wait while loading the map...
Real estate property taxes paid for housing units in 2022:
This zip code:
0.4% ($740)
Tennessee:
0.5% ($1,376)
Median real estate property taxes paid for housing units with mortgages in 2022: $969 (0.3%) Median real estate property taxes paid for housing units with no mortgage in 2022: $523 (0.5%)
Estimated median house/condo value in 2022: $194,120
37861:
$194,120
Tennessee:
$284,800
According to our research of Tennessee and other state lists, there were 23 registered sex offenders living in 37861 zip code as of May 28, 2024. The ratio of all residents to sex offenders in zip code 37861 is 385 to 1. The ratio of registered sex offenders to all residents in this zip code is near the state average.
Median resident age:
This zip code:
45.8 years
Tennessee median age:
39.2 years
Average household size:
This zip code:
2.3 people
Tennessee:
2.4 people
Averages for the 2020 tax year for zip code 37861, filed in 2021:
Average Adjusted Gross Income (AGI) in 2020: $50,210 (Individual Income Tax Returns)
Here:
$50,210
State:
$69,014
Salary/wage: $45,135 (reported on 79.0% of returns)
Here:
$45,135
State:
$55,872
(% of AGI for various income ranges: 1077.3% for AGIs below $25k, 3476.9% for AGIs $25k-50k, 6396.3% for AGIs $50k-75k, 9428.4% for AGIs $75k-100k, 13064.6% for AGIs $100k-200k)
Taxable interest for individuals: $1,085 (reported on 29.6% of returns)
This zip code:
$1,085
Tennessee:
$1,945
(% of AGI for various income ranges: 20.7% for AGIs below $25k, 27.6% for AGIs $25k-50k, 35.1% for AGIs $50k-75k, 54.8% for AGIs $75k-100k, 75.4% for AGIs $100k-200k)
Ordinary dividends: $3,774 (reported on 9.4% of returns)
Here:
$3,774
State:
$8,105
(% of AGI for various income ranges: 9.8% for AGIs below $25k, 16.9% for AGIs $25k-50k, 42.9% for AGIs $50k-75k, 69.6% for AGIs $75k-100k, 160.0% for AGIs $100k-200k)
Net capital gain/loss in AGI: +$8,972 (reported on 9.7% of returns)
Here:
+$8,972
State:
+$33,664
(% of AGI for various income ranges: 3.9% for AGIs below $25k, 41.4% for AGIs $25k-50k, 53.2% for AGIs $50k-75k, 143.6% for AGIs $75k-100k, 472.1% for AGIs $100k-200k)
Profit/loss from business: +$13,060 (reported on 15.6% of returns)
Here:
+$13,060
State:
+$18,991
(% of AGI for various income ranges: 173.6% for AGIs below $25k, 134.7% for AGIs $25k-50k, 273.4% for AGIs $50k-75k, 535.2% for AGIs $75k-100k, 895.0% for AGIs $100k-200k)
Taxable individual retirement arrangement distribution: $17,169 (reported on 7.0% of returns)
37861:
$17,169
Tennessee:
$20,036
(% of AGI for various income ranges: 41.7% for AGIs below $25k, 69.4% for AGIs $25k-50k, 144.9% for AGIs $50k-75k, 277.6% for AGIs $75k-100k, 895.0% for AGIs $100k-200k)
Total itemized deductions: $32,800 (reported on 1.9% of returns)
Here:
$32,800
State:
$40,136
(% of AGI for various income ranges: 95.4% for AGIs $25k-50k, 618.8% for AGIs $100k-200k)
Charity contributions: $9,617 (reported on 1.6% of returns)
Here:
$9,617
State:
$19,852
(% of AGI for various income ranges: 6.9% for AGIs below $25k, 210.4% for AGIs $100k-200k)
Taxes paid: $5,329 (reported on 1.9% of returns)
37861:
$5,329
State:
$6,038
(% of AGI for various income ranges: 11.2% for AGIs $25k-50k, 115.8% for AGIs $100k-200k)
Earned income credit: $2,371 (reported on 20.2% of returns)
Here:
$2,371
State:
$2,391
(% of AGI for various income ranges: 107.6% for AGIs below $25k, 76.2% for AGIs $25k-50k)
Percentage of individuals using paid preparers for their 2020 taxes: 94.3%
Here:
94%
State:
93%
(% for various income ranges: 94.1% for AGIs below $25k, 95.0% for AGIs $25k-50k, 92.7% for AGIs $50k-75k, 94.6% for AGIs $75k-100k, 94.3% for AGIs $100k-200k, 100.0% for AGIs over 200k)
Averages for the 2012 tax year for zip code 37861, filed in 2013:
Average Adjusted Gross Income (AGI) in 2012: $39,779 (Individual Income Tax Returns)
Here:
$39,779
State:
$53,767
Salary/wage: $36,271 (reported on 82.2% of returns)
Here:
$36,271
State:
$45,421
(% of AGI for various income ranges: 70.7% for AGIs below $25k, 83.0% for AGIs $25k-50k, 82.3% for AGIs $50k-75k, 76.4% for AGIs $75k-100k, 69.4% for AGIs $100k-200k, 51.7% for AGIs over 200k)
Taxable interest for individuals: $953 (reported on 32.1% of returns)
This zip code:
$953
Tennessee:
$1,732
(% of AGI for various income ranges: 1.4% for AGIs below $25k, 0.8% for AGIs $25k-50k, 0.6% for AGIs $50k-75k, 0.4% for AGIs $75k-100k, 0.6% for AGIs $100k-200k, 1.1% for AGIs over 200k)
Ordinary dividends: $3,087 (reported on 9.3% of returns)
Here:
$3,087
State:
$6,739
(% of AGI for various income ranges: 0.8% for AGIs below $25k, 0.4% for AGIs $25k-50k, 0.4% for AGIs $50k-75k, 0.3% for AGIs $75k-100k, 2.2% for AGIs $100k-200k)
Net capital gain/loss in AGI: +$3,045 (reported on 10.3% of returns)
Here:
+$3,045
State:
+$19,082
(% of AGI for various income ranges: 0.3% for AGIs $25k-50k, 0.3% for AGIs $50k-75k, 0.4% for AGIs $75k-100k, 3.7% for AGIs $100k-200k)
Profit/loss from business: +$9,883 (reported on 15.0% of returns)
Here:
+$9,883
State:
+$15,240
(% of AGI for various income ranges: 10.6% for AGIs below $25k, 2.4% for AGIs $25k-50k, 1.3% for AGIs $50k-75k, 2.5% for AGIs $75k-100k, 5.7% for AGIs $100k-200k)
Taxable individual retirement arrangement distribution: $11,742 (reported on 7.5% of returns)
37861:
$11,742
Tennessee:
$15,505
(% of AGI for various income ranges: 2.6% for AGIs below $25k, 1.4% for AGIs $25k-50k, 2.2% for AGIs $50k-75k, 3.3% for AGIs $75k-100k, 3.2% for AGIs $100k-200k)
Total itemized deductions: $18,744 (22% of AGI, reported on 14.0% of returns)
Here:
$18,744
State:
$21,976
Here:
21.9% of AGI
State:
17.8% of AGI
(% of AGI for various income ranges: 5.0% for AGIs below $25k, 6.0% for AGIs $25k-50k, 5.4% for AGIs $50k-75k, 7.3% for AGIs $75k-100k, 10.1% for AGIs $100k-200k, 6.2% for AGIs over 200k)
Charity contributions: $4,500 (reported on 9.7% of returns)
Here:
$4,500
State:
$6,709
(% of AGI for various income ranges: 0.3% for AGIs below $25k, 0.8% for AGIs $25k-50k, 0.7% for AGIs $50k-75k, 1.1% for AGIs $75k-100k, 3.4% for AGIs $100k-200k)
Taxes paid: $3,833 (reported on 13.4% of returns)
37861:
$3,833
State:
$4,829
(% of AGI for various income ranges: 0.6% for AGIs below $25k, 1.0% for AGIs $25k-50k, 0.9% for AGIs $50k-75k, 1.3% for AGIs $75k-100k, 2.1% for AGIs $100k-200k, 2.4% for AGIs over 200k)
Earned income credit: $2,326 (reported on 25.2% of returns)
Here:
$2,326
State:
$2,404
(% of AGI for various income ranges: 7.7% for AGIs below $25k, 1.5% for AGIs $25k-50k)
Percentage of individuals using paid preparers for their 2012 taxes: 65.7%
Here:
66%
State:
52%
(% for various income ranges: 62.7% for AGIs below $25k, 67.5% for AGIs $25k-50k, 67.4% for AGIs $50k-75k, 68.2% for AGIs $75k-100k, 70.6% for AGIs $100k-200k, 100.0% for AGIs over 200k)
Averages for the 2004 tax year for zip code 37861, filed in 2005:
Average Adjusted Gross Income (AGI) in 2004: $32,493 (Individual Income Tax Returns)
Here:
$32,493
State:
$44,088
Salary/wage: $30,780 (reported on 85.1% of returns)
Here:
$30,780
State:
$38,825
(% of AGI for various income ranges: 114.4% for AGIs below $10k, 78.5% for AGIs $10k-25k, 86.8% for AGIs $25k-50k, 86.3% for AGIs $50k-75k, 83.6% for AGIs $75k-100k, 48.9% for AGIs over 100k)
Taxable interest for individuals: $1,230 (reported on 39.6% of returns)
This zip code:
$1,230
Tennessee:
$1,802
(% of AGI for various income ranges: 7.9% for AGIs below $10k, 2.4% for AGIs $10k-25k, 0.9% for AGIs $25k-50k, 1.0% for AGIs $50k-75k, 0.7% for AGIs $75k-100k, 2.5% for AGIs over 100k)
Taxable dividends: $2,831 (reported on 9.1% of returns)
Here:
$2,831
State:
$3,727
(% of AGI for various income ranges: 0.9% for AGIs below $10k, 0.6% for AGIs $10k-25k, 0.4% for AGIs $25k-50k, 0.6% for AGIs $50k-75k, 0.3% for AGIs $75k-100k, 2.9% for AGIs over 100k)
Net capital gain/loss: +$10,328 (reported on 8.4% of returns)
Here:
+$10,328
State:
+$15,776
(% of AGI for various income ranges: 1.2% for AGIs below $10k, 0.3% for AGIs $10k-25k, 1.0% for AGIs $25k-50k, 0.8% for AGIs $50k-75k, 0.8% for AGIs $75k-100k, 15.0% for AGIs over 100k)
Profit/loss from business: +$6,813 (reported on 18.0% of returns)
Here:
+$6,813
State:
+$12,882
(% of AGI for various income ranges: 20.7% for AGIs below $10k, 6.3% for AGIs $10k-25k, 2.7% for AGIs $25k-50k, 1.8% for AGIs $50k-75k, 1.7% for AGIs $75k-100k, 6.4% for AGIs over 100k)
IRA payment deduction: $2,849 (reported on 1.8% of returns)
37861:
$2,849
Tennessee:
$2,934
(% of AGI for various income ranges: 0.1% for AGIs $10k-25k, 0.2% for AGIs $25k-50k, 0.2% for AGIs $50k-75k, 0.3% for AGIs $75k-100k)
Total itemized deductions: $15,589 (25% of AGI, reported on 12.2% of returns)
Here:
$15,589
State:
$18,035
Here:
25.2% of AGI
State:
19.9% of AGI
(% of AGI for various income ranges: 3.8% for AGIs $10k-25k, 4.8% for AGIs $25k-50k, 7.1% for AGIs $50k-75k, 8.2% for AGIs $75k-100k, 7.4% for AGIs over 100k)
Charity contributions deductions: $3,304 (5% of AGI, reported on 9.5% of returns)
Here:
$3,304
State:
$5,167
Here:
5.0% of AGI
State:
5.3% of AGI
(% of AGI for various income ranges: 0.3% for AGIs $10k-25k, 0.5% for AGIs $25k-50k, 1.2% for AGIs $50k-75k, 2.0% for AGIs $75k-100k, 1.7% for AGIs over 100k)
Total tax: $3,848 (reported on 72.8% of returns)
37861:
$3,848
State:
$7,482
(% of AGI for various income ranges: 6.2% for AGIs below $10k, 3.8% for AGIs $10k-25k, 6.3% for AGIs $25k-50k, 8.4% for AGIs $50k-75k, 10.7% for AGIs $75k-100k, 19.2% for AGIs over 100k)
Earned income credit: $1,735 (reported on 23.1% of returns)
Here:
$1,735
State:
$1,826
Percentage of individuals using paid preparers for their 2004 taxes: 75.0%
Here:
75%
State:
60%
(% for various income ranges: 71.2% for AGIs below $10k, 78.4% for AGIs $10k-25k, 77.2% for AGIs $25k-50k, 68.6% for AGIs $50k-75k, 70.2% for AGIs $75k-100k, 82.6% for AGIs over 100k)
Likely homosexual households (counted as self-reported same-sex unmarried-partner households)
Lesbian couples: 0.0% of all households
Gay men: 0.1% of all households
Household received Food Stamps/SNAP in the past 12 months: 444 Household did not receive Food Stamps/SNAP in the past 12 months: 3,131
Women who had a birth in the past 12 months: 94 (88 now married, 7 unmarried) Women who did not have a birth in the past 12 months: 1,709 (889 now married, 819 unmarried)
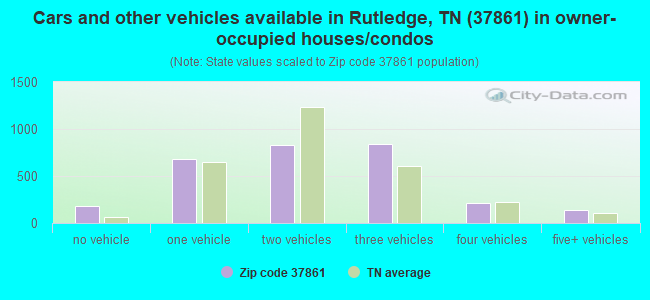
Housing units in zip code 37861 with a mortgage: 1,276 (54 second mortgage, 37 both second mortgage and home equity loan) Houses without a mortgage: 28
Median monthly owner costs for units with a mortgage: $1,224 Median monthly owner costs for units without a mortgage: $333
Residents with income below the poverty level in 2022:
This zip code:
17.1%
Whole state:
13.3%
Residents with income below 50% of the poverty level in 2022:
This zip code:
9.5%
Whole state:
7.1%
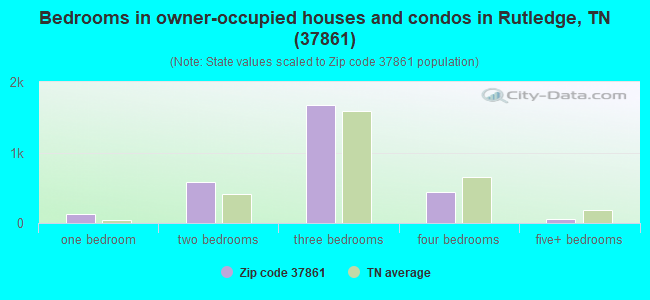
Median number of rooms in houses and condos:
Here:
5.7
State:
6.5
Median number of rooms in apartments:
Here:
4.2
State:
4.4
Notable locations in this zip code not listed on our city pages
Notable locations in zip code 37861: Combs Cattle Farm (A), Central Point (B), Narrow Valley (C), Southern Dock (D), Wa-Ni Boat Dock (E), May Springs Campground (F), Greenlee Campground (G), Buffalo Springs State Hatchery (H), Shirley Crossing (I), Henry Crossing (J), Grainger County Rescue Squad (K), Rutledge Volunteer Fire Department (L). Display/hide their locations on the map
Churches in zip code 37861 include: Grace Church (A), New Blackwell Church (B), Noe Chapel (C), Rutledge Presbyterian Church (D), Rutledge Methodist Church (E), Joppa United Mthodist Church (F), Richland Church (G), Sunrise Church (H), Avondale Church (I). Display/hide their locations on the map
Cemeteries: Talley Cemetery (1), Jim Walker Cemetery (2), Kidwell Cemetery (3), Mitchell Cemetery (4), Whitehead Cemetery (5), Yates Cemetery (6), Young Cemetery (7). Display/hide their locations on the map
Streams, rivers, and creeks: Honey Creek (A), Higgs Branch (B), Highland Springs Branch (C), Buffalo Hide Creek (D), Buffalo Creek (E), Pearce Branch (F), McCarty Branch (G), May Spring Branch (H), Lambdin Branch (I). Display/hide their locations on the map
Parks in zip code 37861 include: Buffalo Springs Game Farm (1), Rutledge Recreational Park (2), Buffalo Springs State Game Farm (3), Grainger County Park (4). Display/hide their locations on the map
In group quarters: 130 (-1 institutionalized population)
Size of family households: 1,209 2-persons, 526 3-persons, 361 4-persons, 140 5-persons, 15 6-persons, 25 7-or-more-persons
Size of nonfamily households: 1,079 1-person, 204 2-persons, 15 4-persons
1,166 married couples with children.
153 single-parent households (7 men, 146 women).
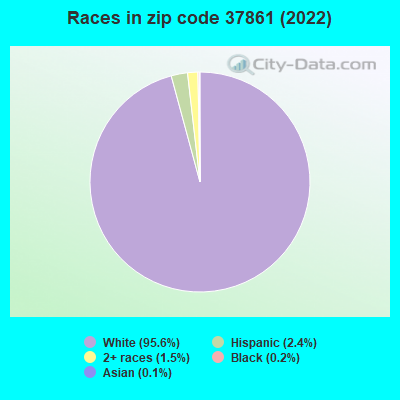
96.4% of residents of 37861 zip code speak English at home.
3.4% of residents speak Spanish at home (75% very well, 25% not well).
0.1% of residents speak other Indo-European language at home (100% very well).
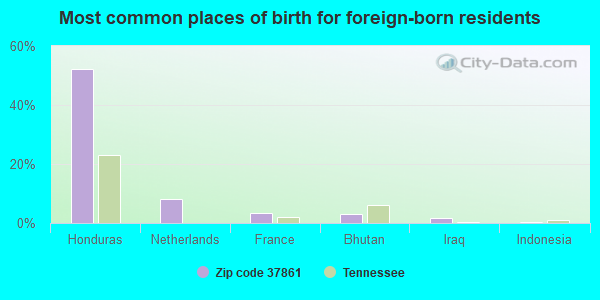
Foreign born population: 236 (2.8%) (34.6% of them are naturalized citizens)
This zip code:
2.8%
Whole state:
5.6%
52%Honduras
8%Netherlands
3%France
3%Bhutan
2%Iraq
0%Indonesia
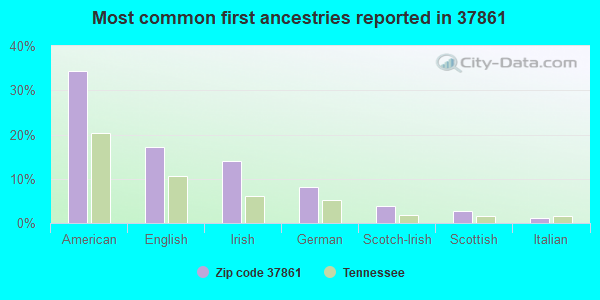
34%American
17%English
14%Irish
8%German
4%Scotch-Irish
3%Scottish
1%Italian
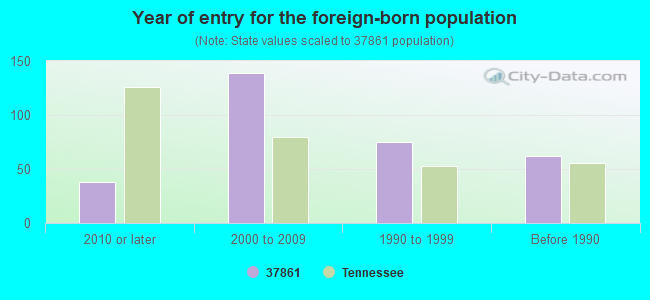
Year of entry for the foreign-born population
382010 or later
1392000 to 2009
751990 to 1999
62Before 1990
Facilities with environmental interests located in this zip code:
BUFFALO SPRINGS FISH HATCHERY (RT 4, BOX 260 in RUTLEDGE, TN)
National Pollutant Discharge Elimination System NON-MAJOR (Tracking pollutant discharge elimination systems) - permit Business SIC classification: FISH HATCHERIES AND PRESERVES Organizations: ALBERT OYER (CONTACT/OWNER)
CORRUGATING ROLL CORP (BRYAN ROAD in RUTLEDGE, TN)
(Resource Conservation and Recovery Act (tracking hazardous waste)) Business NAICS classification: CORRUGATED AND SOLID FIBER BOX MANUFACTURING. Organizations: ROBERT J SUKENIK (CONTACT/OWNER)
CAMERON TRUCKING/WALTER (?? in RUTLEDGE, TN)
(Resource Conservation and Recovery Act (tracking hazardous waste))
CLAYTON HOMES RUTLEDGE (HIGHWAY 11 WEST in RUTLEDGE, TN)
AIR SYNTHETIC MINOR (AIRS/AFS) CRITERIA AND HAZARDOUS AIR POLLUTANT INVENTORY (Inventory of air pollution sources) TRI REPORTER (Tracking of toxic chemicals releasing facilities) Business SIC classification: MOBILE HOMES Business NAICS classification: MANUFACTURED HOME (MOBILE HOME) MANUFACTURING. Alternative names: CLAYTON HOMES, INC., CLAYTON HOMES, INC.
CORRUGATING ROLL CORPORATION (OLD 11 W ST HIGHWAY in RUTLEDGE, TN)
(Resource Conservation and Recovery Act (tracking hazardous waste)) Business NAICS classification: OTHER COMMERCIAL AND SERVICE INDUSTRY MACHINERY MANUFACTURING.
CHEROKEE PRODUCTS INCORPORATED (STATE HIGHWAY 92 AT COFFEY STREET in RUTLEDGE, TN)
TRI REPORTER (Tracking of toxic chemicals releasing facilities) Business SIC classification: EXPLOSIVES
Housing units lacking complete plumbing facilities: 6.3% Housing units lacking complete kitchen facilities: 4.6%
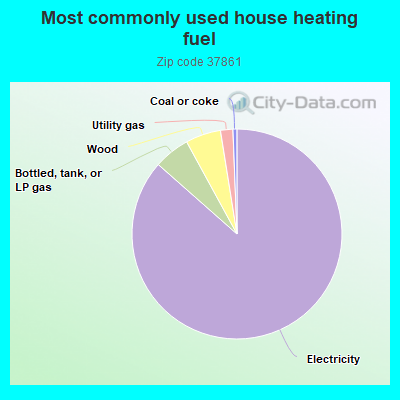
86.0%Electricity
5.5%Bottled, tank, or LP gas
5.4%Wood
1.9%Utility gas
0.6%Coal or coke
Population in 1990: 6,019. Population change in the 1990s: +1,104 (+18.3%).
Place of birth for U.S.-born residents:
This state: 5,200
Northeast: 275
Midwest: 447
South: 1,885
West: 244
63% of the 37861 zip code residents lived in the same house 5 years ago. Out of people who lived in different houses, 53% lived in this county. Out of people who lived in different counties, 50% lived in Tennessee.
90% of the 37861 zip code residents lived in the same house 1 year ago. Out of people who lived in different houses, 39% moved from this county. Out of people who lived in different houses, 31% moved from different county within same state. Out of people who lived in different houses, 23% moved from different state. Out of people who lived in different houses, 9% moved from abroad.
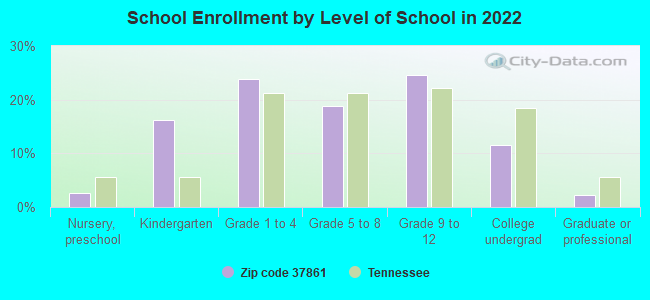
Private vs. public school enrollment:
Students in private schools in grades 1 to 8 (elementary and middle school): 150
Here:
21.4%
Tennessee:
15.0%
Students in private schools in grades 9 to 12 (high school): 43
Here:
10.8%
Tennessee:
16.2%
Students in private undergraduate colleges: 8
Here:
4.6%
Tennessee:
23.5%
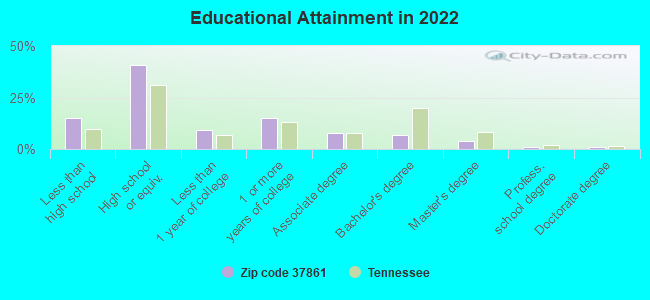
Occupation by median earnings in the past 12 months ($)
98,005Life, physical, and social science occupations
86,802Business and financial operations occupations
77,264Architecture and engineering occupations
47,128Community and social service occupations
45,903Management occupations
45,431Installation, maintenance, and repair occupations
Top industries in this zip code by the number of employees in 2005:
Health Care and Social Assistance: Nursing Care Facilities (100-249 employees: 1 establishment)
Construction: Plumbing, Heating, and Air-Conditioning Contractors (20-49: 1, 10-19: 1)
Finance and Insurance: Commercial Banking (20-49: 1, 5-9: 1)
Other Services (except Public Administration): Environment, Conservation and Wildlife Organizations (20-49: 1, 5-9: 1)
People in group quarters in 2010:
124 people in nursing facilities/skilled-nursing facilities
People in group quarters in 2000:
127 people in nursing homes
27 people in local jails and other confinement facilities (including police lockups)
Fatal accident statistics in 2014:
Fatal accident count: 2
Vehicles involved in fatal accidents: 2
Fatal accidents caused by drunken drivers: 0
Fatalities: 2
Persons involved in fatal accidents: 4
Pedestrians involved in fatal accidents: 0
Fatal accident statistics in 2013:
Fatal accident count: 2
Vehicles involved in fatal accidents: 4
Fatal accidents caused by drunken drivers: 1
Fatalities: 2
Persons involved in fatal accidents: 5
Pedestrians involved in fatal accidents: 0
2002 - 2018 National Fire Incident Reporting System (NFIRS) incidents
According to the data from the years 2002 - 2018 the average number of fire incidents per year is 19. The highest number of reported fire incidents - 81 took place in 2005, and the least - 1 in 2012. The data has an increasing trend.
When looking into fire subcategories, the most incidents belonged to: Outside Fires (44.3%), and Structure Fires (40.2%).
Fire incident types reported to NFIRS in Zip Code 37861

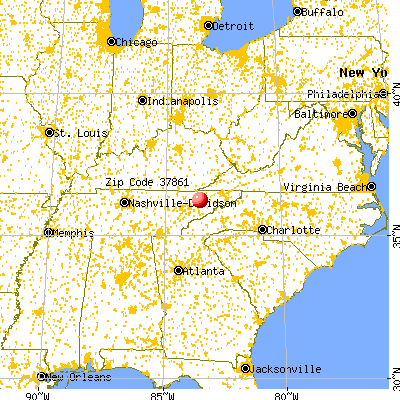


 Nearest zip codes: 37888, 37877, 37760, 37820, 37848, 37709.


 According to the data from the years 2002 - 2018 the average number of fire incidents per year is 19. The highest number of reported fire incidents - 81 took place in 2005, and the least - 1 in 2012. The data has an increasing trend.
 When looking into fire subcategories, the most incidents belonged to: Outside Fires (44.3%), and Structure Fires (40.2%).