Estimated zip code population in 2022: 3,689 Zip code population in 2010: 2,741 Zip code population in 2000: 2,563
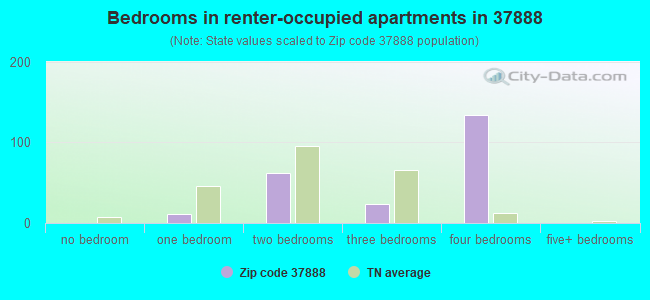
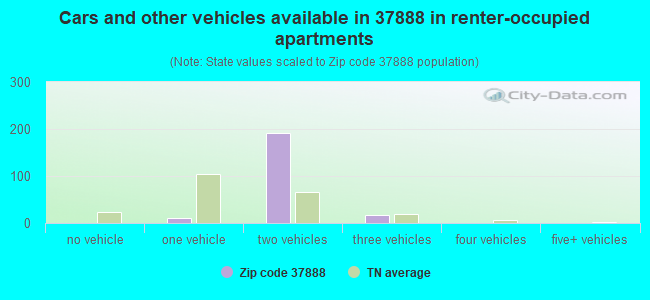
Houses and condos: 1,675 Renter-occupied apartments: 224
% of renters here:
17%
State:
33%
March 2022 cost of living index in zip code 37888: 76.9 (low, U.S. average is 100)
Land area: 54.6 sq. mi. Water area: 1.4 sq. mi.
Population density: 68 people per square mile
(very low).
OSM Map
General Map
Google Map
MSN Map
OSM Map
General Map
Google Map
MSN Map
OSM Map
General Map
Google Map
MSN Map
OSM Map
General Map
Google Map
MSN Map
Please wait while loading the map...
Real estate property taxes paid for housing units in 2022:
This zip code:
0.4% ($575)
Tennessee:
0.5% ($1,376)
Median real estate property taxes paid for housing units with mortgages in 2022: $996 (0.5%) Median real estate property taxes paid for housing units with no mortgage in 2022: $488 (0.4%)
Business Search- 14 Million verified businesses
Males: 1,830
(49.6%)
Females: 1,859
(50.4%)
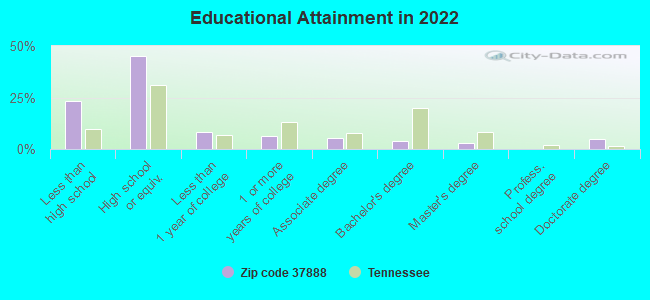
For population 25 years and over in 37888:
High school or higher: 74.6%
Bachelor's degree or higher: 11.1%
Graduate or professional degree: 7.2%
Unemployed: 7.4%
Mean travel time to work (commute): 36.9 minutes
For population 15 years and over in 37888:
Never married: 27.6%
Now married: 49.0%
Separated: 2.1%
Widowed: 10.7%
Divorced: 10.6%
Zip code 37888 compared to state average:
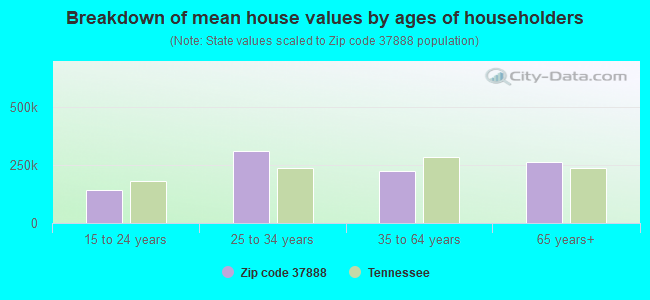
Median house value below state average.
Unemployed percentage above state average.
Black race population percentage significantly below state average.
Median age significantly above state average.
Renting percentage below state average.
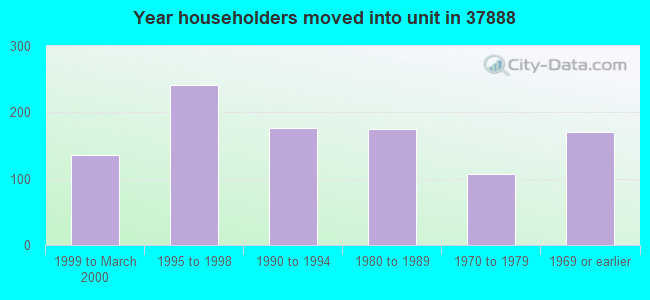
Length of stay since moving in significantly above state average.
Number of college students below state average.
Percentage of population with a bachelor's degree or higher significantly below state average.
Estimated median house/condo value in 2022: $144,057
37888:
$144,057
Tennessee:
$284,800
According to our research of Tennessee and other state lists, there were 4 registered sex offenders living in 37888 zip code as of May 28, 2024. The ratio of all residents to sex offenders in zip code 37888 is 809 to 1. The ratio of registered sex offenders to all residents in this zip code is lower than the state average.
Median resident age:
This zip code:
48.2 years
Tennessee median age:
39.2 years
Average household size:
This zip code:
2.8 people
Tennessee:
2.4 people
Averages for the 2020 tax year for zip code 37888, filed in 2021:
Average Adjusted Gross Income (AGI) in 2020: $48,390 (Individual Income Tax Returns)
Here:
$48,390
State:
$69,014
Salary/wage: $44,974 (reported on 85.7% of returns)
Here:
$44,974
State:
$55,872
(% of AGI for various income ranges: 1143.8% for AGIs below $25k, 3567.5% for AGIs $25k-50k, 5665.9% for AGIs $50k-75k, 9373.3% for AGIs $75k-100k, 16125.0% for AGIs $100k-200k)
Taxable interest for individuals: $354 (reported on 26.7% of returns)
This zip code:
$354
Tennessee:
$1,945
(% of AGI for various income ranges: 11.2% for AGIs below $25k, 6.4% for AGIs $25k-50k, 17.6% for AGIs $50k-75k, 8.9% for AGIs $75k-100k, 26.7% for AGIs $100k-200k)
Ordinary dividends: $2,040 (reported on 4.8% of returns)
Here:
$2,040
State:
$8,105
(% of AGI for various income ranges: 8.6% for AGIs $25k-50k, 86.7% for AGIs $75k-100k)
Net capital gain/loss in AGI: +$7,467 (reported on 5.7% of returns)
Here:
+$7,467
State:
+$33,664
(% of AGI for various income ranges: 35.4% for AGIs $25k-50k, 581.7% for AGIs $100k-200k)
Profit/loss from business: +$11,075 (reported on 19.0% of returns)
Here:
+$11,075
State:
+$18,991
(% of AGI for various income ranges: 234.6% for AGIs below $25k, 194.6% for AGIs $25k-50k, 303.5% for AGIs $50k-75k, 985.0% for AGIs $100k-200k)
Taxable individual retirement arrangement distribution: $16,733 (reported on 5.7% of returns)
37888:
$16,733
Tennessee:
$20,036
(% of AGI for various income ranges: 98.2% for AGIs $25k-50k, 810.0% for AGIs $75k-100k)
Earned income credit: $2,552 (reported on 20.0% of returns)
Here:
$2,552
State:
$2,391
(% of AGI for various income ranges: 114.2% for AGIs below $25k, 93.6% for AGIs $25k-50k)
Percentage of individuals using paid preparers for their 2020 taxes: 97.1%
Here:
97%
State:
93%
(% for various income ranges: 96.9% for AGIs below $25k, 97.0% for AGIs $25k-50k, 95.0% for AGIs $50k-75k, 100.0% for AGIs $75k-100k, 100.0% for AGIs $100k-200k)
Averages for the 2012 tax year for zip code 37888, filed in 2013:
Average Adjusted Gross Income (AGI) in 2012: $35,555 (Individual Income Tax Returns)
Here:
$35,555
State:
$53,767
Salary/wage: $34,912 (reported on 84.5% of returns)
Here:
$34,912
State:
$45,421
(% of AGI for various income ranges: 71.9% for AGIs below $25k, 87.4% for AGIs $25k-50k, 89.0% for AGIs $50k-75k, 87.0% for AGIs $75k-100k, 66.1% for AGIs $100k-200k)
Taxable interest for individuals: $475 (reported on 28.9% of returns)
This zip code:
$475
Tennessee:
$1,732
(% of AGI for various income ranges: 1.2% for AGIs below $25k, 0.3% for AGIs $25k-50k, 0.2% for AGIs $50k-75k, 0.2% for AGIs $75k-100k)
Ordinary dividends: $900 (reported on 5.2% of returns)
Here:
$900
State:
$6,739
Profit/loss from business: +$7,294 (reported on 17.5% of returns)
Here:
+$7,294
State:
+$15,240
(% of AGI for various income ranges: 10.6% for AGIs below $25k, 4.2% for AGIs $25k-50k, 2.2% for AGIs $50k-75k)
Taxable individual retirement arrangement distribution: $9,080 (reported on 5.2% of returns)
37888:
$9,080
Tennessee:
$15,505
Total itemized deductions: $17,057 (26% of AGI, reported on 7.2% of returns)
Here:
$17,057
State:
$21,976
Here:
26.1% of AGI
State:
17.8% of AGI
Charity contributions: $3,025 (reported on 4.1% of returns)
Here:
$3,025
State:
$6,709
Taxes paid: $2,743 (reported on 7.2% of returns)
37888:
$2,743
State:
$4,829
Earned income credit: $2,407 (reported on 28.9% of returns)
Here:
$2,407
State:
$2,404
(% of AGI for various income ranges: 8.4% for AGIs below $25k, 2.0% for AGIs $25k-50k)
Percentage of individuals using paid preparers for their 2012 taxes: 71.1%
Here:
71%
State:
52%
(% for various income ranges: 67.4% for AGIs below $25k, 76.7% for AGIs $25k-50k, 66.7% for AGIs $50k-75k, 116.7% for AGIs $75k-100k)
Averages for the 2004 tax year for zip code 37888, filed in 2005:
Average Adjusted Gross Income (AGI) in 2004: $28,470 (Individual Income Tax Returns)
Here:
$28,470
State:
$44,088
Salary/wage: $28,972 (reported on 84.1% of returns)
Here:
$28,972
State:
$38,825
(% of AGI for various income ranges: 73.9% for AGIs below $10k, 82.0% for AGIs $10k-25k, 90.3% for AGIs $25k-50k, 86.4% for AGIs $50k-75k, 79.3% for AGIs $75k-100k)
Taxable interest for individuals: $778 (reported on 33.0% of returns)
This zip code:
$778
Tennessee:
$1,802
(% of AGI for various income ranges: 4.0% for AGIs below $10k, 1.7% for AGIs $10k-25k, 0.6% for AGIs $25k-50k, 0.7% for AGIs $50k-75k, 0.4% for AGIs $75k-100k)
Taxable dividends: $1,500 (reported on 4.7% of returns)
Here:
$1,500
State:
$3,727
Net capital gain/loss: +$660 (reported on 5.6% of returns)
Here:
+$660
State:
+$15,776
Profit/loss from business: +$7,733 (reported on 22.3% of returns)
Here:
+$7,733
State:
+$12,882
(% of AGI for various income ranges: 32.8% for AGIs below $10k, 11.5% for AGIs $10k-25k, 4.9% for AGIs $25k-50k, 1.8% for AGIs $50k-75k, 2.2% for AGIs $75k-100k)
Total itemized deductions: $14,781 (31% of AGI, reported on 7.7% of returns)
Here:
$14,781
State:
$18,035
Here:
30.6% of AGI
State:
19.9% of AGI
(% of AGI for various income ranges: 2.5% for AGIs $10k-25k, 4.0% for AGIs $25k-50k, 5.3% for AGIs $50k-75k, 5.2% for AGIs $75k-100k)
Charity contributions deductions: $2,500 (5% of AGI, reported on 5.5% of returns)
Here:
$2,500
State:
$5,167
Here:
4.9% of AGI
State:
5.3% of AGI
Total tax: $2,640 (reported on 71.9% of returns)
37888:
$2,640
State:
$7,482
(% of AGI for various income ranges: 5.9% for AGIs below $10k, 3.9% for AGIs $10k-25k, 5.5% for AGIs $25k-50k, 7.9% for AGIs $50k-75k, 11.7% for AGIs $75k-100k)
Earned income credit: $1,792 (reported on 27.5% of returns)
Here:
$1,792
State:
$1,826
Percentage of individuals using paid preparers for their 2004 taxes: 77.1%
Here:
77%
State:
60%
(% for various income ranges: 69.4% for AGIs below $10k, 77.7% for AGIs $10k-25k, 83.3% for AGIs $25k-50k, 73.7% for AGIs $50k-75k, 71.1% for AGIs $75k-100k)
Household received Food Stamps/SNAP in the past 12 months: 226 Household did not receive Food Stamps/SNAP in the past 12 months: 1,103
Women who had a birth in the past 12 months: 54 (55 now married, 0 unmarried) Women who did not have a birth in the past 12 months: 616 (259 now married, 356 unmarried)
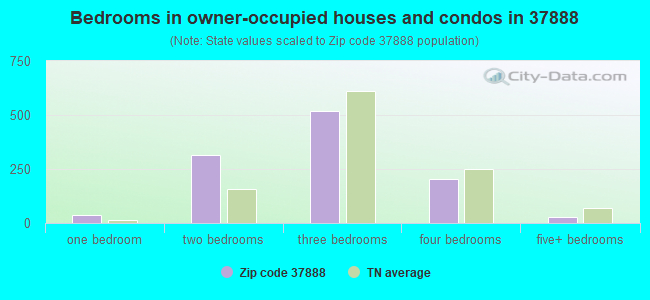
Housing units in zip code 37888 with a mortgage: 231 Median monthly owner costs for units with a mortgage: $908 Median monthly owner costs for units without a mortgage: $278
Residents with income below the poverty level in 2022:
This zip code:
17.7%
Whole state:
13.3%
Residents with income below 50% of the poverty level in 2022:
This zip code:
13.1%
Whole state:
7.1%
Median number of rooms in houses and condos:
Here:
6.0
State:
6.5
Median number of rooms in apartments:
Here:
7.5
State:
4.4
Notable locations in this zip code not listed on our city pages
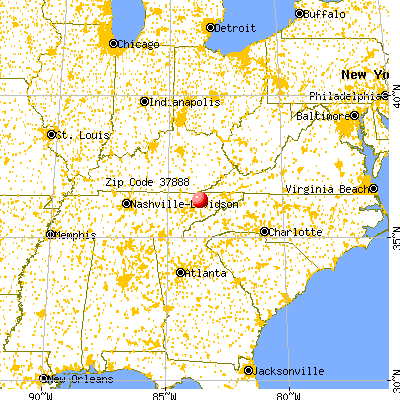
Notable locations in zip code 37888: Coffman Camp (A), Dutch (B), Black Fox (C), Washburn Volunteer Fire Department (D). Display/hide their locations on the map
Churches in zip code 37888 include: Salem Church (A), Fairview Church (B), Locust Grove Church (C), Dutch Valley Church (D), Liberty Hill Church (E), Elm Springs United Baptist Church of Jesus Christ (F), Black Fox Primitive Baptist Church (G), Pennington Chapel (H), Beeler Chapel (I). Display/hide their locations on the map
Cemeteries: Hopson Cemetery (1), Hurst Cemetery (2), Scott Cemetery (3), Thomas Cemetery (4), Seymoure Cemetery (5), Johnson Cemetery (6), Walters Cemetery (7). Display/hide their locations on the map
Streams, rivers, and creeks: Hogskin Creek (A), Fox Creek (B), Dutch Valley Creek (C), Dotson Creek (D), Cool Branch (E), Edderson Branch (F), Williams Creek (G), Puncheon Camp Creek (H). Display/hide their locations on the map
Size of family households: 380 2-persons, 226 3-persons, 223 4-persons, 41 5-persons, 35 6-persons, 42 7-or-more-persons
Size of nonfamily households: 380 1-person
499 married couples with children.
107 single-parent households (107 women).
93.6% of residents of 37888 zip code speak English at home.
6.5% of residents speak Spanish at home (62% very well, 17% not well, 20% not at all).
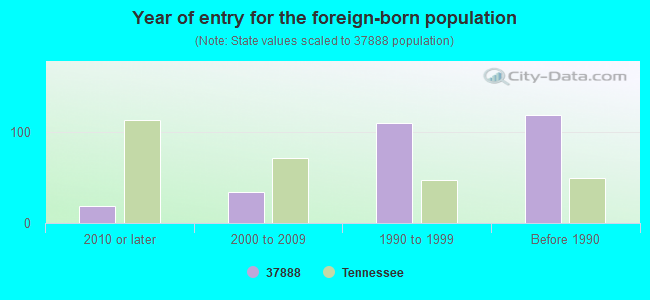
Foreign born population: 206 (5.6%) (27.6% of them are naturalized citizens)
This zip code:
5.6%
Whole state:
5.6%
73%Honduras
11%United Kingdom, excluding England and Scotland
9%Sweden
6%Japan
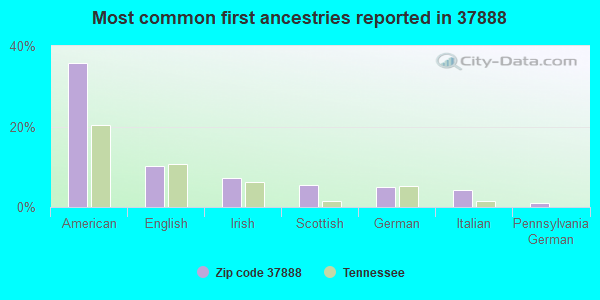
36%American
10%English
7%Irish
5%Scottish
5%German
4%Italian
1%Pennsylvania German
Year of entry for the foreign-born population
192010 or later
342000 to 2009
1101990 to 1999
119Before 1990
Facilities with environmental interests located in this zip code:
C & M CABINET, INC. (HWY 131 in WASHBURN, TN)
AIR MINOR (AIRS/AFS) CRITERIA AND HAZARDOUS AIR POLLUTANT INVENTORY (Inventory of air pollution sources) Business SIC classification: WOOD HOUSEHOLD FURNITURE, EXCEPT UPHOLSTERED; MATTRESSES, FOUNDATIONS, AND CONVERTIBLE BEDS
C & M CABINETS INCORPORATED (RURAL ROUTE 1 in WASHBURN, TN)
(Resource Conservation and Recovery Act (tracking hazardous waste)) Business NAICS classification: NONUPHOLSTERED WOOD HOUSEHOLD FURNITURE MANUFACTURING.
Housing units lacking complete plumbing facilities: 8.4% Housing units lacking complete kitchen facilities: 6.7%
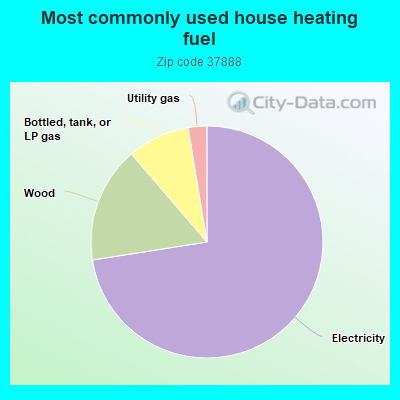
72.6%Electricity
16.2%Wood
8.7%Bottled, tank, or LP gas
2.6%Utility gas
Population in 1990: 1,737. Population change in the 1990s: +826 (+47.6%).
Place of birth for U.S.-born residents:
This state: 2,512
Northeast: 86
Midwest: 189
South: 489
West: 85
75% of the 37888 zip code residents lived in the same house 5 years ago. Out of people who lived in different houses, 34% lived in this county. Out of people who lived in different counties, 50% lived in Tennessee.
96% of the 37888 zip code residents lived in the same house 1 year ago. Out of people who lived in different houses, 20% moved from this county. Out of people who lived in different houses, 27% moved from different county within same state. Out of people who lived in different houses, 60% moved from different state. Out of people who lived in different houses, 8% moved from abroad.
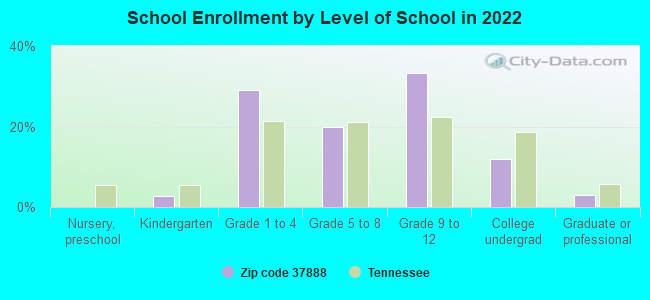
Private vs. public school enrollment:
Students in private schools in grades 1 to 8 (elementary and middle school): 85
Here:
29.0%
Tennessee:
15.0%
Students in private schools in grades 9 to 12 (high school): 34
Here:
17.0%
Tennessee:
16.2%
Students in private undergraduate colleges: 16
Here:
22.5%
Tennessee:
23.5%
Occupation by median earnings in the past 12 months ($)
50,298Installation, maintenance, and repair occupations
46,079Management occupations
43,434Business and financial operations occupations
37,797Transportation occupations
37,442Health diagnosing and treating practitioners and other technical occupations
37,030Production occupations
Companies with federal contracts located in this zip code:
HURST TRAILERS (RT 2 HIGHWAY 131 in WASHBURN, TN; small business) : -$3,340 in 2 contractsin 2006
$0 with Army for Trailers. Signed on 2006-04-11. Completion date: 2005-10-15.
-$3,340, same as above.Signed on 2006-04-11. Completion date: 2005-10-15.
Top industries in this zip code by the number of employees in 2005:
Wholesale Trade: Automobile and Other Motor Vehicle Merchant Wholesalers (10-19 employees: 1 establishment)
Construction: All Other Specialty Trade Contractors (10-19: 1)
Construction: Poured Concrete Foundation and Structure Contractors (10-19: 1)
Health Care and Social Assistance: All Other Outpatient Care Centers (10-19: 1)
Professional, Scientific, and Technical Services: Testing Laboratories (5-9: 1)
Finance and Insurance: Commercial Banking (5-9: 1)
Construction: Framing Contractors (5-9: 1)
Construction: New Single-Family Housing Construction (except Operative Builders) (1-4: 1)
Fatal accident statistics in 2014:
Fatal accident count: 1
Vehicles involved in fatal accidents: 1
Fatal accidents caused by drunken drivers: 1
Fatalities: 1
Persons involved in fatal accidents: 1
Pedestrians involved in fatal accidents: 0
Fatal accident statistics in 2011:
Fatal accident count: 1
Vehicles involved in fatal accidents: 1
Fatal accidents caused by drunken drivers: 0
Fatalities: 1
Persons involved in fatal accidents: 3
Pedestrians involved in fatal accidents: 0
2002 - 2018 National Fire Incident Reporting System (NFIRS) incidents
Based on the data from the years 2002 - 2018 the average number of fire incidents per year is 7. The highest number of fires - 19 took place in 2002, and the least - 0 in 2005. The data has a declining trend.
When looking into fire subcategories, the most reports belonged to: Structure Fires (46.6%), and Outside Fires (36.2%).
Fire incident types reported to NFIRS in Zip Code 37888


 Nearest zip codes: 37848, 37861, 37825, 37709, 37779, 37879.


 Based on the data from the years 2002 - 2018 the average number of fire incidents per year is 7. The highest number of fires - 19 took place in 2002, and the least - 0 in 2005. The data has a declining trend.
 When looking into fire subcategories, the most reports belonged to: Structure Fires (46.6%), and Outside Fires (36.2%).