Estimated zip code population in 2022: 3,968 Zip code population in 2010: 3,736 Zip code population in 2000: 4,009
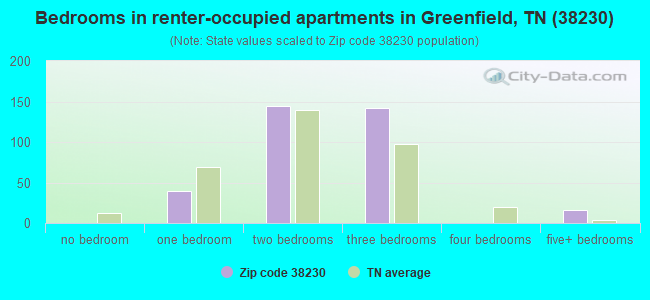
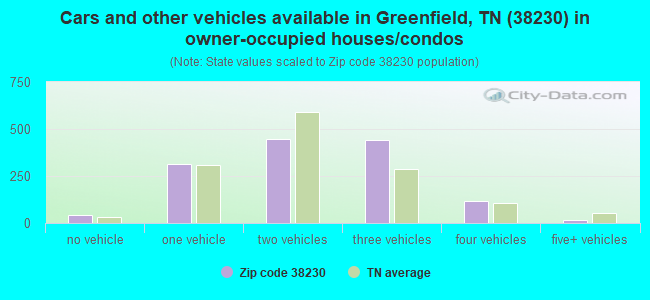
Houses and condos: 1,910 Renter-occupied apartments: 346
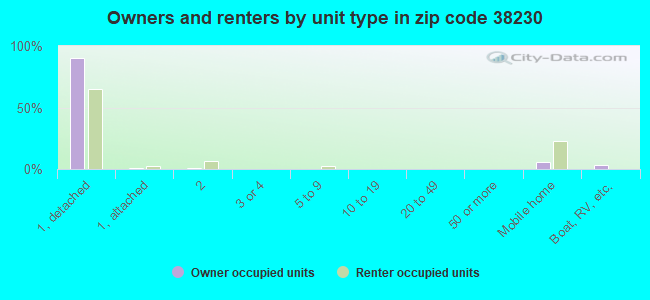
% of renters here:
20%
State:
33%
March 2022 cost of living index in zip code 38230: 78.0 (low, U.S. average is 100)
Land area: 85.9 sq. mi. Water area: 0.1 sq. mi.
Population density: 46 people per square mile
(very low).
OSM Map
General Map
Google Map
MSN Map
OSM Map
General Map
Google Map
MSN Map
OSM Map
General Map
Google Map
MSN Map
OSM Map
General Map
Google Map
MSN Map
Please wait while loading the map...
Real estate property taxes paid for housing units in 2022:
This zip code:
0.6% ($626)
Tennessee:
0.5% ($1,376)
Median real estate property taxes paid for housing units with mortgages in 2022: $645 (0.6%) Median real estate property taxes paid for housing units with no mortgage in 2022: $596 (0.5%)
Estimated median house/condo value in 2022: $112,521
38230:
$112,521
Tennessee:
$284,800
According to our research of Tennessee and other state lists, there were 11 registered sex offenders living in 38230 zip code as of May 28, 2024. The ratio of all residents to sex offenders in zip code 38230 is 321 to 1. The ratio of registered sex offenders to all residents in this zip code is near the state average.
Median resident age:
This zip code:
41.8 years
Tennessee median age:
39.2 years
Average household size:
This zip code:
2.3 people
Tennessee:
2.4 people
Averages for the 2020 tax year for zip code 38230, filed in 2021:
Average Adjusted Gross Income (AGI) in 2020: $48,978 (Individual Income Tax Returns)
Here:
$48,978
State:
$69,014
Salary/wage: $39,401 (reported on 83.3% of returns)
Here:
$39,401
State:
$55,872
(% of AGI for various income ranges: 1135.5% for AGIs below $25k, 3390.6% for AGIs $25k-50k, 6211.2% for AGIs $50k-75k, 9622.2% for AGIs $75k-100k, 13241.2% for AGIs $100k-200k)
Taxable interest for individuals: $2,685 (reported on 26.7% of returns)
This zip code:
$2,685
Tennessee:
$1,945
(% of AGI for various income ranges: 11.5% for AGIs below $25k, 12.6% for AGIs $25k-50k, 23.1% for AGIs $50k-75k, 106.7% for AGIs $75k-100k, 88.8% for AGIs $100k-200k)
Ordinary dividends: $2,479 (reported on 12.7% of returns)
Here:
$2,479
State:
$8,105
(% of AGI for various income ranges: 8.1% for AGIs below $25k, 8.3% for AGIs $25k-50k, 38.1% for AGIs $50k-75k, 28.9% for AGIs $75k-100k, 72.5% for AGIs $100k-200k)
Net capital gain/loss in AGI: +$13,593 (reported on 9.3% of returns)
Here:
+$13,593
State:
+$33,664
(% of AGI for various income ranges: 7.0% for AGIs below $25k, 8.3% for AGIs $25k-50k, 220.6% for AGIs $50k-75k, 638.8% for AGIs $100k-200k)
Profit/loss from business: +$8,757 (reported on 15.3% of returns)
Here:
+$8,757
State:
+$18,991
(% of AGI for various income ranges: 101.9% for AGIs below $25k, 110.6% for AGIs $25k-50k, 146.2% for AGIs $50k-75k, 164.4% for AGIs $75k-100k, 957.5% for AGIs $100k-200k)
Taxable individual retirement arrangement distribution: $12,910 (reported on 6.7% of returns)
38230:
$12,910
Tennessee:
$20,036
(% of AGI for various income ranges: 33.6% for AGIs below $25k, 57.1% for AGIs $25k-50k, 153.1% for AGIs $50k-75k, 764.4% for AGIs $75k-100k)
Total itemized deductions: $42,700 (reported on 1.3% of returns)
Here:
$42,700
State:
$40,136
(% of AGI for various income ranges: 533.8% for AGIs $50k-75k)
Taxes paid: $5,250 (reported on 1.3% of returns)
38230:
$5,250
State:
$6,038
(% of AGI for various income ranges: 65.6% for AGIs $50k-75k)
Earned income credit: $2,497 (reported on 21.3% of returns)
Here:
$2,497
State:
$2,391
(% of AGI for various income ranges: 113.6% for AGIs below $25k, 75.7% for AGIs $25k-50k)
Percentage of individuals using paid preparers for their 2020 taxes: 96.7%
Here:
97%
State:
93%
(% for various income ranges: 96.7% for AGIs below $25k, 97.6% for AGIs $25k-50k, 95.2% for AGIs $50k-75k, 100.0% for AGIs $75k-100k, 91.7% for AGIs $100k-200k, 100.0% for AGIs over 200k)
Averages for the 2012 tax year for zip code 38230, filed in 2013:
Average Adjusted Gross Income (AGI) in 2012: $37,968 (Individual Income Tax Returns)
Here:
$37,968
State:
$53,767
Salary/wage: $32,355 (reported on 83.8% of returns)
Here:
$32,355
State:
$45,421
(% of AGI for various income ranges: 76.1% for AGIs below $25k, 76.3% for AGIs $25k-50k, 77.4% for AGIs $50k-75k, 85.0% for AGIs $75k-100k, 51.1% for AGIs $100k-200k)
Taxable interest for individuals: $1,529 (reported on 29.6% of returns)
This zip code:
$1,529
Tennessee:
$1,732
(% of AGI for various income ranges: 1.6% for AGIs below $25k, 0.7% for AGIs $25k-50k, 0.9% for AGIs $50k-75k, 0.4% for AGIs $75k-100k, 2.1% for AGIs $100k-200k)
Ordinary dividends: $2,044 (reported on 11.3% of returns)
Here:
$2,044
State:
$6,739
(% of AGI for various income ranges: 0.6% for AGIs below $25k, 0.4% for AGIs $25k-50k, 0.5% for AGIs $50k-75k, 1.3% for AGIs $100k-200k)
Net capital gain/loss in AGI: +$5,355 (reported on 7.7% of returns)
Here:
+$5,355
State:
+$19,082
(% of AGI for various income ranges: 0.2% for AGIs below $25k, 0.4% for AGIs $50k-75k, 4.0% for AGIs $100k-200k)
Profit/loss from business: +$6,373 (reported on 15.5% of returns)
Here:
+$6,373
State:
+$15,240
(% of AGI for various income ranges: 5.3% for AGIs below $25k, 2.9% for AGIs $25k-50k, 1.8% for AGIs $50k-75k, 2.7% for AGIs $100k-200k)
Taxable individual retirement arrangement distribution: $9,309 (reported on 7.7% of returns)
38230:
$9,309
Tennessee:
$15,505
(% of AGI for various income ranges: 1.9% for AGIs below $25k, 2.4% for AGIs $25k-50k, 4.6% for AGIs $50k-75k)
Total itemized deductions: $17,419 (22% of AGI, reported on 11.3% of returns)
Here:
$17,419
State:
$21,976
Here:
21.6% of AGI
State:
17.8% of AGI
(% of AGI for various income ranges: 4.7% for AGIs $25k-50k, 10.2% for AGIs $50k-75k, 7.2% for AGIs $100k-200k)
Charity contributions: $7,158 (reported on 8.5% of returns)
Here:
$7,158
State:
$6,709
(% of AGI for various income ranges: 1.1% for AGIs below $25k, 2.6% for AGIs $50k-75k, 3.5% for AGIs $100k-200k)
Taxes paid: $3,027 (reported on 10.6% of returns)
38230:
$3,027
State:
$4,829
(% of AGI for various income ranges: 0.6% for AGIs $25k-50k, 1.4% for AGIs $50k-75k, 1.6% for AGIs $100k-200k)
Earned income credit: $2,151 (reported on 27.5% of returns)
Here:
$2,151
State:
$2,404
(% of AGI for various income ranges: 7.4% for AGIs below $25k, 1.6% for AGIs $25k-50k)
Percentage of individuals using paid preparers for their 2012 taxes: 62.7%
Here:
63%
State:
52%
(% for various income ranges: 56.5% for AGIs below $25k, 60.5% for AGIs $25k-50k, 73.7% for AGIs $50k-75k, 75.0% for AGIs $75k-100k, 87.5% for AGIs $100k-200k)
Averages for the 2004 tax year for zip code 38230, filed in 2005:
Average Adjusted Gross Income (AGI) in 2004: $32,521 (Individual Income Tax Returns)
Here:
$32,521
State:
$44,088
Salary/wage: $30,620 (reported on 87.8% of returns)
Here:
$30,620
State:
$38,825
(% of AGI for various income ranges: 119.5% for AGIs below $10k, 81.5% for AGIs $10k-25k, 85.9% for AGIs $25k-50k, 86.4% for AGIs $50k-75k, 85.7% for AGIs $75k-100k, 64.5% for AGIs over 100k)
Taxable interest for individuals: $2,051 (reported on 34.8% of returns)
This zip code:
$2,051
Tennessee:
$1,802
(% of AGI for various income ranges: 7.9% for AGIs below $10k, 2.8% for AGIs $10k-25k, 1.4% for AGIs $25k-50k, 0.8% for AGIs $50k-75k, 0.4% for AGIs $75k-100k, 5.3% for AGIs over 100k)
Taxable dividends: $2,483 (reported on 13.6% of returns)
Here:
$2,483
State:
$3,727
(% of AGI for various income ranges: 1.1% for AGIs below $10k, 0.3% for AGIs $10k-25k, 0.5% for AGIs $25k-50k, 0.4% for AGIs $50k-75k, 0.6% for AGIs $75k-100k, 3.9% for AGIs over 100k)
Net capital gain/loss: +$3,111 (reported on 9.5% of returns)
Here:
+$3,111
State:
+$15,776
(% of AGI for various income ranges: 4.0% for AGIs below $10k, 0.3% for AGIs $10k-25k, -0.2% for AGIs $25k-50k, 0.7% for AGIs $50k-75k, 0.0% for AGIs $75k-100k, 4.0% for AGIs over 100k)
Profit/loss from business: +$5,427 (reported on 14.4% of returns)
Here:
+$5,427
State:
+$12,882
(% of AGI for various income ranges: 6.4% for AGIs below $10k, 4.8% for AGIs $10k-25k, 1.3% for AGIs $25k-50k, 3.7% for AGIs $50k-75k, 0.9% for AGIs $75k-100k, 1.0% for AGIs over 100k)
IRA payment deduction: $2,333 (reported on 1.8% of returns)
38230:
$2,333
Tennessee:
$2,934
Total itemized deductions: $17,773 (21% of AGI, reported on 10.1% of returns)
Here:
$17,773
State:
$18,035
Here:
21.1% of AGI
State:
19.9% of AGI
(% of AGI for various income ranges: 2.8% for AGIs $10k-25k, 4.2% for AGIs $25k-50k, 6.4% for AGIs $50k-75k, 5.7% for AGIs $75k-100k, 10.3% for AGIs over 100k)
Charity contributions deductions: $7,061 (8% of AGI, reported on 8.7% of returns)
Here:
$7,061
State:
$5,167
Here:
7.8% of AGI
State:
5.3% of AGI
(% of AGI for various income ranges: 1.8% for AGIs below $10k, 1.0% for AGIs $25k-50k, 1.1% for AGIs $50k-75k, 2.4% for AGIs $75k-100k, 6.0% for AGIs over 100k)
Total tax: $4,251 (reported on 69.2% of returns)
38230:
$4,251
State:
$7,482
(% of AGI for various income ranges: 3.1% for AGIs below $10k, 3.6% for AGIs $10k-25k, 6.0% for AGIs $25k-50k, 8.1% for AGIs $50k-75k, 11.4% for AGIs $75k-100k, 20.1% for AGIs over 100k)
Earned income credit: $1,822 (reported on 23.0% of returns)
Here:
$1,822
State:
$1,826
Percentage of individuals using paid preparers for their 2004 taxes: 66.1%
Here:
66%
State:
60%
(% for various income ranges: 57.8% for AGIs below $10k, 67.5% for AGIs $10k-25k, 67.1% for AGIs $25k-50k, 68.7% for AGIs $50k-75k, 69.7% for AGIs $75k-100k, 92.7% for AGIs over 100k)
Household received Food Stamps/SNAP in the past 12 months: 325 Household did not receive Food Stamps/SNAP in the past 12 months: 1,399
Women who had a birth in the past 12 months: 17 (18 now married, 0 unmarried) Women who did not have a birth in the past 12 months: 844 (388 now married, 455 unmarried)
Housing units in zip code 38230 with a mortgage: 706 (21 second mortgage, 16 both second mortgage and home equity loan) Median monthly owner costs for units with a mortgage: $795 Median monthly owner costs for units without a mortgage: $334
Residents with income below the poverty level in 2022:
This zip code:
14.1%
Whole state:
13.3%
Residents with income below 50% of the poverty level in 2022:
This zip code:
9.5%
Whole state:
7.1%
Median number of rooms in houses and condos:
Here:
6.3
State:
6.5
Median number of rooms in apartments:
Here:
4.9
State:
4.4
Notable locations in this zip code not listed on our city pages
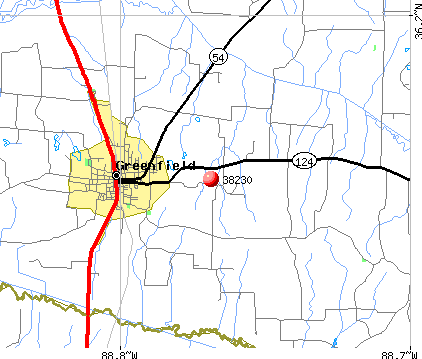
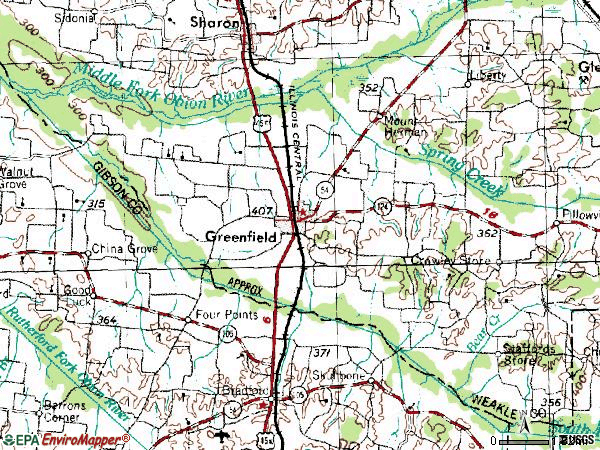
Notable locations in zip code 38230: Brocks Chapel (A), Pillowville Volunteer Fire Department (B), Greenfield Fire Department (C), Greenfield City Hall (D). Display/hide their locations on the map
Churches in zip code 38230 include: Gearins Chapel (A), Bethlehem Church (B), Bethel Baptist Church (C), Pleasant Grove Baptist Church (D), First Assembly of God Church (E), First Presbyterian Church (F), Greenfield First Baptist Church (G), Greenfield United Methodist Church (H), Moores Chapel Baptist Church (I). Display/hide their locations on the map
Cemeteries: Hornbeak Cemetery (1), Brock Cemetery (2), Morris Cemetery (3), Winston Cemetery (4), Rose Hill Cemetery (5), Pleasant Grove Cemetery (6), Pittman Cemetery (7). Display/hide their locations on the map
Streams, rivers, and creeks: Harrison Branch (A), Doland Branch (B), Dolan Creek (C), Cottnell Branch (D), Coats Branch (E), Bradford Creek (F), Capp Branch (G), Cane Branch (H), Middle Fork Obion River (I). Display/hide their locations on the map
418 married couples with children.
184 single-parent households (84 men, 100 women).
97.1% of residents of 38230 zip code speak English at home.
0.7% of residents speak Spanish at home (30% very well, 70% not well).
0.6% of residents speak other Indo-European language at home (87% very well, 13% not well).
1.4% of residents speak Asian or Pacific Island language at home (100% well).
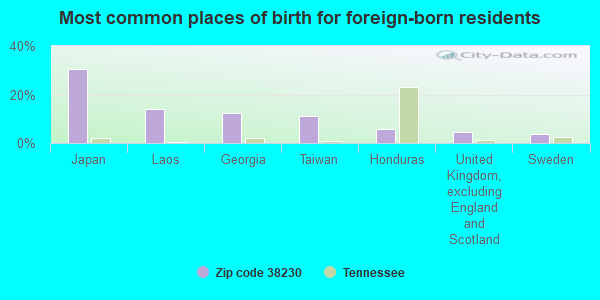
Foreign born population: 137 (3.5%) (73.2% of them are naturalized citizens)
This zip code:
3.5%
Whole state:
5.6%
31%Japan
14%Laos
12%Georgia
11%Taiwan
6%Honduras
4%United Kingdom, excluding England and Scotland
4%Sweden
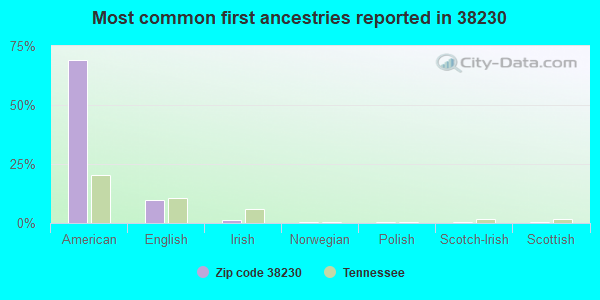
69%American
10%English
1%Irish
1%Norwegian
1%Polish
1%Scotch-Irish
1%Scottish
Year of entry for the foreign-born population
632010 or later
122000 to 2009
531990 to 1999
35Before 1990
Facilities with environmental interests located in this zip code:
CALLINS INDUSTRIES INC SUB. OF WHITEHALL (HWY 54-BROAD STREET in GREENFIELD, TN)
(Resource Conservation and Recovery Act (tracking hazardous waste)) Business NAICS classification: ELECTRONIC CAPACITOR MANUFACTURING.
CONCHEMCO INCORPORATED (PO BOX 86 in GREENFIELD, TN)
(Resource Conservation and Recovery Act (tracking hazardous waste)) Business NAICS classification: MANUFACTURED HOME (MOBILE HOME) MANUFACTURING.
Housing units lacking complete plumbing facilities: 3.2% Housing units lacking complete kitchen facilities: 6.9%
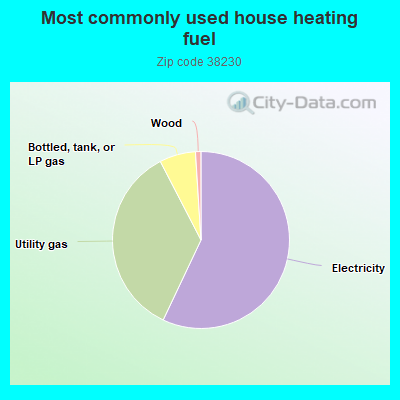
57.1%Electricity
35.4%Utility gas
6.6%Bottled, tank, or LP gas
1.0%Wood
Population in 1990: 4,682.
Place of birth for U.S.-born residents:
This state: 2,881
Northeast: 23
Midwest: 338
South: 490
West: 28
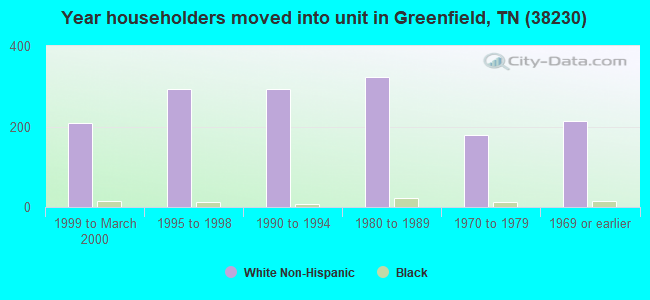
65% of the 38230 zip code residents lived in the same house 5 years ago. Out of people who lived in different houses, 57% lived in this county. Out of people who lived in different counties, 50% lived in Tennessee.
94% of the 38230 zip code residents lived in the same house 1 year ago. Out of people who lived in different houses, 29% moved from this county. Out of people who lived in different houses, 23% moved from different county within same state. Out of people who lived in different houses, 51% moved from different state. Out of people who lived in different houses, 5% moved from abroad.
Private vs. public school enrollment:
Students in private schools in grades 1 to 8 (elementary and middle school): 7
Here:
3.1%
Tennessee:
15.0%
Students in private schools in grades 9 to 12 (high school):
Here:
0.0%
Tennessee:
16.2%
Students in private undergraduate colleges: 57
Here:
42.7%
Tennessee:
23.5%
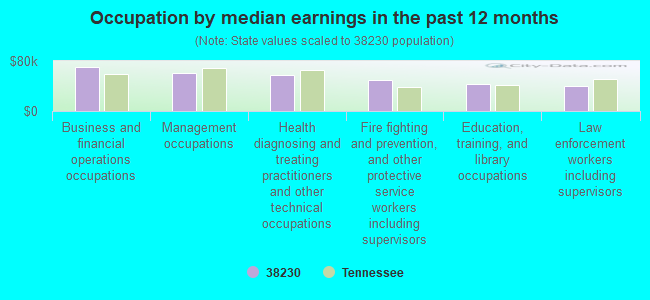
Occupation by median earnings in the past 12 months ($)
70,119Business and financial operations occupations
61,583Management occupations
57,625Health diagnosing and treating practitioners and other technical occupations
50,299Fire fighting and prevention, and other protective service workers including supervisors
43,248Education, training, and library occupations
40,367Law enforcement workers including supervisors
Top industries in this zip code by the number of employees in 2005:
Wholesale Trade: Fresh Fruit and Vegetable Merchant Wholesalers (50-99 employees: 1 establishment, 10-19 employees: 1 establishment)
Health Care and Social Assistance: Child Day Care Services (10-19: 1, 5-9: 2, 1-4: 1)
Other Services (except Public Administration): Religious Organizations (5-9: 2, 1-4: 3)
Construction: Poured Concrete Foundation and Structure Contractors (10-19: 1)
Fatal accident statistics in 2014:
Fatal accident count: 1
Vehicles involved in fatal accidents: 1
Fatal accidents caused by drunken drivers: 0
Fatalities: 1
Persons involved in fatal accidents: 2
Pedestrians involved in fatal accidents: 0
Fatal accident statistics in 2013:
Fatal accident count: 1
Vehicles involved in fatal accidents: 1
Fatal accidents caused by drunken drivers: 0
Fatalities: 2
Persons involved in fatal accidents: 2
Pedestrians involved in fatal accidents: 0
2002 - 2018 National Fire Incident Reporting System (NFIRS) incidents
Based on the data from the years 2002 - 2018 the average number of fire incidents per year is 21. The highest number of fires - 29 took place in 2008, and the least - 3 in 2002. The data has an increasing trend.
When looking into fire subcategories, the most incidents belonged to: Structure Fires (47.0%), and Outside Fires (35.4%).
Fire incident types reported to NFIRS in Zip Code 38230


 Nearest zip codes: 38316, 38255, 38369, 38229, 38220, 38225.


 Based on the data from the years 2002 - 2018 the average number of fire incidents per year is 21. The highest number of fires - 29 took place in 2008, and the least - 3 in 2002. The data has an increasing trend.
 When looking into fire subcategories, the most incidents belonged to: Structure Fires (47.0%), and Outside Fires (35.4%).