Estimated zip code population in 2022: 2,563 Zip code population in 2010: 2,931 Zip code population in 2000: 3,062
Houses and condos: 1,267 Renter-occupied apartments: 247
% of renters here:
23%
State:
33%
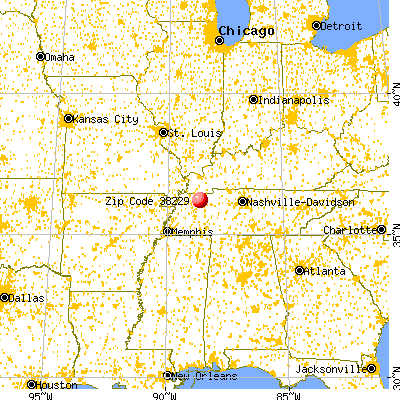
March 2022 cost of living index in zip code 38229: 77.7 (low, U.S. average is 100)
Land area: 60.1 sq. mi. Water area: 0.0 sq. mi.
Population density: 43 people per square mile
(very low).
OSM Map
General Map
Google Map
MSN Map
OSM Map
General Map
Google Map
MSN Map
OSM Map
General Map
Google Map
MSN Map
OSM Map
General Map
Google Map
MSN Map
Please wait while loading the map...
Real estate property taxes paid for housing units in 2022:
This zip code:
0.5% ($680)
Tennessee:
0.5% ($1,376)
Median real estate property taxes paid for housing units with mortgages in 2022: $869 (0.5%) Median real estate property taxes paid for housing units with no mortgage in 2022: $548 (0.6%)
Business Search- 14 Million verified businesses
Males: 1,196
(46.7%)
Females: 1,367
(53.3%)
For population 25 years and over in 38229:
High school or higher: 83.7%
Bachelor's degree or higher: 19.1%
Graduate or professional degree: 9.2%
Unemployed: 0.3%
Mean travel time to work (commute): 26.6 minutes
For population 15 years and over in 38229:
Never married: 23.6%
Now married: 54.6%
Separated: 0.8%
Widowed: 5.5%
Divorced: 15.7%
Zip code 38229 compared to state average:
Median house value below state average.
Unemployed percentage significantly below state average.
Black race population percentage significantly below state average.
Hispanic race population percentage below state average.
Median age above state average.
Foreign-born population percentage significantly below state average.
Length of stay since moving in below state average.
Percentage of population with a bachelor's degree or higher below state average.
Estimated median house/condo value in 2022: $130,068
38229:
$130,068
Tennessee:
$284,800
According to our research of Tennessee and other state lists, there were 9 registered sex offenders living in 38229 zip code as of May 28, 2024. The ratio of all residents to sex offenders in zip code 38229 is 300 to 1. The ratio of registered sex offenders to all residents in this zip code is near the state average.
Median resident age:
This zip code:
43.2 years
Tennessee median age:
39.2 years
Average household size:
This zip code:
2.4 people
Tennessee:
2.4 people
Averages for the 2020 tax year for zip code 38229, filed in 2021:
Average Adjusted Gross Income (AGI) in 2020: $49,634 (Individual Income Tax Returns)
Here:
$49,634
State:
$69,014
Salary/wage: $45,363 (reported on 85.6% of returns)
Here:
$45,363
State:
$55,872
(% of AGI for various income ranges: 1029.1% for AGIs below $25k, 3722.9% for AGIs $25k-50k, 6400.0% for AGIs $50k-75k, 8466.0% for AGIs $75k-100k, 16786.7% for AGIs $100k-200k)
Taxable interest for individuals: $656 (reported on 27.1% of returns)
This zip code:
$656
Tennessee:
$1,945
(% of AGI for various income ranges: 4.4% for AGIs below $25k, 6.1% for AGIs $25k-50k, 23.8% for AGIs $50k-75k, 22.0% for AGIs $75k-100k, 138.9% for AGIs $100k-200k)
Ordinary dividends: $2,607 (reported on 12.7% of returns)
Here:
$2,607
State:
$8,105
(% of AGI for various income ranges: 3.8% for AGIs below $25k, 7.1% for AGIs $25k-50k, 83.8% for AGIs $50k-75k, 276.7% for AGIs $100k-200k)
Net capital gain/loss in AGI: +$4,440 (reported on 8.5% of returns)
Here:
+$4,440
State:
+$33,664
(% of AGI for various income ranges: 12.6% for AGIs below $25k, 50.0% for AGIs $50k-75k, 373.3% for AGIs $100k-200k)
Profit/loss from business: +$8,047 (reported on 16.1% of returns)
Here:
+$8,047
State:
+$18,991
(% of AGI for various income ranges: 157.9% for AGIs below $25k, 50.7% for AGIs $25k-50k, 254.6% for AGIs $50k-75k, 576.7% for AGIs $100k-200k)
Taxable individual retirement arrangement distribution: $13,338 (reported on 6.8% of returns)
38229:
$13,338
Tennessee:
$20,036
(% of AGI for various income ranges: 195.7% for AGIs $25k-50k, 519.0% for AGIs $75k-100k)
Earned income credit: $2,481 (reported on 22.0% of returns)
Here:
$2,481
State:
$2,391
(% of AGI for various income ranges: 121.8% for AGIs below $25k, 82.5% for AGIs $25k-50k)
Percentage of individuals using paid preparers for their 2020 taxes: 96.6%
Here:
97%
State:
93%
(% for various income ranges: 95.3% for AGIs below $25k, 96.9% for AGIs $25k-50k, 100.0% for AGIs $50k-75k, 91.7% for AGIs $75k-100k, 100.0% for AGIs $100k-200k, 100.0% for AGIs over 200k)
Averages for the 2012 tax year for zip code 38229, filed in 2013:
Average Adjusted Gross Income (AGI) in 2012: $41,638 (Individual Income Tax Returns)
Here:
$41,638
State:
$53,767
Salary/wage: $36,456 (reported on 86.7% of returns)
Here:
$36,456
State:
$45,421
(% of AGI for various income ranges: 74.6% for AGIs below $25k, 85.2% for AGIs $25k-50k, 85.5% for AGIs $50k-75k, 78.7% for AGIs $75k-100k, 58.3% for AGIs $100k-200k)
Taxable interest for individuals: $850 (reported on 26.5% of returns)
This zip code:
$850
Tennessee:
$1,732
(% of AGI for various income ranges: 0.5% for AGIs below $25k, 0.4% for AGIs $25k-50k, 0.2% for AGIs $50k-75k, 0.6% for AGIs $75k-100k, 0.9% for AGIs $100k-200k)
Ordinary dividends: $2,462 (reported on 14.2% of returns)
Here:
$2,462
State:
$6,739
(% of AGI for various income ranges: 0.3% for AGIs below $25k, 0.4% for AGIs $25k-50k, 1.5% for AGIs $75k-100k, 1.9% for AGIs $100k-200k)
Net capital gain/loss in AGI: +$6,200 (reported on 6.2% of returns)
Here:
+$6,200
State:
+$19,082
Profit/loss from business: +$10,741 (reported on 15.0% of returns)
Here:
+$10,741
State:
+$15,240
(% of AGI for various income ranges: 7.5% for AGIs below $25k, 1.7% for AGIs $25k-50k, 6.5% for AGIs $50k-75k, 4.5% for AGIs $100k-200k)
Taxable individual retirement arrangement distribution: $11,400 (reported on 8.0% of returns)
38229:
$11,400
Tennessee:
$15,505
(% of AGI for various income ranges: 2.6% for AGIs below $25k, 1.7% for AGIs $25k-50k, 9.2% for AGIs $75k-100k)
Total itemized deductions: $18,644 (23% of AGI, reported on 14.2% of returns)
Here:
$18,644
State:
$21,976
Here:
23.2% of AGI
State:
17.8% of AGI
(% of AGI for various income ranges: 7.3% for AGIs $25k-50k, 7.1% for AGIs $50k-75k, 6.9% for AGIs $75k-100k, 7.6% for AGIs $100k-200k)
Charity contributions: $6,325 (reported on 10.6% of returns)
Here:
$6,325
State:
$6,709
(% of AGI for various income ranges: 0.9% for AGIs $25k-50k, 1.4% for AGIs $50k-75k, 2.9% for AGIs $75k-100k, 2.5% for AGIs $100k-200k)
Taxes paid: $2,962 (reported on 14.2% of returns)
38229:
$2,962
State:
$4,829
(% of AGI for various income ranges: 0.8% for AGIs $25k-50k, 1.0% for AGIs $50k-75k, 1.2% for AGIs $75k-100k, 1.6% for AGIs $100k-200k)
Earned income credit: $2,231 (reported on 25.7% of returns)
Here:
$2,231
State:
$2,404
(% of AGI for various income ranges: 7.6% for AGIs below $25k, 1.6% for AGIs $25k-50k)
Percentage of individuals using paid preparers for their 2012 taxes: 68.1%
Here:
68%
State:
52%
(% for various income ranges: 64.6% for AGIs below $25k, 66.7% for AGIs $25k-50k, 68.8% for AGIs $50k-75k, 75.0% for AGIs $75k-100k, 87.5% for AGIs $100k-200k)
Averages for the 2004 tax year for zip code 38229, filed in 2005:
Average Adjusted Gross Income (AGI) in 2004: $32,085 (Individual Income Tax Returns)
Here:
$32,085
State:
$44,088
Salary/wage: $29,302 (reported on 88.6% of returns)
Here:
$29,302
State:
$38,825
(% of AGI for various income ranges: 121.3% for AGIs below $10k, 79.9% for AGIs $10k-25k, 85.4% for AGIs $25k-50k, 87.6% for AGIs $50k-75k, 81.6% for AGIs $75k-100k, 50.8% for AGIs over 100k)
Taxable interest for individuals: $1,304 (reported on 32.5% of returns)
This zip code:
$1,304
Tennessee:
$1,802
(% of AGI for various income ranges: 3.3% for AGIs below $10k, 1.8% for AGIs $10k-25k, 1.2% for AGIs $25k-50k, 0.9% for AGIs $50k-75k, 0.9% for AGIs $75k-100k, 1.9% for AGIs over 100k)
Taxable dividends: $2,784 (reported on 15.1% of returns)
Here:
$2,784
State:
$3,727
(% of AGI for various income ranges: 2.4% for AGIs below $10k, 0.7% for AGIs $10k-25k, 0.3% for AGIs $25k-50k, 0.2% for AGIs $50k-75k, 2.7% for AGIs $75k-100k, 4.8% for AGIs over 100k)
Net capital gain/loss: +$7,426 (reported on 8.1% of returns)
Here:
+$7,426
State:
+$15,776
(% of AGI for various income ranges: -2.5% for AGIs below $10k, -0.0% for AGIs $10k-25k, 0.2% for AGIs $25k-50k, 0.6% for AGIs $75k-100k, 13.9% for AGIs over 100k)
Profit/loss from business: +$5,225 (reported on 16.1% of returns)
Here:
+$5,225
State:
+$12,882
(% of AGI for various income ranges: 12.6% for AGIs below $10k, 3.0% for AGIs $10k-25k, 3.9% for AGIs $25k-50k, 1.0% for AGIs $50k-75k, 2.1% for AGIs $75k-100k)
Profit/loss from farming: +$463 (reported on 5.8% of returns)
Here:
+$463
State:
-$6,038
IRA payment deduction: $2,448 (reported on 2.5% of returns)
38229:
$2,448
Tennessee:
$2,934
Total itemized deductions: $15,007 (22% of AGI, reported on 12.7% of returns)
Here:
$15,007
State:
$18,035
Here:
22.4% of AGI
State:
19.9% of AGI
(% of AGI for various income ranges: 2.2% for AGIs $10k-25k, 6.6% for AGIs $25k-50k, 5.7% for AGIs $50k-75k, 10.3% for AGIs $75k-100k, 6.0% for AGIs over 100k)
Charity contributions deductions: $4,388 (6% of AGI, reported on 10.4% of returns)
Here:
$4,388
State:
$5,167
Here:
6.0% of AGI
State:
5.3% of AGI
(% of AGI for various income ranges: 0.2% for AGIs $10k-25k, 0.9% for AGIs $25k-50k, 1.3% for AGIs $50k-75k, 3.3% for AGIs $75k-100k, 2.9% for AGIs over 100k)
Total tax: $3,732 (reported on 71.5% of returns)
38229:
$3,732
State:
$7,482
(% of AGI for various income ranges: 3.5% for AGIs below $10k, 3.8% for AGIs $10k-25k, 5.9% for AGIs $25k-50k, 8.6% for AGIs $50k-75k, 10.2% for AGIs $75k-100k, 18.8% for AGIs over 100k)
Earned income credit: $1,719 (reported on 22.9% of returns)
Here:
$1,719
State:
$1,826
Percentage of individuals using paid preparers for their 2004 taxes: 72.9%
Here:
73%
State:
60%
(% for various income ranges: 62.1% for AGIs below $10k, 73.5% for AGIs $10k-25k, 77.4% for AGIs $25k-50k, 72.3% for AGIs $50k-75k, 79.0% for AGIs $75k-100k, 92.9% for AGIs over 100k)
Household received Food Stamps/SNAP in the past 12 months: 135 Household did not receive Food Stamps/SNAP in the past 12 months: 925
Women who had a birth in the past 12 months: 16 (13 now married, 3 unmarried) Women who did not have a birth in the past 12 months: 641 (300 now married, 341 unmarried)
Housing units in zip code 38229 with a mortgage: 454 (26 second mortgage, 26 both second mortgage and home equity loan) Houses without a mortgage: 23
Median monthly owner costs for units with a mortgage: $884 Median monthly owner costs for units without a mortgage: $337
Residents with income below the poverty level in 2022:
This zip code:
11.5%
Whole state:
13.3%
Residents with income below 50% of the poverty level in 2022:
This zip code:
8.1%
Whole state:
7.1%
Median number of rooms in houses and condos:
Here:
6.2
State:
6.5
Median number of rooms in apartments:
Here:
4.3
State:
4.4
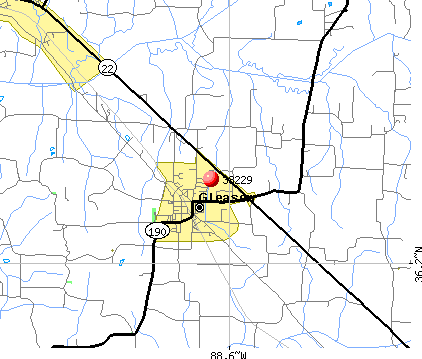
Notable locations in this zip code not listed on our city pages
Churches in zip code 38229 include: Sandhill Church (A), Beech Springs Church (B), Gleason First Baptist Church (C), Liberty Methodist Church (D), Olivet Church (E), New Valley Church (F), New Hope Church (G), Mount Zion Church (H), Christian Chapel (I). Display/hide their locations on the map
Cemeteries: Hopewell Cemetery (1), Campbell Cemetery (2), Smyth Cemetery (3), Simms Cemetery (4), Sandhill Cemetery (5), Parks Cemetery (6), Page Cemetery (7). Display/hide their locations on the map
Streams, rivers, and creeks: Tumbling Creek (A), Thompson Creek (B), Glasgow Branch (C), Cotton Creek (D), Bond Branch (E), Arnold Branch (F), Morris Branch (G), Summers Creek (H). Display/hide their locations on the map
Size of family households: 330 2-persons, 144 3-persons, 104 4-persons, 143 5-persons, 3 7-or-more-persons
Size of nonfamily households: 295 1-person, 40 2-persons
359 married couples with children.
139 single-parent households (36 men, 103 women).
95.1% of residents of 38229 zip code speak English at home.
3.9% of residents speak Spanish at home (100% very well).
0.1% of residents speak other Indo-European language at home (100% very well).
0.5% of residents speak Asian or Pacific Island language at home (100% well).
Foreign born population: 26 (1.0%) (43.6% of them are naturalized citizens)
This zip code:
1.0%
Whole state:
5.6%
50%United Kingdom, excluding England and Scotland
42%Sweden
35%Taiwan
63%American
5%English
4%Irish
3%German
2%European
1%Welsh
0%Norwegian
Year of entry for the foreign-born population
922010 or later
02000 to 2009
111990 to 1999
13Before 1990
Facilities with environmental interests located in this zip code:
ALLEGHENY ENERGY SUPPLY COMPANY (1166 JANES MILL ROAD in GLEASON, TN)
AIR MAJOR (AIRS/AFS) AIR PROGRAM (Clean Air Markets Division Business System) CRITERIA AND HAZARDOUS AIR POLLUTANT INVENTORY (Inventory of air pollution sources) Business SIC classification: ELECTRIC SERVICES Organizations: ALLEGHENY ENERGY SUPPLY COMPANY, LLC (CONTACT/OWNER)
, ALLEGHENY ENERGY SUPPLY - GLEASON (CONTACT/OWNER)
Alternative names: GLEASON GENERATING FACILITY LLC
Housing units lacking complete plumbing facilities: 0.5% Housing units lacking complete kitchen facilities: 3.6%
48.8%Utility gas
48.3%Electricity
1.5%Wood
0.7%Fuel oil, kerosene, etc.
Population in 1990: 3,307.
Place of birth for U.S.-born residents:
This state: 1,881
Northeast: 37
Midwest: 193
South: 227
West: 95
54% of the 38229 zip code residents lived in the same house 5 years ago. Out of people who lived in different houses, 75% lived in this county. Out of people who lived in different counties, 50% lived in Tennessee.
97% of the 38229 zip code residents lived in the same house 1 year ago. Out of people who lived in different houses, 56% moved from this county. Out of people who lived in different houses, 58% moved from different county within same state.
Private vs. public school enrollment:
Students in private schools in grades 1 to 8 (elementary and middle school): 11
Here:
7.3%
Tennessee:
15.0%
Students in private schools in grades 9 to 12 (high school): 18
Here:
10.9%
Tennessee:
16.2%
Students in private undergraduate colleges: 75
Here:
66.2%
Tennessee:
23.5%
Occupation by median earnings in the past 12 months ($)
68,687Installation, maintenance, and repair occupations
66,949Architecture and engineering occupations
53,426Management occupations
46,091Health diagnosing and treating practitioners and other technical occupations
45,787Education, training, and library occupations
40,635Production occupations
Top industries in this zip code by the number of employees in 2005:
Mining: Kaolin and Ball Clay Mining (50-99 employees: 1 establishment)
Finance and Insurance: Commercial Banking (20-49: 1)
Other Services (except Public Administration): Automotive Exhaust System Repair (20-49: 1)
Other Services (except Public Administration): Commercial and Industrial Machinery and Equipment (except Automotive and Electronic) Repair and Maintenance (10-19: 1, 5-9: 1, 1-4: 1)
Accommodation and Food Services: Full-Service Restaurants (10-19: 1, 5-9: 1)
Other Services (except Public Administration): Religious Organizations (5-9: 1, 1-4: 7)
Fatal accident statistics in 2013:
Fatal accident count: 1
Vehicles involved in fatal accidents: 2
Fatal accidents caused by drunken drivers: 0
Fatalities: 1
Persons involved in fatal accidents: 1
Pedestrians involved in fatal accidents: 0
Fatal accident statistics in 2011:
Fatal accident count: 1
Vehicles involved in fatal accidents: 1
Fatal accidents caused by drunken drivers: 0
Fatalities: 1
Persons involved in fatal accidents: 4
Pedestrians involved in fatal accidents: 0
2002 - 2018 National Fire Incident Reporting System (NFIRS) incidents
Based on the data from the years 2002 - 2018 the average number of fire incidents per year is 13. The highest number of fires - 35 took place in 2004, and the least - 2 in 2013. The data has an increasing trend.
When looking into fire subcategories, the most incidents belonged to: Outside Fires (38.1%), and Structure Fires (35.4%).
Fire incident types reported to NFIRS in Zip Code 38229


+$463
-$6,038
 Nearest zip codes: 38225, 38201, 38231, 38230, 38258, 38224.


 Based on the data from the years 2002 - 2018 the average number of fire incidents per year is 13. The highest number of fires - 35 took place in 2004, and the least - 2 in 2013. The data has an increasing trend.
 When looking into fire subcategories, the most incidents belonged to: Outside Fires (38.1%), and Structure Fires (35.4%).