Estimated zip code population in 2022: 2,222 Zip code population in 2010: 1,998 Zip code population in 2000: 2,254
Houses and condos: 1,258 Renter-occupied apartments: 223
% of renters here:
24%
State:
33%
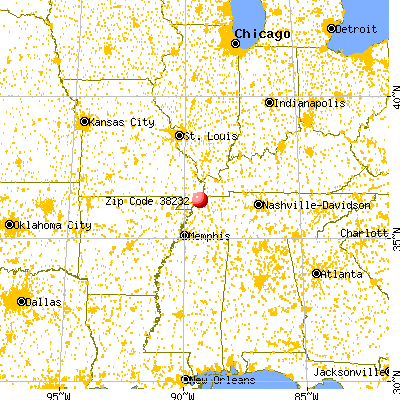
March 2022 cost of living index in zip code 38232: 77.7 (low, U.S. average is 100)
Land area: 51.1 sq. mi. Water area: 2.2 sq. mi.
Population density: 43 people per square mile
(very low).
OSM Map
General Map
Google Map
MSN Map
OSM Map
General Map
Google Map
MSN Map
OSM Map
General Map
Google Map
MSN Map
OSM Map
General Map
Google Map
MSN Map
Please wait while loading the map...
Real estate property taxes paid for housing units in 2022:
This zip code:
0.4% ($448)
Tennessee:
0.5% ($1,376)
Median real estate property taxes paid for housing units with mortgages in 2022: $642 (0.5%) Median real estate property taxes paid for housing units with no mortgage in 2022: $373 (0.4%)
Business Search- 14 Million verified businesses
Males: 1,265
(57.0%)
Females: 956
(43.0%)
For population 25 years and over in 38232:
High school or higher: 76.6%
Bachelor's degree or higher: 8.7%
Graduate or professional degree: 0.9%
Unemployed: 1.6%
Mean travel time to work (commute): 35.4 minutes
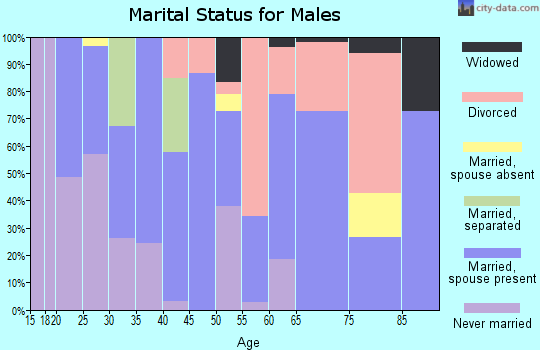
For population 15 years and over in 38232:
Never married: 17.0%
Now married: 51.5%
Separated: 1.3%
Widowed: 8.8%
Divorced: 21.3%
Zip code 38232 compared to state average:
Median house value significantly below state average.
Unemployed percentage below state average.
Black race population percentage significantly below state average.
Hispanic race population percentage below state average.
Median age significantly above state average.
Foreign-born population percentage significantly below state average.
Length of stay since moving in significantly above state average.
Number of college students significantly below state average.
Percentage of population with a bachelor's degree or higher significantly below state average.
Estimated median house/condo value in 2022: $103,564
38232:
$103,564
Tennessee:
$284,800
According to our research of Tennessee and other state lists, there were 6 registered sex offenders living in 38232 zip code as of May 28, 2024. The ratio of all residents to sex offenders in zip code 38232 is 323 to 1. The ratio of registered sex offenders to all residents in this zip code is near the state average.
Median resident age:
This zip code:
49.2 years
Tennessee median age:
39.2 years
Average household size:
This zip code:
2.4 people
Tennessee:
2.4 people
Averages for the 2020 tax year for zip code 38232, filed in 2021:
Average Adjusted Gross Income (AGI) in 2020: $42,147 (Individual Income Tax Returns)
Here:
$42,147
State:
$69,014
Salary/wage: $39,151 (reported on 77.8% of returns)
Here:
$39,151
State:
$55,872
(% of AGI for various income ranges: 982.8% for AGIs below $25k, 3407.6% for AGIs $25k-50k, 6248.0% for AGIs $50k-75k, 9702.0% for AGIs $75k-100k, 16410.0% for AGIs $100k-200k)
Taxable interest for individuals: $322 (reported on 22.2% of returns)
This zip code:
$322
Tennessee:
$1,945
(% of AGI for various income ranges: 3.8% for AGIs below $25k, 4.7% for AGIs $25k-50k, 24.0% for AGIs $50k-75k, 20.0% for AGIs $75k-100k, 16.7% for AGIs $100k-200k)
Ordinary dividends: $2,667 (reported on 7.4% of returns)
Here:
$2,667
State:
$8,105
(% of AGI for various income ranges: 11.4% for AGIs below $25k, 127.0% for AGIs $50k-75k)
Net capital gain/loss in AGI: +$10,967 (reported on 7.4% of returns)
Here:
+$10,967
State:
+$33,664
(% of AGI for various income ranges: 11.4% for AGIs below $25k, 625.0% for AGIs $50k-75k)
Profit/loss from business: +$9,077 (reported on 16.0% of returns)
Here:
+$9,077
State:
+$18,991
(% of AGI for various income ranges: 150.7% for AGIs below $25k, 94.7% for AGIs $25k-50k, 382.0% for AGIs $50k-75k, 400.0% for AGIs $75k-100k)
Taxable individual retirement arrangement distribution: $11,940 (reported on 6.2% of returns)
38232:
$11,940
Tennessee:
$20,036
(% of AGI for various income ranges: 79.0% for AGIs below $25k, 368.0% for AGIs $50k-75k)
Earned income credit: $2,574 (reported on 23.5% of returns)
Here:
$2,574
State:
$2,391
(% of AGI for various income ranges: 136.9% for AGIs below $25k, 54.1% for AGIs $25k-50k)
Percentage of individuals using paid preparers for their 2020 taxes: 91.4%
Here:
91%
State:
93%
(% for various income ranges: 91.4% for AGIs below $25k, 95.0% for AGIs $25k-50k, 92.3% for AGIs $50k-75k, 85.7% for AGIs $75k-100k, 83.3% for AGIs $100k-200k)
Averages for the 2012 tax year for zip code 38232, filed in 2013:
Average Adjusted Gross Income (AGI) in 2012: $34,071 (Individual Income Tax Returns)
Here:
$34,071
State:
$53,767
Salary/wage: $32,282 (reported on 76.9% of returns)
Here:
$32,282
State:
$45,421
(% of AGI for various income ranges: 64.5% for AGIs below $25k, 79.1% for AGIs $25k-50k, 72.4% for AGIs $50k-75k, 86.2% for AGIs $75k-100k, 59.7% for AGIs $100k-200k)
Taxable interest for individuals: $914 (reported on 28.2% of returns)
This zip code:
$914
Tennessee:
$1,732
(% of AGI for various income ranges: 1.1% for AGIs below $25k, 0.8% for AGIs $25k-50k, 0.7% for AGIs $50k-75k, 1.1% for AGIs $100k-200k)
Ordinary dividends: $1,517 (reported on 7.7% of returns)
Here:
$1,517
State:
$6,739
Net capital gain/loss in AGI: +$3,325 (reported on 5.1% of returns)
Here:
+$3,325
State:
+$19,082
Profit/loss from business: +$4,436 (reported on 17.9% of returns)
Here:
+$4,436
State:
+$15,240
(% of AGI for various income ranges: 9.0% for AGIs below $25k, 2.4% for AGIs $25k-50k)
Taxable individual retirement arrangement distribution: $7,429 (reported on 9.0% of returns)
38232:
$7,429
Tennessee:
$15,505
(% of AGI for various income ranges: 2.2% for AGIs below $25k, 1.9% for AGIs $25k-50k, 4.2% for AGIs $50k-75k)
Total itemized deductions: $17,612 (30% of AGI, reported on 10.3% of returns)
Here:
$17,612
State:
$21,976
Here:
29.6% of AGI
State:
17.8% of AGI
Charity contributions: $3,775 (reported on 5.1% of returns)
Here:
$3,775
State:
$6,709
Taxes paid: $2,162 (reported on 10.3% of returns)
38232:
$2,162
State:
$4,829
Earned income credit: $2,352 (reported on 29.5% of returns)
Here:
$2,352
State:
$2,404
(% of AGI for various income ranges: 8.5% for AGIs below $25k, 1.7% for AGIs $25k-50k)
Percentage of individuals using paid preparers for their 2012 taxes: 59.0%
Here:
59%
State:
52%
(% for various income ranges: 55.0% for AGIs below $25k, 57.1% for AGIs $25k-50k, 70.0% for AGIs $50k-75k, 75.0% for AGIs $75k-100k, 66.7% for AGIs $100k-200k)
Averages for the 2004 tax year for zip code 38232, filed in 2005:
Average Adjusted Gross Income (AGI) in 2004: $29,248 (Individual Income Tax Returns)
Here:
$29,248
State:
$44,088
Salary/wage: $28,931 (reported on 83.4% of returns)
Here:
$28,931
State:
$38,825
(% of AGI for various income ranges: 88.9% for AGIs below $10k, 70.7% for AGIs $10k-25k, 86.7% for AGIs $25k-50k, 85.9% for AGIs $50k-75k, 86.3% for AGIs $75k-100k, 67.4% for AGIs over 100k)
Taxable interest for individuals: $1,135 (reported on 32.9% of returns)
This zip code:
$1,135
Tennessee:
$1,802
(% of AGI for various income ranges: 6.4% for AGIs below $10k, 2.2% for AGIs $10k-25k, 0.4% for AGIs $25k-50k, 1.4% for AGIs $50k-75k, 1.4% for AGIs $75k-100k)
Taxable dividends: $732 (reported on 10.7% of returns)
Here:
$732
State:
$3,727
(% of AGI for various income ranges: 1.1% for AGIs below $10k, 0.6% for AGIs $10k-25k, 0.1% for AGIs $25k-50k, 0.2% for AGIs $50k-75k, 0.2% for AGIs $75k-100k)
Net capital gain/loss: +$2,707 (reported on 9.8% of returns)
Here:
+$2,707
State:
+$15,776
(% of AGI for various income ranges: 1.3% for AGIs $10k-25k, 0.2% for AGIs $25k-50k, 0.8% for AGIs $50k-75k, 2.9% for AGIs $75k-100k)
Profit/loss from business: +$3,730 (reported on 14.5% of returns)
Here:
+$3,730
State:
+$12,882
(% of AGI for various income ranges: 2.6% for AGIs below $10k, 5.8% for AGIs $10k-25k, 1.9% for AGIs $25k-50k, 0.4% for AGIs $50k-75k)
Profit/loss from farming: +$421 (reported on 5.0% of returns)
Here:
+$421
State:
-$6,038
(% of AGI for various income ranges: -1.8% for AGIs below $10k, 0.7% for AGIs $10k-25k, 0.1% for AGIs $50k-75k)
Total itemized deductions: $13,902 (26% of AGI, reported on 8.0% of returns)
Here:
$13,902
State:
$18,035
Here:
26.1% of AGI
State:
19.9% of AGI
(% of AGI for various income ranges: 18.9% for AGIs below $10k, 3.0% for AGIs $25k-50k, 3.0% for AGIs $50k-75k, 10.2% for AGIs $75k-100k)
Charity contributions deductions: $3,841 (7% of AGI, reported on 5.8% of returns)
Here:
$3,841
State:
$5,167
Here:
6.8% of AGI
State:
5.3% of AGI
Total tax: $3,244 (reported on 67.1% of returns)
38232:
$3,244
State:
$7,482
(% of AGI for various income ranges: 2.8% for AGIs below $10k, 3.5% for AGIs $10k-25k, 6.1% for AGIs $25k-50k, 8.3% for AGIs $50k-75k, 11.9% for AGIs $75k-100k, 14.9% for AGIs over 100k)
Earned income credit: $1,721 (reported on 22.5% of returns)
Here:
$1,721
State:
$1,826
Percentage of individuals using paid preparers for their 2004 taxes: 61.2%
Here:
61%
State:
60%
(% for various income ranges: 55.6% for AGIs below $10k, 60.7% for AGIs $10k-25k, 64.1% for AGIs $25k-50k, 66.0% for AGIs $50k-75k, 82.9% for AGIs $75k-100k)
Household received Food Stamps/SNAP in the past 12 months: 120 Household did not receive Food Stamps/SNAP in the past 12 months: 794
Women who had a birth in the past 12 months: 1 (1 now married, 0 unmarried) Women who did not have a birth in the past 12 months: 352 (197 now married, 155 unmarried)
Housing units in zip code 38232 with a mortgage: 208 (2 second mortgage, 2 both second mortgage and home equity loan) Houses without a mortgage: 15
Median monthly owner costs for units with a mortgage: $951 Median monthly owner costs for units without a mortgage: $333
Residents with income below the poverty level in 2022:
This zip code:
11.0%
Whole state:
13.3%
Residents with income below 50% of the poverty level in 2022:
This zip code:
6.1%
Whole state:
7.1%
Median number of rooms in houses and condos:
Here:
5.5
State:
6.5
Median number of rooms in apartments:
Here:
4.6
State:
4.4
Notable locations in this zip code not listed on our city pages
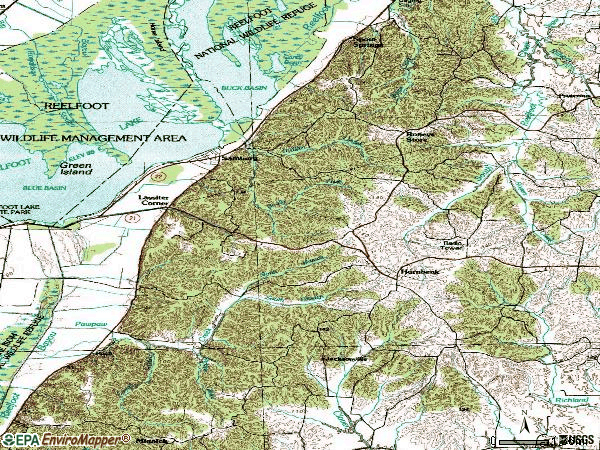
Notable locations in zip code 38232: Reelfoot Lake Campgrounds (A), Millers Boat Dock (B), Kirks Camp (C), Hornbeak Volunteer Fire Department (D), Samburg - Reelfoot Volunteer Fire Department (E). Display/hide their locations on the map
Churches in zip code 38232 include: Antioch Baptist Church (A), Cobbs Chapel (B), Webb Chapel (C), Mount Zion Church (D). Display/hide their locations on the map
Size of family households: 281 2-persons, 146 3-persons, 106 4-persons, 54 5-persons, 4 6-persons
Size of nonfamily households: 295 1-person, 23 2-persons, 2 5-persons
264 married couples with children.
90 single-parent households (13 men, 77 women).
98.7% of residents of 38232 zip code speak English at home.
0.8% of residents speak other Indo-European language at home (59% very well, 41% well).
0.3% of residents speak Asian or Pacific Island language at home (83% well, 17% not well).
Foreign born population: 6 (0.3%) (0.0% of them are naturalized citizens)
:
0.3%
Whole state:
5.6%
100%Thailand
36%Irish
29%American
16%English
3%Romanian
3%German
3%Scottish
2%French
Year of entry for the foreign-born population
252010 or later
02000 to 2009
91990 to 1999
9Before 1990
Facilities with environmental interests located in this zip code:
BLACK OAK ELEMENTARY SCHOOL (365 N SHAWTOWN RD in HORNBEAK, TN)
(National Center for Education Statistics) - STATE ID-0007 Organizations: OBION COUNTY SCHOOL DISTRICT (SCHOOL DISTRICT)
Housing units lacking complete kitchen facilities: 1.5%
54.7%Electricity
37.4%Utility gas
7.2%Bottled, tank, or LP gas
0.8%Wood
Population in 1990: 3,042.
Place of birth for U.S.-born residents:
This state: 1,606
Midwest: 197
South: 292
West: 63
54% of the 38232 zip code residents lived in the same house 5 years ago. Out of people who lived in different houses, 57% lived in this county. Out of people who lived in different counties, 50% lived in Tennessee.
91% of the 38232 zip code residents lived in the same house 1 year ago. Out of people who lived in different houses, 71% moved from this county. Out of people who lived in different houses, 16% moved from different county within same state. Out of people who lived in different houses, 1% moved from different state. Out of people who lived in different houses, 9% moved from abroad.
Private vs. public school enrollment:
Students in private schools in grades 1 to 8 (elementary and middle school):
Here:
0.0%
Tennessee:
15.0%
Students in private schools in grades 9 to 12 (high school): 38
Here:
21.4%
Tennessee:
16.2%
Students in private undergraduate colleges:
Here:
0.0%
Tennessee:
23.5%
Occupation by median earnings in the past 12 months ($)
95,667Transportation occupations
62,063Construction and extraction occupations
54,909Production occupations
52,720Health diagnosing and treating practitioners and other technical occupations
41,167Health technologists and technicians
39,323Business and financial operations occupations
Top industries in this zip code by the number of employees in 2005:
Construction: New Single-Family Housing Construction (except Operative Builders) (10-19 employees: 1 establishment)
Other Services (except Public Administration): Religious Organizations (1-4: 1)
Finance and Insurance: Commercial Banking (1-4: 1)
Accommodation and Food Services: Hotels (except Casino Hotels) and Motels (1-4: 1)
Accommodation and Food Services: RV (Recreational Vehicle) Parks and Campgrounds (1-4: 1)
Health Care and Social Assistance: Other Individual and Family Services (1-4: 1)
Real Estate and Rental and Leasing: Office Machinery and Equipment Rental and Leasing (1-4: 1)
Fatal accident statistics in 2013:
Fatal accident count: 1
Vehicles involved in fatal accidents: 1
Fatal accidents caused by drunken drivers: 0
Fatalities: 2
Persons involved in fatal accidents: 3
Pedestrians involved in fatal accidents: 0
Fatal accident statistics in 2012:
Fatal accident count: 3
Vehicles involved in fatal accidents: 5
Fatal accidents caused by drunken drivers: 1
Fatalities: 5
Persons involved in fatal accidents: 9
Pedestrians involved in fatal accidents: 0
2002 - 2018 National Fire Incident Reporting System (NFIRS) incidents
Based on the data from the years 2002 - 2018 the average number of fire incidents per year is 22. The highest number of fires - 40 took place in 2008, and the least - 3 in 2002. The data has an increasing trend.
When looking into fire subcategories, the most incidents belonged to: Structure Fires (50.8%), and Outside Fires (36.1%).
Fire incident types reported to NFIRS in Zip Code 38232


+$421
-$6,038
(% of AGI for various income ranges: -1.8% for AGIs below $10k, 0.7% for AGIs $10k-25k, 0.1% for AGIs $50k-75k)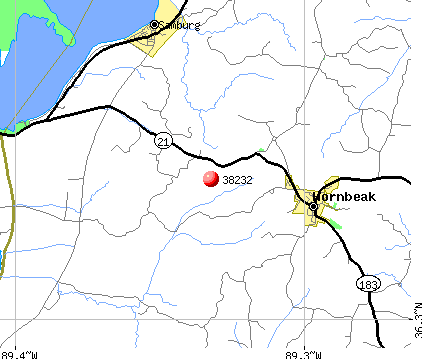 Nearest zip codes: 38254, 38240, 38260, 38077, 38079, 38259.


 Based on the data from the years 2002 - 2018 the average number of fire incidents per year is 22. The highest number of fires - 40 took place in 2008, and the least - 3 in 2002. The data has an increasing trend.
 When looking into fire subcategories, the most incidents belonged to: Structure Fires (50.8%), and Outside Fires (36.1%).