Estimated zip code population in 2022: 3,778 Zip code population in 2010: 3,204 Zip code population in 2000: 2,836
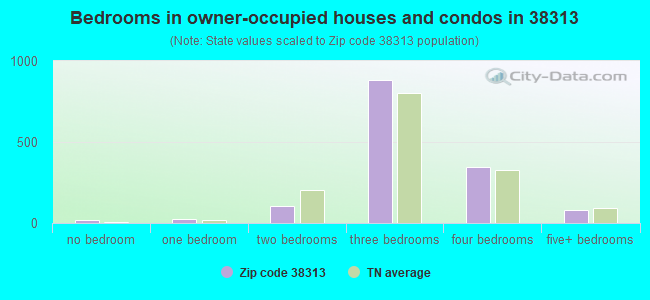
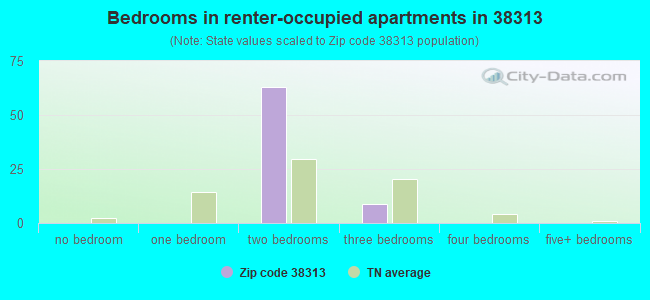
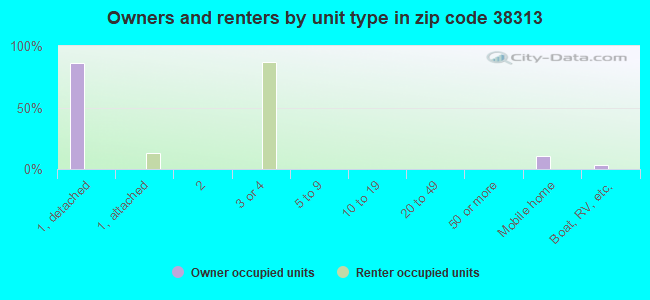
Houses and condos: 1,608 Renter-occupied apartments: 71
% of renters here:
5%
State:
33%
March 2022 cost of living index in zip code 38313: 76.5 (low, U.S. average is 100)
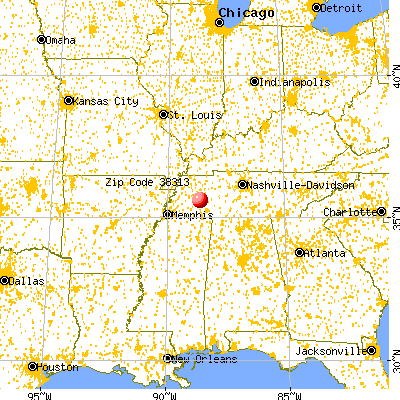
Land area: 72.7 sq. mi. Water area: 0.0 sq. mi.
Population density: 52 people per square mile
(very low).
OSM Map
General Map
Google Map
MSN Map
OSM Map
General Map
Google Map
MSN Map
OSM Map
General Map
Google Map
MSN Map
OSM Map
General Map
Google Map
MSN Map
Please wait while loading the map...
Real estate property taxes paid for housing units in 2022:
This zip code:
0.4% ($877)
Tennessee:
0.5% ($1,376)
Median real estate property taxes paid for housing units with mortgages in 2022: $885 (0.5%) Median real estate property taxes paid for housing units with no mortgage in 2022: $865 (0.4%)
Business Search- 14 Million verified businesses
Males: 1,822
(48.2%)
Females: 1,955
(51.8%)
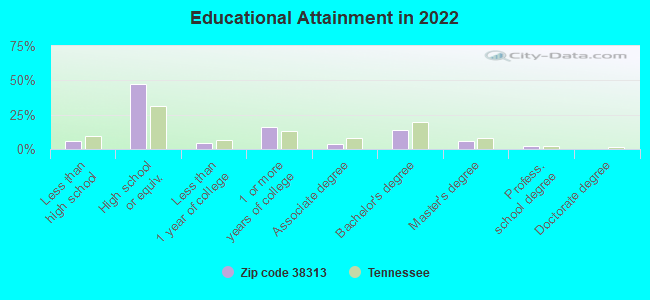
For population 25 years and over in 38313:
High school or higher: 93.2%
Bachelor's degree or higher: 21.9%
Graduate or professional degree: 7.9%
Unemployed: 2.2%
Mean travel time to work (commute): 25.5 minutes
For population 15 years and over in 38313:
Never married: 24.3%
Now married: 59.2%
Separated: 1.0%
Widowed: 5.6%
Divorced: 9.9%
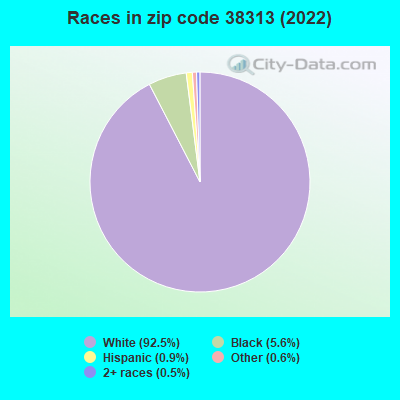
Zip code 38313 compared to state average:
Black race population percentage below state average.
Hispanic race population percentage significantly below state average.
Foreign-born population percentage significantly below state average.
Renting percentage significantly below state average.
Length of stay since moving in significantly above state average.
Estimated median house/condo value in 2022: $206,391
38313:
$206,391
Tennessee:
$284,800
According to our research of Tennessee and other state lists, there were 8 registered sex offenders living in 38313 zip code as of May 28, 2024. The ratio of all residents to sex offenders in zip code 38313 is 327 to 1. The ratio of registered sex offenders to all residents in this zip code is near the state average.
Median resident age:
This zip code:
42.0 years
Tennessee median age:
39.2 years
Average household size:
This zip code:
2.5 people
Tennessee:
2.4 people
Averages for the 2020 tax year for zip code 38313, filed in 2021:
Average Adjusted Gross Income (AGI) in 2020: $56,801 (Individual Income Tax Returns)
Here:
$56,801
State:
$69,014
Salary/wage: $53,456 (reported on 81.0% of returns)
Here:
$53,456
State:
$55,872
(% of AGI for various income ranges: 1032.4% for AGIs below $25k, 3464.0% for AGIs $25k-50k, 6035.6% for AGIs $50k-75k, 10314.2% for AGIs $75k-100k, 12615.4% for AGIs $100k-200k)
Taxable interest for individuals: $638 (reported on 29.6% of returns)
This zip code:
$638
Tennessee:
$1,945
(% of AGI for various income ranges: 7.9% for AGIs below $25k, 15.0% for AGIs $25k-50k, 18.3% for AGIs $50k-75k, 11.7% for AGIs $75k-100k, 47.7% for AGIs $100k-200k)
Ordinary dividends: $2,686 (reported on 9.9% of returns)
Here:
$2,686
State:
$8,105
(% of AGI for various income ranges: 8.4% for AGIs below $25k, 5.3% for AGIs $25k-50k, 26.7% for AGIs $50k-75k, 80.8% for AGIs $100k-200k)
Net capital gain/loss in AGI: +$9,925 (reported on 8.5% of returns)
Here:
+$9,925
State:
+$33,664
(% of AGI for various income ranges: 10.3% for AGIs below $25k, 5.3% for AGIs $25k-50k, 875.4% for AGIs $100k-200k)
Profit/loss from business: +$12,615 (reported on 14.1% of returns)
Here:
+$12,615
State:
+$18,991
(% of AGI for various income ranges: 93.7% for AGIs below $25k, 196.3% for AGIs $25k-50k, 238.9% for AGIs $50k-75k, 349.2% for AGIs $75k-100k, 560.8% for AGIs $100k-200k)
Taxable individual retirement arrangement distribution: $18,450 (reported on 7.0% of returns)
38313:
$18,450
Tennessee:
$20,036
(% of AGI for various income ranges: 123.9% for AGIs below $25k, 167.2% for AGIs $50k-75k, 825.4% for AGIs $100k-200k)
Total itemized deductions: $32,300 (reported on 2.1% of returns)
Here:
$32,300
State:
$40,136
(% of AGI for various income ranges: 538.3% for AGIs $50k-75k)
Charity contributions: $9,300 (reported on 2.1% of returns)
Here:
$9,300
State:
$19,852
(% of AGI for various income ranges: 155.0% for AGIs $50k-75k)
Taxes paid: $4,833 (reported on 2.1% of returns)
38313:
$4,833
State:
$6,038
(% of AGI for various income ranges: 80.6% for AGIs $50k-75k)
Earned income credit: $2,307 (reported on 19.0% of returns)
Here:
$2,307
State:
$2,391
(% of AGI for various income ranges: 92.9% for AGIs below $25k, 90.0% for AGIs $25k-50k)
Percentage of individuals using paid preparers for their 2020 taxes: 94.4%
Here:
94%
State:
93%
(% for various income ranges: 93.8% for AGIs below $25k, 97.1% for AGIs $25k-50k, 90.9% for AGIs $50k-75k, 94.1% for AGIs $75k-100k, 94.1% for AGIs $100k-200k, 100.0% for AGIs over 200k)
Averages for the 2012 tax year for zip code 38313, filed in 2013:
Average Adjusted Gross Income (AGI) in 2012: $45,273 (Individual Income Tax Returns)
Here:
$45,273
State:
$53,767
Salary/wage: $40,483 (reported on 88.3% of returns)
Here:
$40,483
State:
$45,421
(% of AGI for various income ranges: 74.3% for AGIs below $25k, 82.8% for AGIs $25k-50k, 86.8% for AGIs $50k-75k, 81.0% for AGIs $75k-100k, 69.5% for AGIs $100k-200k)
Taxable interest for individuals: $770 (reported on 24.1% of returns)
This zip code:
$770
Tennessee:
$1,732
(% of AGI for various income ranges: 0.5% for AGIs below $25k, 0.6% for AGIs $25k-50k, 0.2% for AGIs $50k-75k, 0.6% for AGIs $75k-100k, 0.3% for AGIs $100k-200k)
Ordinary dividends: $1,750 (reported on 11.7% of returns)
Here:
$1,750
State:
$6,739
(% of AGI for various income ranges: 0.2% for AGIs below $25k, 0.1% for AGIs $25k-50k, 0.2% for AGIs $50k-75k, 1.0% for AGIs $75k-100k, 0.6% for AGIs $100k-200k)
Net capital gain/loss in AGI: +$3,283 (reported on 8.8% of returns)
Here:
+$3,283
State:
+$19,082
(% of AGI for various income ranges: 0.4% for AGIs $25k-50k, 1.4% for AGIs $75k-100k, 1.0% for AGIs $100k-200k)
Profit/loss from business: +$11,600 (reported on 14.6% of returns)
Here:
+$11,600
State:
+$15,240
(% of AGI for various income ranges: 6.8% for AGIs below $25k, 5.3% for AGIs $25k-50k, 0.8% for AGIs $50k-75k, 3.9% for AGIs $75k-100k, 3.3% for AGIs $100k-200k)
Taxable individual retirement arrangement distribution: $8,042 (reported on 8.8% of returns)
38313:
$8,042
Tennessee:
$15,505
(% of AGI for various income ranges: 3.6% for AGIs below $25k, 3.0% for AGIs $25k-50k, 2.3% for AGIs $75k-100k)
Total itemized deductions: $19,626 (22% of AGI, reported on 13.9% of returns)
Here:
$19,626
State:
$21,976
Here:
21.9% of AGI
State:
17.8% of AGI
(% of AGI for various income ranges: 3.8% for AGIs below $25k, 4.2% for AGIs $25k-50k, 4.9% for AGIs $50k-75k, 6.5% for AGIs $75k-100k, 9.3% for AGIs $100k-200k)
Charity contributions: $5,640 (reported on 10.9% of returns)
Here:
$5,640
State:
$6,709
(% of AGI for various income ranges: 1.0% for AGIs $25k-50k, 1.0% for AGIs $50k-75k, 1.1% for AGIs $75k-100k, 2.8% for AGIs $100k-200k)
Taxes paid: $3,289 (reported on 13.9% of returns)
38313:
$3,289
State:
$4,829
(% of AGI for various income ranges: 0.5% for AGIs below $25k, 0.4% for AGIs $25k-50k, 0.7% for AGIs $50k-75k, 0.9% for AGIs $75k-100k, 2.1% for AGIs $100k-200k)
Earned income credit: $2,171 (reported on 20.4% of returns)
Here:
$2,171
State:
$2,404
(% of AGI for various income ranges: 6.4% for AGIs below $25k, 1.2% for AGIs $25k-50k)
Percentage of individuals using paid preparers for their 2012 taxes: 52.6%
Here:
53%
State:
52%
(% for various income ranges: 50.0% for AGIs below $25k, 51.3% for AGIs $25k-50k, 52.4% for AGIs $50k-75k, 57.1% for AGIs $75k-100k, 66.7% for AGIs $100k-200k)
Averages for the 2004 tax year for zip code 38313, filed in 2005:
Average Adjusted Gross Income (AGI) in 2004: $36,626 (Individual Income Tax Returns)
Here:
$36,626
State:
$44,088
Salary/wage: $34,334 (reported on 88.5% of returns)
Here:
$34,334
State:
$38,825
(% of AGI for various income ranges: 86.8% for AGIs below $10k, 80.0% for AGIs $10k-25k, 92.4% for AGIs $25k-50k, 89.5% for AGIs $50k-75k, 82.1% for AGIs $75k-100k, 55.8% for AGIs over 100k)
Taxable interest for individuals: $879 (reported on 31.2% of returns)
This zip code:
$879
Tennessee:
$1,802
(% of AGI for various income ranges: 2.5% for AGIs below $10k, 1.5% for AGIs $10k-25k, 0.5% for AGIs $25k-50k, 0.5% for AGIs $50k-75k, 0.2% for AGIs $75k-100k, 1.4% for AGIs over 100k)
Taxable dividends: $2,195 (reported on 13.4% of returns)
Here:
$2,195
State:
$3,727
(% of AGI for various income ranges: 1.4% for AGIs below $10k, 0.5% for AGIs $10k-25k, 0.3% for AGIs $25k-50k, 0.5% for AGIs $50k-75k, 0.2% for AGIs $75k-100k, 3.2% for AGIs over 100k)
Net capital gain/loss: +$5,504 (reported on 9.0% of returns)
Here:
+$5,504
State:
+$15,776
(% of AGI for various income ranges: -0.9% for AGIs below $10k, -0.1% for AGIs $10k-25k, 0.1% for AGIs $25k-50k, 0.5% for AGIs $50k-75k, 1.3% for AGIs $75k-100k, 6.9% for AGIs over 100k)
Profit/loss from business: +$8,440 (reported on 15.4% of returns)
Here:
+$8,440
State:
+$12,882
(% of AGI for various income ranges: 1.7% for AGIs below $10k, 7.3% for AGIs $10k-25k, 2.1% for AGIs $25k-50k, 2.5% for AGIs $50k-75k, 3.4% for AGIs $75k-100k, 5.8% for AGIs over 100k)
IRA payment deduction: $2,227 (reported on 1.7% of returns)
38313:
$2,227
Tennessee:
$2,934
Total itemized deductions: $15,427 (23% of AGI, reported on 16.8% of returns)
Here:
$15,427
State:
$18,035
Here:
23.5% of AGI
State:
19.9% of AGI
(% of AGI for various income ranges: 5.2% for AGIs $10k-25k, 6.7% for AGIs $25k-50k, 8.0% for AGIs $50k-75k, 7.4% for AGIs $75k-100k, 8.8% for AGIs over 100k)
Charity contributions deductions: $4,246 (6% of AGI, reported on 13.5% of returns)
Here:
$4,246
State:
$5,167
Here:
6.1% of AGI
State:
5.3% of AGI
(% of AGI for various income ranges: 0.6% for AGIs $10k-25k, 1.3% for AGIs $25k-50k, 1.6% for AGIs $50k-75k, 2.3% for AGIs $75k-100k, 2.3% for AGIs over 100k)
Total tax: $4,484 (reported on 74.2% of returns)
38313:
$4,484
State:
$7,482
(% of AGI for various income ranges: 2.5% for AGIs below $10k, 4.2% for AGIs $10k-25k, 6.1% for AGIs $25k-50k, 8.4% for AGIs $50k-75k, 11.2% for AGIs $75k-100k, 19.1% for AGIs over 100k)
Earned income credit: $1,734 (reported on 20.0% of returns)
Here:
$1,734
State:
$1,826
Percentage of individuals using paid preparers for their 2004 taxes: 62.4%
Here:
62%
State:
60%
(% for various income ranges: 56.8% for AGIs below $10k, 61.9% for AGIs $10k-25k, 63.3% for AGIs $25k-50k, 67.0% for AGIs $50k-75k, 63.2% for AGIs $75k-100k, 68.3% for AGIs over 100k)
Household received Food Stamps/SNAP in the past 12 months: 45 Household did not receive Food Stamps/SNAP in the past 12 months: 1,481
Women who had a birth in the past 12 months: 37 (38 now married, 0 unmarried) Women who did not have a birth in the past 12 months: 884 (435 now married, 449 unmarried)
Housing units in zip code 38313 with a mortgage: 734 (62 second mortgage, 28 both second mortgage and home equity loan) Houses without a mortgage: 9
Median monthly owner costs for units with a mortgage: $1,093 Median monthly owner costs for units without a mortgage: $437
Residents with income below the poverty level in 2022:
This zip code:
11.8%
Whole state:
13.3%
Residents with income below 50% of the poverty level in 2022:
This zip code:
9.1%
Whole state:
7.1%
Median number of rooms in houses and condos:
Here:
6.3
State:
6.5
Median number of rooms in apartments:
Here:
4.6
State:
4.4
Notable locations in this zip code not listed on our city pages
Notable locations in zip code 38313: Henderson County Fire Department Station 11 (A), Chester County Fire Department / Hill Top Volunteer Fire Department Station 520 (B), Madison County Fire Department Station 4 (C). Display/hide their locations on the map
Churches in zip code 38313 include: Liberty Church (A), Union Grove Church (B), Zion Hill Church (C), Antioch Church (D), Beech Bluff Church (E), Mount Pleasant Church (F), Claybrook Church (G), Diamond Grove Church (H), Mason Wells Church (I). Display/hide their locations on the map
Streams, rivers, and creeks: Finger Creek (A), Cotton Grove Creek (B), Bell Branch (C), Middle Fork Creek (D), Spencer Creek (E). Display/hide their locations on the map
In group quarters: 1 (-1 institutionalized population)
Size of family households: 713 2-persons, 126 3-persons, 329 4-persons, 47 5-persons, 25 6-persons, 21 7-or-more-persons
Size of nonfamily households: 183 1-person, 71 2-persons
497 married couples with children.
120 single-parent households (79 men, 41 women).
99.8% of residents of 38313 zip code speak English at home.
Foreign born population: 0 (0.0%)
:
0.0%
Whole state:
5.6%
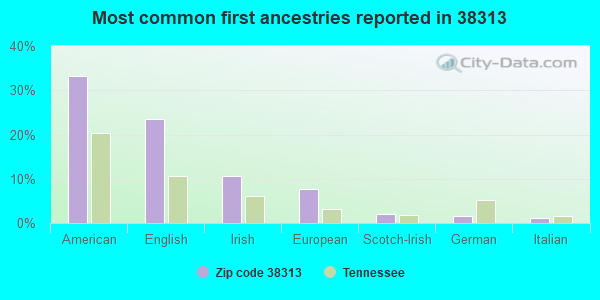
33%American
23%English
11%Irish
8%European
2%Scotch-Irish
2%German
1%Italian
Year of entry for the foreign-born population
02010 or later
02000 to 2009
01990 to 1999
10Before 1990
Facilities with environmental interests located in this zip code:
BEECH BLUFF ELEMENTARY SCHOOL (4488 BEECH BLUFF RD in BEECH BLUFF, TN)
(Geographic Names Information System) (National Center for Education Statistics) - STATE ID-0016 Organizations: JACKSON-MADISON CONSOLIDATED (SCHOOL DISTRICT)
Housing units lacking complete plumbing facilities: 1.3%
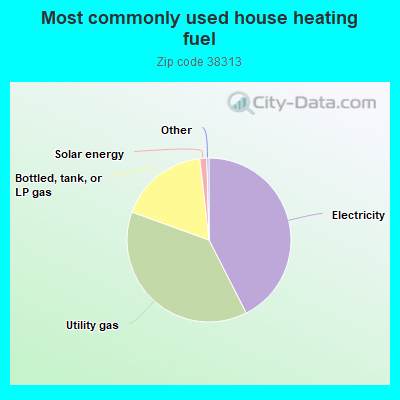
42.6%Electricity
38.1%Utility gas
17.7%Bottled, tank, or LP gas
1.4%Solar energy
Population in 1990: 2,682. Population change in the 1990s: +154 (+5.7%).
Place of birth for U.S.-born residents:
This state: 3,062
Northeast: 53
Midwest: 136
South: 428
West: 38
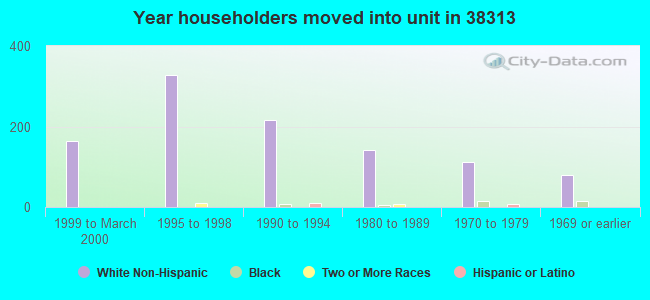
63% of the 38313 zip code residents lived in the same house 5 years ago. Out of people who lived in different houses, 62% lived in this county. Out of people who lived in different counties, 50% lived in Tennessee.
97% of the 38313 zip code residents lived in the same house 1 year ago. Out of people who lived in different houses, 20% moved from this county. Out of people who lived in different houses, 86% moved from different county within same state. Out of people who lived in different houses, 11% moved from different state.
Private vs. public school enrollment:
Students in private schools in grades 1 to 8 (elementary and middle school): 20
Here:
5.9%
Tennessee:
15.0%
Students in private schools in grades 9 to 12 (high school): 53
Here:
44.7%
Tennessee:
16.2%
Students in private undergraduate colleges: 23
Here:
47.6%
Tennessee:
23.5%
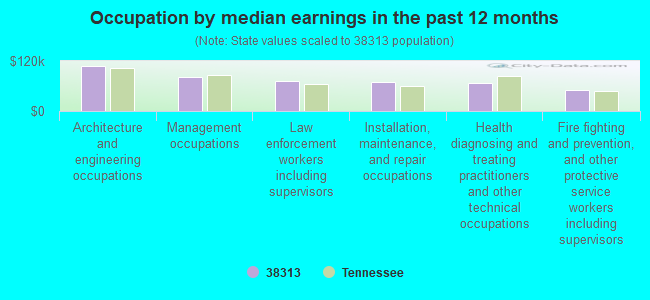
Occupation by median earnings in the past 12 months ($)
108,634Architecture and engineering occupations
80,852Management occupations
72,154Law enforcement workers including supervisors
70,093Installation, maintenance, and repair occupations
66,095Health diagnosing and treating practitioners and other technical occupations
51,375Fire fighting and prevention, and other protective service workers including supervisors
Top industries in this zip code by the number of employees in 2005:
Other Services (except Public Administration): Religious Organizations (5-9 employees: 1 establishment, 1-4 employees: 3 establishments)
Construction: All Other Specialty Trade Contractors (5-9: 1, 1-4: 1)
Administrative and Support and Waste Management and Remediation Services: Exterminating and Pest Control Services (5-9: 1)
Construction: Siding Contractors (5-9: 1)
Accommodation and Food Services: Limited-Service Restaurants (5-9: 1)
Construction: Masonry Contractors (1-4: 2)
Real Estate and Rental and Leasing: Offices of Real Estate Agents and Brokers (1-4: 1)
Professional, Scientific, and Technical Services: Other Accounting Services (1-4: 1)
Other Services (except Public Administration): Commercial and Industrial Machinery and Equipment (except Automotive and Electronic) Repair and Maintenance (1-4: 1)
Construction: Water and Sewer Line and Related Structures Construction (1-4: 1)
Fatal accident statistics in 2014:
Fatal accident count: 1
Vehicles involved in fatal accidents: 1
Fatal accidents caused by drunken drivers: 1
Fatalities: 1
Persons involved in fatal accidents: 1
Pedestrians involved in fatal accidents: 0
Fatal accident statistics in 2011:
Fatal accident count: 2
Vehicles involved in fatal accidents: 2
Fatal accidents caused by drunken drivers: 2
Fatalities: 2
Persons involved in fatal accidents: 2
Pedestrians involved in fatal accidents: 3
Home Mortgage Disclosure Act Aggregated Statistics For Year 2009 (Based on 4 partial tracts)
A) FHA, FSA/RHS & VA Home Purchase Loans
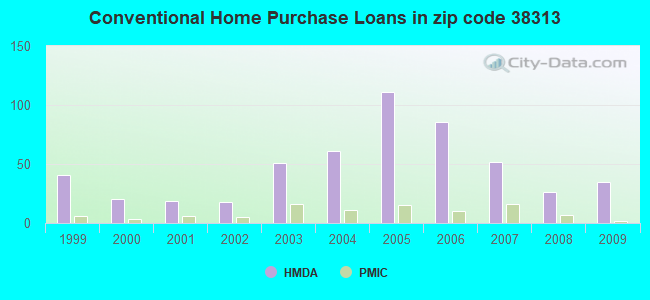
B) Conventional Home Purchase Loans
C) Refinancings
D) Home Improvement Loans
F) Non-occupant Loans on < 5 Family Dwellings (A B C & D)
G) Loans On Manufactured Home Dwelling (A B C & D)
Number
Average Value
Number
Average Value
Number
Average Value
Number
Average Value
Number
Average Value
Number
Average Value
LOANS ORIGINATED
26
$124,802
35
$124,976
86
$123,658
6
$57,685
12
$57,641
7
$42,980
APPLICATIONS APPROVED, NOT ACCEPTED
1
$221,480
1
$196,270
5
$113,640
0
$0
0
$0
1
$69,420
APPLICATIONS DENIED
9
$99,091
3
$75,593
22
$123,523
6
$29,312
2
$42,305
4
$60,345
APPLICATIONS WITHDRAWN
2
$102,040
4
$137,660
23
$126,161
1
$32,300
0
$0
1
$70,190
FILES CLOSED FOR INCOMPLETENESS
2
$129,730
0
$0
5
$150,570
0
$0
0
$0
0
$0
Aggregated Statistics For Year 2008 (Based on 4 partial tracts)
A) FHA, FSA/RHS & VA Home Purchase Loans
B) Conventional Home Purchase Loans
C) Refinancings
D) Home Improvement Loans
F) Non-occupant Loans on < 5 Family Dwellings (A B C & D)
G) Loans On Manufactured Home Dwelling (A B C & D)
Number
Average Value
Number
Average Value
Number
Average Value
Number
Average Value
Number
Average Value
Number
Average Value
LOANS ORIGINATED
22
$121,110
26
$86,191
64
$111,503
9
$70,203
15
$71,850
10
$58,074
APPLICATIONS APPROVED, NOT ACCEPTED
0
$0
3
$122,637
6
$124,633
2
$67,285
0
$0
2
$78,855
APPLICATIONS DENIED
9
$96,462
6
$95,650
48
$110,835
10
$19,183
2
$102,445
10
$53,258
APPLICATIONS WITHDRAWN
2
$134,495
3
$106,683
18
$125,644
0
$0
2
$83,055
2
$68,680
FILES CLOSED FOR INCOMPLETENESS
1
$94,210
0
$0
4
$85,530
0
$0
0
$0
0
$0
Aggregated Statistics For Year 2007 (Based on 4 partial tracts)
A) FHA, FSA/RHS & VA Home Purchase Loans
B) Conventional Home Purchase Loans
C) Refinancings
D) Home Improvement Loans
F) Non-occupant Loans on < 5 Family Dwellings (A B C & D)
G) Loans On Manufactured Home Dwelling (A B C & D)
Number
Average Value
Number
Average Value
Number
Average Value
Number
Average Value
Number
Average Value
Number
Average Value
LOANS ORIGINATED
11
$114,915
52
$113,133
51
$109,031
8
$37,025
10
$71,368
12
$51,452
APPLICATIONS APPROVED, NOT ACCEPTED
0
$0
5
$94,044
16
$89,644
5
$44,350
0
$0
2
$56,580
APPLICATIONS DENIED
3
$65,200
14
$90,454
68
$96,868
9
$63,382
0
$0
10
$63,833
APPLICATIONS WITHDRAWN
1
$86,350
4
$95,198
22
$106,935
0
$0
1
$36,160
1
$58,850
FILES CLOSED FOR INCOMPLETENESS
0
$0
4
$151,832
10
$115,871
0
$0
0
$0
0
$0
Aggregated Statistics For Year 2006 (Based on 4 partial tracts)
A) FHA, FSA/RHS & VA Home Purchase Loans
B) Conventional Home Purchase Loans
C) Refinancings
D) Home Improvement Loans
F) Non-occupant Loans on < 5 Family Dwellings (A B C & D)
G) Loans On Manufactured Home Dwelling (A B C & D)
Number
Average Value
Number
Average Value
Number
Average Value
Number
Average Value
Number
Average Value
Number
Average Value
LOANS ORIGINATED
20
$115,218
86
$91,647
66
$101,344
16
$29,753
24
$68,638
9
$52,169
APPLICATIONS APPROVED, NOT ACCEPTED
0
$0
13
$79,070
16
$82,045
5
$41,900
2
$46,610
3
$40,230
APPLICATIONS DENIED
2
$43,720
24
$74,150
71
$101,511
8
$38,096
6
$52,438
9
$47,197
APPLICATIONS WITHDRAWN
1
$186,200
11
$104,905
32
$102,969
3
$55,263
2
$80,885
1
$126,750
FILES CLOSED FOR INCOMPLETENESS
0
$0
3
$78,207
9
$117,994
0
$0
0
$0
0
$0
Aggregated Statistics For Year 2005 (Based on 4 partial tracts)
A) FHA, FSA/RHS & VA Home Purchase Loans
B) Conventional Home Purchase Loans
C) Refinancings
D) Home Improvement Loans
F) Non-occupant Loans on < 5 Family Dwellings (A B C & D)
G) Loans On Manufactured Home Dwelling (A B C & D)
Number
Average Value
Number
Average Value
Number
Average Value
Number
Average Value
Number
Average Value
Number
Average Value
LOANS ORIGINATED
19
$91,877
111
$93,794
76
$92,745
14
$44,948
18
$54,863
16
$51,804
APPLICATIONS APPROVED, NOT ACCEPTED
0
$0
15
$73,991
20
$78,556
2
$35,140
1
$156,360
8
$41,890
APPLICATIONS DENIED
3
$79,073
28
$87,853
85
$89,819
10
$33,548
5
$67,282
16
$56,746
APPLICATIONS WITHDRAWN
1
$128,510
33
$87,595
45
$101,935
4
$155,470
4
$63,940
3
$41,380
FILES CLOSED FOR INCOMPLETENESS
0
$0
1
$78,090
14
$109,793
0
$0
0
$0
0
$0
Aggregated Statistics For Year 2004 (Based on 4 partial tracts)
A) FHA, FSA/RHS & VA Home Purchase Loans
B) Conventional Home Purchase Loans
C) Refinancings
D) Home Improvement Loans
F) Non-occupant Loans on < 5 Family Dwellings (A B C & D)
G) Loans On Manufactured Home Dwelling (A B C & D)
Number
Average Value
Number
Average Value
Number
Average Value
Number
Average Value
Number
Average Value
Number
Average Value
LOANS ORIGINATED
17
$99,931
61
$96,972
95
$93,055
7
$49,974
8
$65,210
14
$51,847
APPLICATIONS APPROVED, NOT ACCEPTED
1
$71,480
12
$83,922
24
$91,628
1
$43,600
0
$0
4
$44,992
APPLICATIONS DENIED
3
$66,650
20
$76,910
69
$93,043
9
$28,543
4
$92,772
12
$52,925
APPLICATIONS WITHDRAWN
1
$110,320
5
$86,498
41
$84,824
3
$55,323
2
$47,105
4
$70,158
FILES CLOSED FOR INCOMPLETENESS
0
$0
3
$90,417
8
$88,345
0
$0
0
$0
1
$47,520
Aggregated Statistics For Year 2003 (Based on 4 partial tracts)
A) FHA, FSA/RHS & VA Home Purchase Loans
B) Conventional Home Purchase Loans
C) Refinancings
D) Home Improvement Loans
F) Non-occupant Loans on < 5 Family Dwellings (A B C & D)
Number
Average Value
Number
Average Value
Number
Average Value
Number
Average Value
Number
Average Value
LOANS ORIGINATED
22
$99,164
51
$94,496
187
$89,531
12
$27,812
14
$62,256
APPLICATIONS APPROVED, NOT ACCEPTED
1
$71,480
9
$135,911
26
$100,550
1
$12,950
2
$46,485
APPLICATIONS DENIED
1
$119,880
12
$57,656
68
$88,734
9
$18,594
3
$101,703
APPLICATIONS WITHDRAWN
1
$117,350
11
$75,905
31
$91,226
0
$0
2
$74,335
FILES CLOSED FOR INCOMPLETENESS
0
$0
1
$108,260
7
$81,780
0
$0
0
$0
Aggregated Statistics For Year 2002 (Based on 2 partial tracts)
A) FHA, FSA/RHS & VA Home Purchase Loans
B) Conventional Home Purchase Loans
C) Refinancings
D) Home Improvement Loans
F) Non-occupant Loans on < 5 Family Dwellings (A B C & D)
Number
Average Value
Number
Average Value
Number
Average Value
Number
Average Value
Number
Average Value
LOANS ORIGINATED
4
$82,852
18
$78,631
55
$79,587
9
$15,544
6
$52,662
APPLICATIONS APPROVED, NOT ACCEPTED
0
$0
0
$0
11
$71,395
0
$0
0
$0
APPLICATIONS DENIED
2
$54,030
7
$45,897
35
$67,164
2
$28,220
0
$0
APPLICATIONS WITHDRAWN
0
$0
3
$65,123
13
$68,092
0
$0
0
$0
FILES CLOSED FOR INCOMPLETENESS
0
$0
0
$0
3
$138,930
0
$0
0
$0
Aggregated Statistics For Year 2001 (Based on 2 partial tracts)
A) FHA, FSA/RHS & VA Home Purchase Loans
B) Conventional Home Purchase Loans
C) Refinancings
D) Home Improvement Loans
F) Non-occupant Loans on < 5 Family Dwellings (A B C & D)
Number
Average Value
Number
Average Value
Number
Average Value
Number
Average Value
Number
Average Value
LOANS ORIGINATED
6
$77,183
19
$73,807
44
$79,837
11
$14,296
7
$38,247
APPLICATIONS APPROVED, NOT ACCEPTED
0
$0
7
$38,661
10
$75,206
3
$15,277
1
$27,980
APPLICATIONS DENIED
0
$0
9
$40,897
30
$60,895
5
$10,710
2
$29,910
APPLICATIONS WITHDRAWN
0
$0
2
$68,740
15
$71,073
1
$32,800
0
$0
FILES CLOSED FOR INCOMPLETENESS
0
$0
0
$0
2
$73,805
0
$0
0
$0
Aggregated Statistics For Year 2000 (Based on 2 partial tracts)
A) FHA, FSA/RHS & VA Home Purchase Loans
B) Conventional Home Purchase Loans
C) Refinancings
D) Home Improvement Loans
F) Non-occupant Loans on < 5 Family Dwellings (A B C & D)
Number
Average Value
Number
Average Value
Number
Average Value
Number
Average Value
Number
Average Value
LOANS ORIGINATED
5
$77,474
20
$67,319
22
$64,313
8
$14,532
2
$42,450
APPLICATIONS APPROVED, NOT ACCEPTED
0
$0
4
$65,125
10
$84,468
1
$14,950
0
$0
APPLICATIONS DENIED
0
$0
8
$59,878
23
$60,908
5
$29,620
1
$41,490
APPLICATIONS WITHDRAWN
0
$0
1
$44,380
19
$59,310
1
$18,810
0
$0
FILES CLOSED FOR INCOMPLETENESS
0
$0
0
$0
0
$0
0
$0
0
$0
Aggregated Statistics For Year 1999 (Based on 2 partial tracts)
A) FHA, FSA/RHS & VA Home Purchase Loans
B) Conventional Home Purchase Loans
C) Refinancings
D) Home Improvement Loans
F) Non-occupant Loans on < 5 Family Dwellings (A B C & D)
Detailed PMIC statistics for the following Tracts:0015.02
, 0019.00
2002 - 2018 National Fire Incident Reporting System (NFIRS) incidents
Based on the data from the years 2002 - 2018 the average number of fires per year is 12. The highest number of reported fires - 27 took place in 2010, and the least - 3 in 2008. The data has a growing trend.
When looking into fire subcategories, the most incidents belonged to: Outside Fires (54.4%), and Structure Fires (26.2%).
Fire incident types reported to NFIRS in Zip Code 38313


 Nearest zip codes: 38345, 38352, 38305, 38366, 38347, 38362.


 Based on the data from the years 2002 - 2018 the average number of fires per year is 12. The highest number of reported fires - 27 took place in 2010, and the least - 3 in 2008. The data has a growing trend.
 When looking into fire subcategories, the most incidents belonged to: Outside Fires (54.4%), and Structure Fires (26.2%).