Estimated zip code population in 2022: 2,751 Zip code population in 2010: 2,843 Zip code population in 2000: 2,623
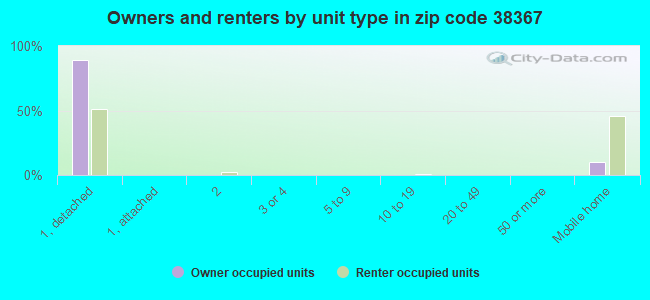
Houses and condos: 1,402 Renter-occupied apartments: 223
% of renters here:
20%
State:
33%
March 2022 cost of living index in zip code 38367: 79.0 (low, U.S. average is 100)
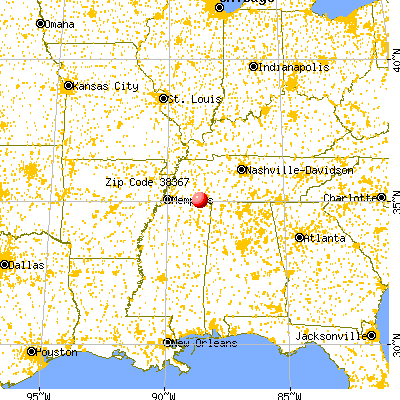
Land area: 78.1 sq. mi. Water area: 0.1 sq. mi.
Population density: 35 people per square mile
(very low).
OSM Map
General Map
Google Map
MSN Map
OSM Map
General Map
Google Map
MSN Map
OSM Map
General Map
Google Map
MSN Map
OSM Map
General Map
Google Map
MSN Map
Please wait while loading the map...
Real estate property taxes paid for housing units in 2022:
This zip code:
0.3% ($514)
Tennessee:
0.5% ($1,376)
Median real estate property taxes paid for housing units with mortgages in 2022: $634 (0.4%) Median real estate property taxes paid for housing units with no mortgage in 2022: $438 (0.3%)
Business Search- 14 Million verified businesses
Males: 1,405
(51.1%)
Females: 1,346
(48.9%)
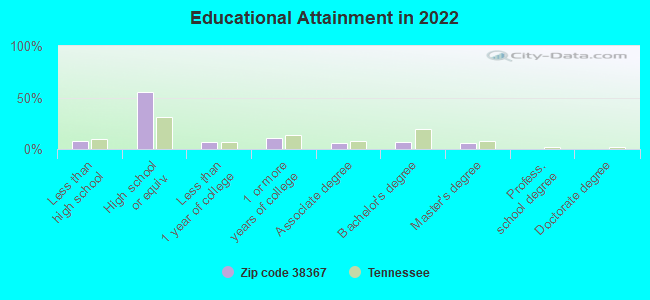
For population 25 years and over in 38367:
High school or higher: 91.0%
Bachelor's degree or higher: 12.9%
Graduate or professional degree: 6.1%
Unemployed: 3.7%
Mean travel time to work (commute): 29.0 minutes
For population 15 years and over in 38367:
Never married: 25.0%
Now married: 55.1%
Separated: 1.5%
Widowed: 6.8%
Divorced: 11.7%
Zip code 38367 compared to state average:
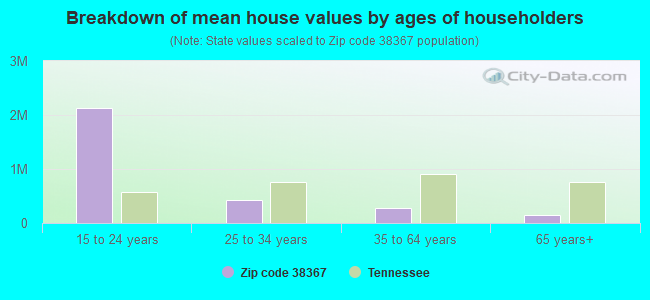
Median house value below state average.
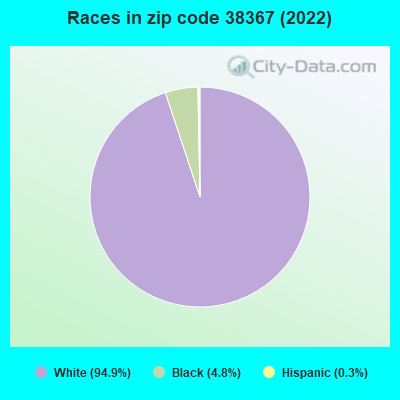
Black race population percentage significantly below state average.
Hispanic race population percentage significantly below state average.
Median age above state average.
Foreign-born population percentage significantly below state average.
Renting percentage below state average.
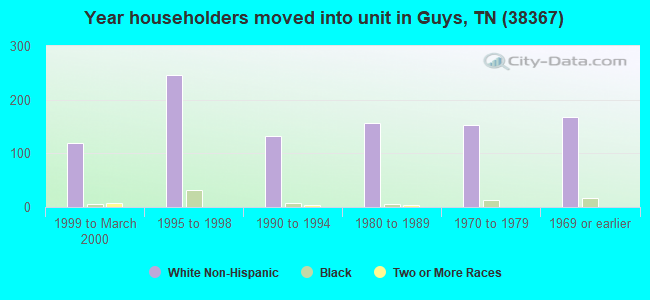
Length of stay since moving in significantly above state average.
Percentage of population with a bachelor's degree or higher below state average.
Estimated median house/condo value in 2022: $160,867
38367:
$160,867
Tennessee:
$284,800
According to our research of Tennessee and other state lists, there were 8 registered sex offenders living in 38367 zip code as of May 28, 2024. The ratio of all residents to sex offenders in zip code 38367 is 392 to 1. The ratio of registered sex offenders to all residents in this zip code is near the state average.
Median resident age:
This zip code:
46.6 years
Tennessee median age:
39.2 years
Average household size:
This zip code:
2.4 people
Tennessee:
2.4 people
Averages for the 2020 tax year for zip code 38367, filed in 2021:
Average Adjusted Gross Income (AGI) in 2020: $48,643 (Individual Income Tax Returns)
Here:
$48,643
State:
$69,014
Salary/wage: $45,949 (reported on 82.2% of returns)
Here:
$45,949
State:
$55,872
(% of AGI for various income ranges: 1130.0% for AGIs below $25k, 3597.5% for AGIs $25k-50k, 6316.7% for AGIs $50k-75k, 9402.9% for AGIs $75k-100k, 17811.2% for AGIs $100k-200k)
Taxable interest for individuals: $878 (reported on 21.5% of returns)
This zip code:
$878
Tennessee:
$1,945
(% of AGI for various income ranges: 4.3% for AGIs below $25k, 31.2% for AGIs $25k-50k, 10.0% for AGIs $50k-75k, 8.6% for AGIs $75k-100k, 120.0% for AGIs $100k-200k)
Ordinary dividends: $1,471 (reported on 6.5% of returns)
Here:
$1,471
State:
$8,105
(% of AGI for various income ranges: 10.4% for AGIs $25k-50k, 23.3% for AGIs $50k-75k, 62.5% for AGIs $100k-200k)
Net capital gain/loss in AGI: +$8,200 (reported on 6.5% of returns)
Here:
+$8,200
State:
+$33,664
(% of AGI for various income ranges: 49.6% for AGIs $25k-50k, 568.8% for AGIs $100k-200k)
Profit/loss from business: +$8,850 (reported on 16.8% of returns)
Here:
+$8,850
State:
+$18,991
(% of AGI for various income ranges: 168.0% for AGIs below $25k, 139.2% for AGIs $25k-50k, 223.3% for AGIs $50k-75k, 608.8% for AGIs $100k-200k)
Taxable individual retirement arrangement distribution: $13,367 (reported on 5.6% of returns)
38367:
$13,367
Tennessee:
$20,036
(% of AGI for various income ranges: 146.2% for AGIs $25k-50k, 644.3% for AGIs $75k-100k)
Earned income credit: $2,416 (reported on 23.4% of returns)
Here:
$2,416
State:
$2,391
(% of AGI for various income ranges: 132.7% for AGIs below $25k, 85.8% for AGIs $25k-50k)
Percentage of individuals using paid preparers for their 2020 taxes: 95.3%
Here:
95%
State:
93%
(% for various income ranges: 97.4% for AGIs below $25k, 93.5% for AGIs $25k-50k, 93.8% for AGIs $50k-75k, 90.0% for AGIs $75k-100k, 100.0% for AGIs $100k-200k, 100.0% for AGIs over 200k)
Averages for the 2012 tax year for zip code 38367, filed in 2013:
Average Adjusted Gross Income (AGI) in 2012: $40,153 (Individual Income Tax Returns)
Here:
$40,153
State:
$53,767
Salary/wage: $37,202 (reported on 85.4% of returns)
Here:
$37,202
State:
$45,421
(% of AGI for various income ranges: 72.3% for AGIs below $25k, 81.8% for AGIs $25k-50k, 78.1% for AGIs $50k-75k, 85.5% for AGIs $75k-100k, 77.4% for AGIs $100k-200k)
Taxable interest for individuals: $1,110 (reported on 19.4% of returns)
This zip code:
$1,110
Tennessee:
$1,732
(% of AGI for various income ranges: 1.1% for AGIs below $25k, 0.5% for AGIs $25k-50k, 0.2% for AGIs $50k-75k, 0.5% for AGIs $75k-100k, 0.6% for AGIs $100k-200k)
Ordinary dividends: $2,433 (reported on 8.7% of returns)
Here:
$2,433
State:
$6,739
(% of AGI for various income ranges: 0.1% for AGIs $25k-50k, 0.2% for AGIs $50k-75k, 2.8% for AGIs $75k-100k)
Net capital gain/loss in AGI: +$1,067 (reported on 5.8% of returns)
Here:
+$1,067
State:
+$19,082
Profit/loss from business: +$10,288 (reported on 15.5% of returns)
Here:
+$10,288
State:
+$15,240
(% of AGI for various income ranges: 8.2% for AGIs below $25k, 2.8% for AGIs $25k-50k, 2.1% for AGIs $50k-75k, 9.9% for AGIs $75k-100k)
Taxable individual retirement arrangement distribution: $9,012 (reported on 7.8% of returns)
38367:
$9,012
Tennessee:
$15,505
(% of AGI for various income ranges: 1.6% for AGIs below $25k, 2.5% for AGIs $25k-50k, 4.4% for AGIs $50k-75k)
Total itemized deductions: $20,085 (24% of AGI, reported on 12.6% of returns)
Here:
$20,085
State:
$21,976
Here:
24.2% of AGI
State:
17.8% of AGI
(% of AGI for various income ranges: 6.8% for AGIs $25k-50k, 4.6% for AGIs $50k-75k, 8.9% for AGIs $75k-100k, 9.3% for AGIs $100k-200k)
Charity contributions: $5,860 (reported on 9.7% of returns)
Here:
$5,860
State:
$6,709
(% of AGI for various income ranges: 1.7% for AGIs $25k-50k, 2.4% for AGIs $75k-100k, 2.5% for AGIs $100k-200k)
Taxes paid: $3,046 (reported on 12.6% of returns)
38367:
$3,046
State:
$4,829
(% of AGI for various income ranges: 0.9% for AGIs $25k-50k, 0.7% for AGIs $50k-75k, 1.2% for AGIs $75k-100k, 1.7% for AGIs $100k-200k)
Earned income credit: $2,334 (reported on 28.2% of returns)
Here:
$2,334
State:
$2,404
(% of AGI for various income ranges: 7.7% for AGIs below $25k, 1.9% for AGIs $25k-50k)
Percentage of individuals using paid preparers for their 2012 taxes: 69.9%
Here:
70%
State:
52%
(% for various income ranges: 68.1% for AGIs below $25k, 67.9% for AGIs $25k-50k, 71.4% for AGIs $50k-75k, 75.0% for AGIs $75k-100k, 83.3% for AGIs $100k-200k)
Averages for the 2004 tax year for zip code 38367, filed in 2005:
Average Adjusted Gross Income (AGI) in 2004: $32,543 (Individual Income Tax Returns)
Here:
$32,543
State:
$44,088
Salary/wage: $32,329 (reported on 84.8% of returns)
Here:
$32,329
State:
$38,825
(% of AGI for various income ranges: 107.3% for AGIs below $10k, 77.9% for AGIs $10k-25k, 84.2% for AGIs $25k-50k, 89.7% for AGIs $50k-75k, 90.4% for AGIs $75k-100k, 74.6% for AGIs over 100k)
Taxable interest for individuals: $1,103 (reported on 28.9% of returns)
This zip code:
$1,103
Tennessee:
$1,802
(% of AGI for various income ranges: 4.6% for AGIs below $10k, 1.5% for AGIs $10k-25k, 1.2% for AGIs $25k-50k, 0.3% for AGIs $50k-75k, 1.0% for AGIs $75k-100k, 0.5% for AGIs over 100k)
Taxable dividends: $764 (reported on 10.5% of returns)
Here:
$764
State:
$3,727
(% of AGI for various income ranges: 2.7% for AGIs below $10k, 0.2% for AGIs $10k-25k, 0.1% for AGIs $25k-50k, 0.3% for AGIs $50k-75k, 0.3% for AGIs over 100k)
Net capital gain/loss: +$2,110 (reported on 8.1% of returns)
Here:
+$2,110
State:
+$15,776
(% of AGI for various income ranges: 2.2% for AGIs below $10k, 0.2% for AGIs $10k-25k, 0.9% for AGIs $25k-50k, 0.4% for AGIs $50k-75k, 0.4% for AGIs $75k-100k, 0.2% for AGIs over 100k)
Profit/loss from business: +$4,588 (reported on 16.9% of returns)
Here:
+$4,588
State:
+$12,882
(% of AGI for various income ranges: -14.7% for AGIs below $10k, 6.6% for AGIs $10k-25k, 4.7% for AGIs $25k-50k, 0.7% for AGIs $50k-75k)
IRA payment deduction: $2,389 (reported on 1.8% of returns)
38367:
$2,389
Tennessee:
$2,934
Total itemized deductions: $15,378 (23% of AGI, reported on 14.2% of returns)
Here:
$15,378
State:
$18,035
Here:
23.3% of AGI
State:
19.9% of AGI
(% of AGI for various income ranges: 5.7% for AGIs $10k-25k, 5.8% for AGIs $25k-50k, 6.4% for AGIs $50k-75k, 7.8% for AGIs $75k-100k, 10.2% for AGIs over 100k)
Charity contributions deductions: $5,704 (8% of AGI, reported on 11.4% of returns)
Here:
$5,704
State:
$5,167
Here:
8.0% of AGI
State:
5.3% of AGI
(% of AGI for various income ranges: 1.4% for AGIs $10k-25k, 1.5% for AGIs $25k-50k, 1.8% for AGIs $50k-75k, 1.9% for AGIs $75k-100k, 4.4% for AGIs over 100k)
Total tax: $3,883 (reported on 71.1% of returns)
38367:
$3,883
State:
$7,482
(% of AGI for various income ranges: 6.0% for AGIs below $10k, 3.7% for AGIs $10k-25k, 6.1% for AGIs $25k-50k, 8.0% for AGIs $50k-75k, 9.8% for AGIs $75k-100k, 18.5% for AGIs over 100k)
Earned income credit: $1,871 (reported on 23.9% of returns)
Here:
$1,871
State:
$1,826
Percentage of individuals using paid preparers for their 2004 taxes: 74.7%
Here:
75%
State:
60%
(% for various income ranges: 72.2% for AGIs below $10k, 76.2% for AGIs $10k-25k, 73.6% for AGIs $25k-50k, 75.4% for AGIs $50k-75k, 83.0% for AGIs $75k-100k, 70.0% for AGIs over 100k)
Household received Food Stamps/SNAP in the past 12 months: 112 Household did not receive Food Stamps/SNAP in the past 12 months: 1,025
Women who had a birth in the past 12 months: 4 (5 now married, 0 unmarried) Women who did not have a birth in the past 12 months: 673 (285 now married, 388 unmarried)
Housing units in zip code 38367 with a mortgage: 305 (10 second mortgage, 9 both second mortgage and home equity loan) Houses without a mortgage: 7
Median monthly owner costs for units with a mortgage: $1,149 Median monthly owner costs for units without a mortgage: $405
Residents with income below the poverty level in 2022:
This zip code:
8.8%
Whole state:
13.3%
Residents with income below 50% of the poverty level in 2022:
This zip code:
3.4%
Whole state:
7.1%
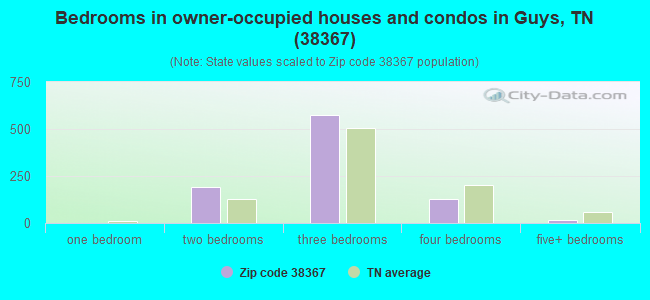
Median number of rooms in houses and condos:
Here:
5.9
State:
6.5
Median number of rooms in apartments:
Here:
4.9
State:
4.4
Notable locations in this zip code not listed on our city pages
Notable locations in zip code 38367: McNairy County Fire Department Station 31 Chewalla Fire Department (A), Eastview Volunteer Fire Department (B), Ramer Fire Department (C). Display/hide their locations on the map
Churches in zip code 38367 include: Chewalla Baptist Church (A), Friendship Baptist Church (B), Ramer Baptist Church (C), Wades Chapel (D), Antioch Church (E), Berua Church (F), Olive Hill Church (G), Mount Vernon Church (H), Mount Olive Church (I). Display/hide their locations on the map
Cemeteries: Houston Cemetery (1), Indian Creek Cemetery (2), Turner Cemetery (3), White Oak Cemetery (4), Ramer Cemetery (5), Carr Cemetery (6), Coleman Cemetery (7). Display/hide their locations on the map
Streams, rivers, and creeks: Indian Creek (A), Caney Creek (B), Brushy Branch (C), Allen Branch (D), Muddy Creek (E), Roland Creek (F), Reedy Branch (G), Ramer Branch (H), Prairie Branch (I). Display/hide their locations on the map
Size of family households: 400 2-persons, 243 3-persons, 124 4-persons, 43 5-persons, 7 6-persons
Size of nonfamily households: 278 1-person, 38 2-persons
280 married couples with children.
147 single-parent households (45 men, 102 women).
99.8% of residents of 38367 zip code speak English at home.
Foreign born population: 1 (0.0%) (0.0% of them are naturalized citizens)
:
0.0%
Whole state:
5.6%
100%Brazil
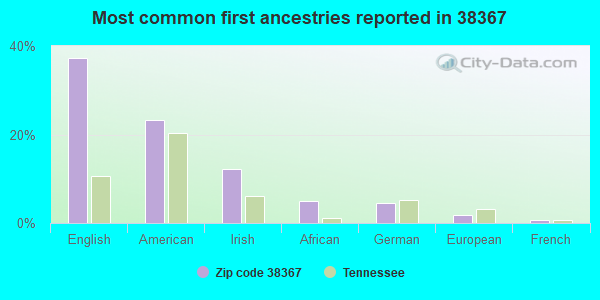
37%English
23%American
12%Irish
5%African
5%German
2%European
1%French
Year of entry for the foreign-born population
02010 or later
02000 to 2009
01990 to 1999
2Before 1990
Facilities with environmental interests located in this zip code:
CUSTOM WOODWORKS, INC. (4188 HWY 57 in RAMER, TN)
AIR MINOR (AIRS/AFS) Business SIC classification: WOOD PRODUCTS
Housing units lacking complete plumbing facilities: 0.4% Housing units lacking complete kitchen facilities: 0.1%
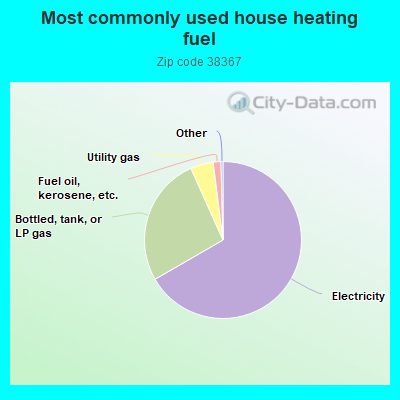
66.8%Electricity
26.7%Bottled, tank, or LP gas
4.7%Utility gas
1.6%Fuel oil, kerosene, etc.
Population in 1990: 2,804.
Place of birth for U.S.-born residents:
This state: 1,623
Northeast: 20
Midwest: 315
South: 696
West: 77
63% of the 38367 zip code residents lived in the same house 5 years ago. Out of people who lived in different houses, 53% lived in this county. Out of people who lived in different counties, 50% lived in Tennessee.
97% of the 38367 zip code residents lived in the same house 1 year ago. Out of people who lived in different houses, 65% moved from this county. Out of people who lived in different houses, 5% moved from different county within same state. Out of people who lived in different houses, 8% moved from different state. Out of people who lived in different houses, 43% moved from abroad.
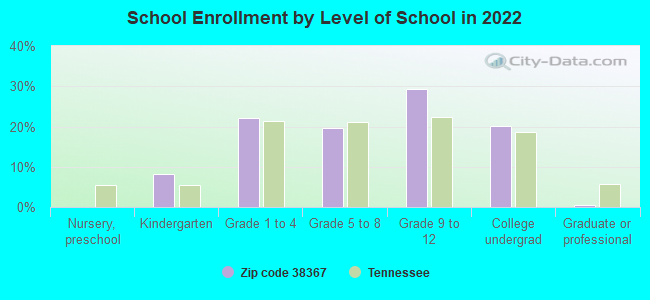
Private vs. public school enrollment:
Students in private schools in grades 1 to 8 (elementary and middle school): 2
Here:
1.0%
Tennessee:
15.0%
Students in private schools in grades 9 to 12 (high school):
Here:
0.0%
Tennessee:
16.2%
Students in private undergraduate colleges: 25
Here:
24.3%
Tennessee:
23.5%
Occupation by median earnings in the past 12 months ($)
149,005Business and financial operations occupations
86,907Architecture and engineering occupations
62,061Installation, maintenance, and repair occupations
60,715Transportation occupations
60,340Health diagnosing and treating practitioners and other technical occupations
45,756Community and social service occupations
Top industries in this zip code by the number of employees in 2005:
Health Care and Social Assistance: Offices of Physicians (except Mental Health Specialists) (10-19: 1)
Other Services (except Public Administration): Religious Organizations (5-9: 1, 1-4: 4)
Professional, Scientific, and Technical Services: Tax Preparation Services (5-9: 1)
Wholesale Trade: Home Furnishing Merchant Wholesalers (1-4: 1)
Fatal accident statistics in 2014:
Fatal accident count: 1
Vehicles involved in fatal accidents: 1
Fatal accidents caused by drunken drivers: 1
Fatalities: 1
Persons involved in fatal accidents: 1
Pedestrians involved in fatal accidents: 0
Fatal accident statistics in 2012:
Fatal accident count: 3
Vehicles involved in fatal accidents: 3
Fatal accidents caused by drunken drivers: 2
Fatalities: 3
Persons involved in fatal accidents: 4
Pedestrians involved in fatal accidents: 0
2005 - 2018 National Fire Incident Reporting System (NFIRS) incidents
Based on the data from the years 2005 - 2018 the average number of fire incidents per year is 13. The highest number of reported fires - 35 took place in 2007, and the least - 0 in 2014. The data has a declining trend.
When looking into fire subcategories, the most reports belonged to: Structure Fires (49.7%), and Outside Fires (34.2%).
Fire incident types reported to NFIRS in Zip Code 38367


 Nearest zip codes: 38339, 38375, 38834, 38061, 38357, 38315.
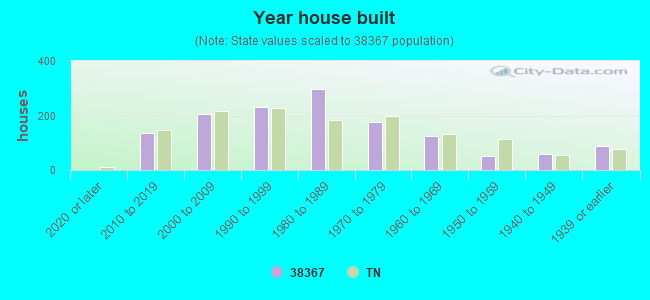


 Based on the data from the years 2005 - 2018 the average number of fire incidents per year is 13. The highest number of reported fires - 35 took place in 2007, and the least - 0 in 2014. The data has a declining trend.
 When looking into fire subcategories, the most reports belonged to: Structure Fires (49.7%), and Outside Fires (34.2%).