Estimated zip code population in 2022: 1,727 Zip code population in 2010: 1,535 Zip code population in 2000: 1,476
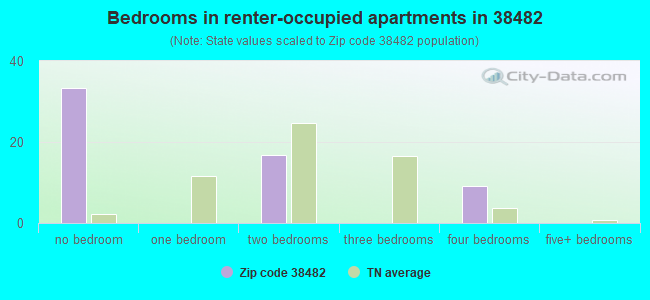
Houses and condos: 755 Renter-occupied apartments: 40
% of renters here:
6%
State:
33%
March 2022 cost of living index in zip code 38482: 79.4 (low, U.S. average is 100)
Land area: 42.9 sq. mi. Water area: 0.0 sq. mi.
Population density: 40 people per square mile
(very low).
OSM Map
General Map
Google Map
MSN Map
OSM Map
General Map
Google Map
MSN Map
OSM Map
General Map
Google Map
MSN Map
OSM Map
General Map
Google Map
MSN Map
Please wait while loading the map...
Real estate property taxes paid for housing units in 2022:
This zip code:
0.3% ($1,046)
Tennessee:
0.5% ($1,376)
Median real estate property taxes paid for housing units with mortgages in 2022: $1,022 (0.3%) Median real estate property taxes paid for housing units with no mortgage in 2022: $1,129 (0.3%)
Business Search- 14 Million verified businesses
Males: 880
(51.0%)
Females: 846
(49.0%)
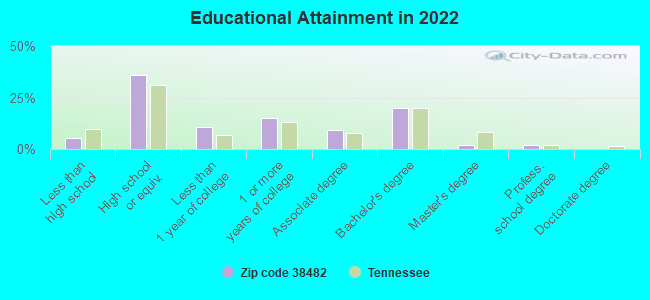
For population 25 years and over in 38482:
High school or higher: 94.8%
Bachelor's degree or higher: 24.0%
Graduate or professional degree: 4.2%
Unemployed: 1.8%
Mean travel time to work (commute): 36.5 minutes
For population 15 years and over in 38482:
Never married: 10.6%
Now married: 72.8%
Separated: 0.0%
Widowed: 5.5%
Divorced: 11.2%
Zip code 38482 compared to state average:
Unemployed percentage below state average.
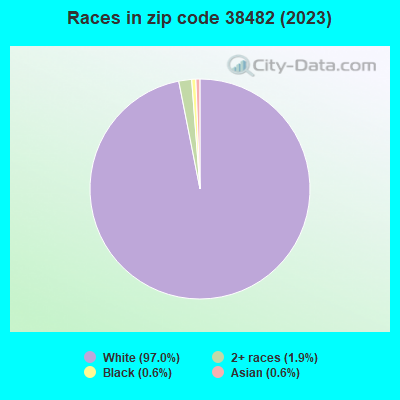
Black race population percentage significantly below state average.
Hispanic race population percentage below state average.
Renting percentage significantly below state average.
Averages for the 2020 tax year for zip code 38482, filed in 2021:
Average Adjusted Gross Income (AGI) in 2020: $63,201 (Individual Income Tax Returns)
Here:
$63,201
State:
$69,014
Salary/wage: $59,976 (reported on 77.6% of returns)
Here:
$59,976
State:
$55,872
(% of AGI for various income ranges: 1215.6% for AGIs below $25k, 3429.4% for AGIs $25k-50k, 6352.0% for AGIs $50k-75k, 9081.4% for AGIs $75k-100k, 14732.5% for AGIs $100k-200k)
Taxable interest for individuals: $644 (reported on 29.4% of returns)
This zip code:
$644
Tennessee:
$1,945
(% of AGI for various income ranges: 16.7% for AGIs below $25k, 14.4% for AGIs $25k-50k, 42.0% for AGIs $50k-75k, 10.0% for AGIs $75k-100k, 53.8% for AGIs $100k-200k)
Ordinary dividends: $3,246 (reported on 15.3% of returns)
Here:
$3,246
State:
$8,105
(% of AGI for various income ranges: 28.9% for AGIs below $25k, 3.1% for AGIs $25k-50k, 186.0% for AGIs $50k-75k, 223.7% for AGIs $100k-200k)
Net capital gain/loss in AGI: +$11,746 (reported on 15.3% of returns)
Here:
+$11,746
State:
+$33,664
(% of AGI for various income ranges: 12.5% for AGIs $25k-50k, 159.0% for AGIs $50k-75k, 1685.0% for AGIs $100k-200k)
Profit/loss from business: +$16,589 (reported on 21.2% of returns)
Here:
+$16,589
State:
+$18,991
(% of AGI for various income ranges: 279.4% for AGIs below $25k, 275.0% for AGIs $25k-50k, 326.0% for AGIs $50k-75k, 661.4% for AGIs $75k-100k, 1567.5% for AGIs $100k-200k)
Taxable individual retirement arrangement distribution: $15,862 (reported on 9.4% of returns)
38482:
$15,862
Tennessee:
$20,036
(% of AGI for various income ranges: 296.9% for AGIs $25k-50k, 1134.3% for AGIs $75k-100k)
Total itemized deductions: $27,600 (reported on 3.5% of returns)
Here:
$27,600
State:
$40,136
(% of AGI for various income ranges: 1035.0% for AGIs $100k-200k)
Charity contributions: $16,100 (reported on 2.4% of returns)
Here:
$16,100
State:
$19,852
(% of AGI for various income ranges: 201.3% for AGIs $25k-50k)
Taxes paid: $6,800 (reported on 2.4% of returns)
38482:
$6,800
State:
$6,038
(% of AGI for various income ranges: 170.0% for AGIs $100k-200k)
Earned income credit: $2,391 (reported on 12.9% of returns)
Here:
$2,391
State:
$2,391
(% of AGI for various income ranges: 86.1% for AGIs below $25k, 67.5% for AGIs $25k-50k)
Percentage of individuals using paid preparers for their 2020 taxes: 92.9%
Here:
93%
State:
93%
(% for various income ranges: 92.3% for AGIs below $25k, 95.0% for AGIs $25k-50k, 92.9% for AGIs $50k-75k, 90.0% for AGIs $75k-100k, 91.7% for AGIs $100k-200k, 100.0% for AGIs over 200k)
Averages for the 2012 tax year for zip code 38482, filed in 2013:
Average Adjusted Gross Income (AGI) in 2012: $44,828 (Individual Income Tax Returns)
Here:
$44,828
State:
$53,767
Salary/wage: $40,779 (reported on 82.9% of returns)
Here:
$40,779
State:
$45,421
(% of AGI for various income ranges: 69.2% for AGIs below $25k, 76.4% for AGIs $25k-50k, 82.2% for AGIs $50k-75k, 81.2% for AGIs $75k-100k, 69.5% for AGIs $100k-200k)
Taxable interest for individuals: $618 (reported on 28.9% of returns)
This zip code:
$618
Tennessee:
$1,732
(% of AGI for various income ranges: 1.0% for AGIs below $25k, 0.5% for AGIs $25k-50k, 0.5% for AGIs $50k-75k, 0.1% for AGIs $75k-100k, 0.2% for AGIs $100k-200k)
Ordinary dividends: $2,120 (reported on 13.2% of returns)
Here:
$2,120
State:
$6,739
(% of AGI for various income ranges: 0.6% for AGIs below $25k, 0.4% for AGIs $25k-50k, 1.8% for AGIs $50k-75k, 0.3% for AGIs $100k-200k)
Net capital gain/loss in AGI: +$1,288 (reported on 10.5% of returns)
Here:
+$1,288
State:
+$19,082
(% of AGI for various income ranges: 0.4% for AGIs $25k-50k, 1.5% for AGIs $75k-100k)
Profit/loss from business: +$10,319 (reported on 21.1% of returns)
Here:
+$10,319
State:
+$15,240
(% of AGI for various income ranges: 16.6% for AGIs below $25k, 9.6% for AGIs $25k-50k, 5.4% for AGIs $75k-100k)
Taxable individual retirement arrangement distribution: $8,557 (reported on 9.2% of returns)
38482:
$8,557
Tennessee:
$15,505
Total itemized deductions: $19,058 (21% of AGI, reported on 15.8% of returns)
Here:
$19,058
State:
$21,976
Here:
20.6% of AGI
State:
17.8% of AGI
(% of AGI for various income ranges: 7.6% for AGIs $25k-50k, 10.7% for AGIs $50k-75k, 8.9% for AGIs $100k-200k)
Charity contributions: $3,760 (reported on 13.2% of returns)
Here:
$3,760
State:
$6,709
(% of AGI for various income ranges: 0.9% for AGIs $25k-50k, 1.1% for AGIs $50k-75k, 2.2% for AGIs $100k-200k)
Taxes paid: $4,100 (reported on 15.8% of returns)
38482:
$4,100
State:
$4,829
(% of AGI for various income ranges: 1.1% for AGIs $25k-50k, 2.0% for AGIs $50k-75k, 2.5% for AGIs $100k-200k)
Earned income credit: $2,062 (reported on 21.1% of returns)
Here:
$2,062
State:
$2,404
(% of AGI for various income ranges: 6.7% for AGIs below $25k, 1.0% for AGIs $25k-50k)
Percentage of individuals using paid preparers for their 2012 taxes: 55.3%
Here:
55%
State:
52%
(% for various income ranges: 53.3% for AGIs below $25k, 59.1% for AGIs $25k-50k, 45.5% for AGIs $50k-75k, 66.7% for AGIs $75k-100k, 57.1% for AGIs $100k-200k)
Averages for the 2004 tax year for zip code 38482, filed in 2005:
Average Adjusted Gross Income (AGI) in 2004: $41,384 (Individual Income Tax Returns)
Here:
$41,384
State:
$44,088
Salary/wage: $38,819 (reported on 82.7% of returns)
Here:
$38,819
State:
$38,825
(% of AGI for various income ranges: 76.9% for AGIs below $10k, 74.8% for AGIs $10k-25k, 85.2% for AGIs $25k-50k, 82.4% for AGIs $50k-75k, 85.1% for AGIs $75k-100k, 58.9% for AGIs over 100k)
Taxable interest for individuals: $1,033 (reported on 40.4% of returns)
This zip code:
$1,033
Tennessee:
$1,802
(% of AGI for various income ranges: 9.5% for AGIs below $10k, 2.2% for AGIs $10k-25k, 0.7% for AGIs $25k-50k, 0.8% for AGIs $50k-75k, 1.3% for AGIs $75k-100k, 0.1% for AGIs over 100k)
Taxable dividends: $1,198 (reported on 15.8% of returns)
Here:
$1,198
State:
$3,727
(% of AGI for various income ranges: 1.0% for AGIs below $10k, 0.4% for AGIs $10k-25k, 0.8% for AGIs $25k-50k, 0.5% for AGIs $50k-75k, 0.3% for AGIs $75k-100k, 0.2% for AGIs over 100k)
Net capital gain/loss: +$4,505 (reported on 14.2% of returns)
Here:
+$4,505
State:
+$15,776
(% of AGI for various income ranges: 2.7% for AGIs below $10k, 2.2% for AGIs $10k-25k, 1.0% for AGIs $25k-50k, 3.0% for AGIs $50k-75k, -0.2% for AGIs $75k-100k, 1.3% for AGIs over 100k)
Profit/loss from business: +$9,867 (reported on 19.1% of returns)
Here:
+$9,867
State:
+$12,882
(% of AGI for various income ranges: 33.8% for AGIs below $10k, 7.7% for AGIs $10k-25k, 4.8% for AGIs $25k-50k, 5.9% for AGIs $50k-75k, 2.9% for AGIs $75k-100k)
Total itemized deductions: $14,203 (20% of AGI, reported on 18.4% of returns)
Here:
$14,203
State:
$18,035
Here:
20.3% of AGI
State:
19.9% of AGI
(% of AGI for various income ranges: 7.7% for AGIs $25k-50k, 7.8% for AGIs $50k-75k, 6.0% for AGIs $75k-100k, 6.5% for AGIs over 100k)
Charity contributions deductions: $3,059 (4% of AGI, reported on 15.2% of returns)
Here:
$3,059
State:
$5,167
Here:
4.2% of AGI
State:
5.3% of AGI
(% of AGI for various income ranges: 0.9% for AGIs $25k-50k, 1.3% for AGIs $50k-75k, 1.6% for AGIs $75k-100k, 1.5% for AGIs over 100k)
Total tax: $4,429 (reported on 79.4% of returns)
38482:
$4,429
State:
$7,482
(% of AGI for various income ranges: 6.0% for AGIs below $10k, 4.6% for AGIs $10k-25k, 6.9% for AGIs $25k-50k, 8.3% for AGIs $50k-75k, 11.5% for AGIs $75k-100k, 10.4% for AGIs over 100k)
Earned income credit: $1,742 (reported on 13.3% of returns)
Here:
$1,742
State:
$1,826
Percentage of individuals using paid preparers for their 2004 taxes: 61.0%
Here:
61%
State:
60%
(% for various income ranges: 58.4% for AGIs below $10k, 55.6% for AGIs $10k-25k, 63.6% for AGIs $25k-50k, 59.2% for AGIs $50k-75k, 79.6% for AGIs $75k-100k, 62.1% for AGIs over 100k)
Household received Food Stamps/SNAP in the past 12 months: 12 Household did not receive Food Stamps/SNAP in the past 12 months: 706
Women who had a birth in the past 12 months: 20 (21 now married, 0 unmarried) Women who did not have a birth in the past 12 months: 190 (181 now married, 9 unmarried)
Housing units in zip code 38482 with a mortgage: 384 (22 second mortgage, 22 both second mortgage and home equity loan) Houses without a mortgage: 44
Median monthly owner costs for units with a mortgage: $1,474 Median monthly owner costs for units without a mortgage: $692
Residents with income below the poverty level in 2022:
This zip code:
2.6%
Whole state:
13.3%
Residents with income below 50% of the poverty level in 2022:
This zip code:
2.6%
Whole state:
7.1%
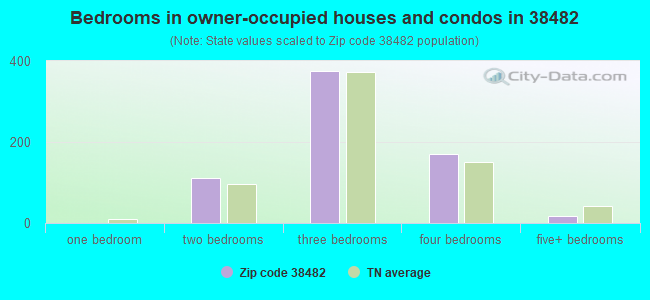
Median number of rooms in houses and condos:
Here:
5.9
State:
6.5
Median number of rooms in apartments:
Here:
5.5
State:
4.4
Notable locations in this zip code not listed on our city pages
Churches in zip code 38482 include: Fly Church (A), Johnson Chapel (B), Hill Town Church (C), Goshen Church (D), Union Church (E), Cave Spring Church (F), Bethel Methodist Church (G). Display/hide their locations on the map
Cemeteries: Jones Cemetery (1), Sewell Cemetery (2), Witherspoon Cemetery (3), Walker Cemetery (4), Tate Cemetery (5), Santa Fe Cemetery (6), Oakley Cemetery (7). Display/hide their locations on the map
Streams, rivers, and creeks: Kinderhook Branch (A), Indian Camp Branch (B), Hill Branch (C), Hastings Branch (D), Gaskill Branch (E), Fitzgerald Branch (F), Elam Branch (G), Adkison Branch (H), Oakley Mill Creek (I). Display/hide their locations on the map
Size of family households: 190 2-persons, 120 3-persons, 155 4-persons, 34 5-persons, 16 7-or-more-persons
Size of nonfamily households: 195 1-person
387 married couples with children.
3 single-parent households (3 men).
97.8% of residents of 38482 zip code speak English at home.
1.0% of residents speak Spanish at home (18% very well, 12% well, 59% not well, 12% not at all).
0.6% of residents speak Asian or Pacific Island language at home (100% very well).
Foreign born population: 96 (5.6%) (95.6% of them are naturalized citizens)
This zip code:
5.6%
Whole state:
5.6%
29%Sweden
14%St. Lucia
3%Honduras
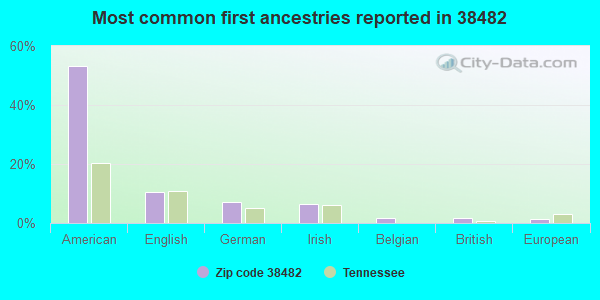
53%American
11%English
7%German
7%Irish
2%Belgian
2%British
1%European
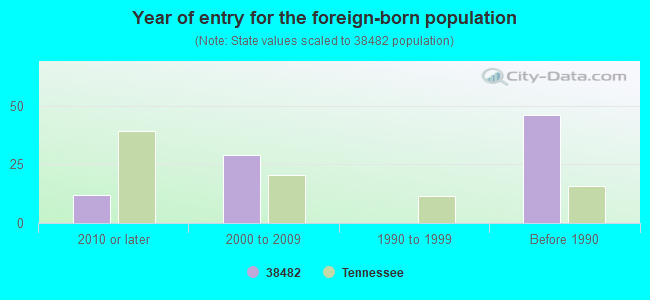
Year of entry for the foreign-born population
92010 or later
272000 to 2009
41990 to 1999
54Before 1990
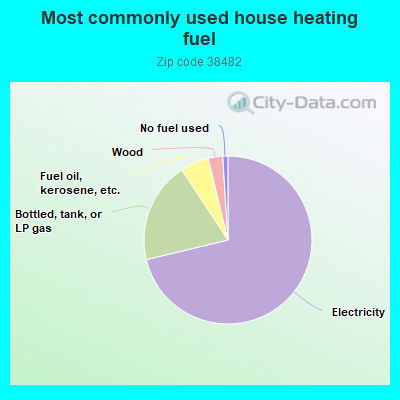
67.7%Electricity
21.0%Bottled, tank, or LP gas
8.0%Fuel oil, kerosene, etc.
1.9%Wood
1.9%No fuel used
Population in 1990: 2,001.
Place of birth for U.S.-born residents:
This state: 972
Northeast: 10
Midwest: 322
South: 255
West: 54
72% of the 38482 zip code residents lived in the same house 5 years ago. Out of people who lived in different houses, 59% lived in this county. Out of people who lived in different counties, 50% lived in Tennessee.
97% of the 38482 zip code residents lived in the same house 1 year ago. Out of people who lived in different houses, 74% moved from different county within same state. Out of people who lived in different houses, 50% moved from different state.
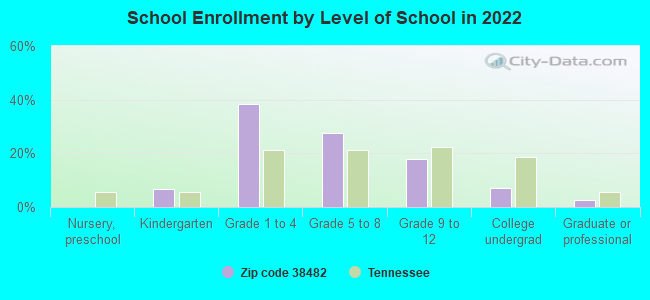
Private vs. public school enrollment:
Students in private schools in grades 1 to 8 (elementary and middle school): 120
Here:
44.0%
Tennessee:
15.0%
Students in private schools in grades 9 to 12 (high school):
Here:
0.0%
Tennessee:
16.2%
Students in private undergraduate colleges: 3
Here:
11.8%
Tennessee:
23.5%
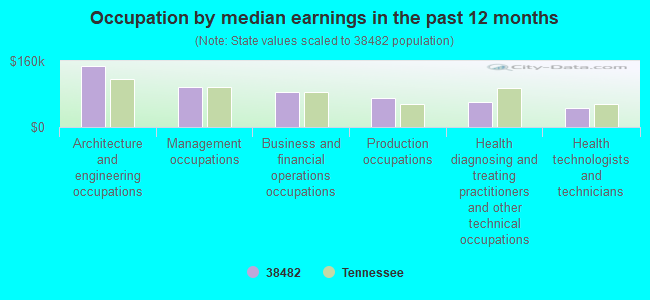
Occupation by median earnings in the past 12 months ($)
146,862Architecture and engineering occupations
98,076Management occupations
84,776Business and financial operations occupations
69,830Production occupations
59,742Health diagnosing and treating practitioners and other technical occupations
45,825Health technologists and technicians
Top industries in this zip code by the number of employees in 2005:
Construction: Highway, Street, and Bridge Construction (1-4 employees: 1 establishment)
Construction: New Single-Family Housing Construction (except Operative Builders) (1-4: 1)
Finance and Insurance: Portfolio Management (1-4: 1)
Other Services (except Public Administration): Religious Organizations (1-4: 1)
Fatal accident statistics in 2013:
Fatal accident count: 1
Vehicles involved in fatal accidents: 1
Fatal accidents caused by drunken drivers: 0
Fatalities: 1
Persons involved in fatal accidents: 1
Pedestrians involved in fatal accidents: 0
Fatal accident statistics in 2012:
Fatal accident count: 1
Vehicles involved in fatal accidents: 2
Fatal accidents caused by drunken drivers: 0
Fatalities: 1
Persons involved in fatal accidents: 3
Pedestrians involved in fatal accidents: 0
2002 - 2018 National Fire Incident Reporting System (NFIRS) incidents
Based on the data from the years 2002 - 2018 the average number of fires per year is 13. The highest number of fires - 23 took place in 2006, and the least - 2 in 2002. The data has a growing trend.
When looking into fire subcategories, the most reports belonged to: Structure Fires (40.8%), and Outside Fires (40.8%).
Fire incident types reported to NFIRS in Zip Code 38482

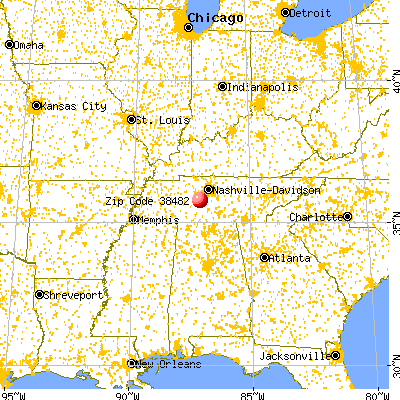


 Nearest zip codes: 38476, 38487, 38401, 37098, 38454, 37062.


 Based on the data from the years 2002 - 2018 the average number of fires per year is 13. The highest number of fires - 23 took place in 2006, and the least - 2 in 2002. The data has a growing trend.
 When looking into fire subcategories, the most reports belonged to: Structure Fires (40.8%), and Outside Fires (40.8%).