Estimated zip code population in 2022: 4,728 Zip code population in 2010: 3,717 Zip code population in 2000: 4,386
Houses and condos: 2,083 Renter-occupied apartments: 429
% of renters here:
24%
State:
33%
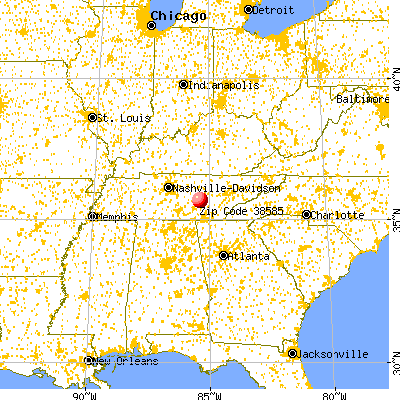
March 2022 cost of living index in zip code 38585: 78.9 (low, U.S. average is 100)
Land area: 165.8 sq. mi. Water area: 0.3 sq. mi.
Population density: 29 people per square mile
(very low).
OSM Map
General Map
Google Map
MSN Map
OSM Map
General Map
Google Map
MSN Map
OSM Map
General Map
Google Map
MSN Map
OSM Map
General Map
Google Map
MSN Map
Please wait while loading the map...
Real estate property taxes paid for housing units in 2022:
This zip code:
0.4% ($584)
Tennessee:
0.5% ($1,376)
Median real estate property taxes paid for housing units with mortgages in 2022: $946 (0.5%) Median real estate property taxes paid for housing units with no mortgage in 2022: $484 (0.4%)
Averages for the 2020 tax year for zip code 38585, filed in 2021:
Average Adjusted Gross Income (AGI) in 2020: $46,096 (Individual Income Tax Returns)
Here:
$46,096
State:
$69,014
Salary/wage: $38,432 (reported on 76.8% of returns)
Here:
$38,432
State:
$55,872
(% of AGI for various income ranges: 1011.7% for AGIs below $25k, 3510.0% for AGIs $25k-50k, 5747.4% for AGIs $50k-75k, 7657.3% for AGIs $75k-100k, 14982.5% for AGIs $100k-200k)
Taxable interest for individuals: $887 (reported on 27.4% of returns)
This zip code:
$887
Tennessee:
$1,945
(% of AGI for various income ranges: 14.2% for AGIs below $25k, 21.1% for AGIs $25k-50k, 37.4% for AGIs $50k-75k, 20.9% for AGIs $75k-100k, 87.5% for AGIs $100k-200k)
Ordinary dividends: $1,708 (reported on 7.7% of returns)
Here:
$1,708
State:
$8,105
(% of AGI for various income ranges: 2.3% for AGIs below $25k, 6.5% for AGIs $25k-50k, 35.3% for AGIs $50k-75k, 148.8% for AGIs $100k-200k)
Net capital gain/loss in AGI: +$13,557 (reported on 8.3% of returns)
Here:
+$13,557
State:
+$33,664
(% of AGI for various income ranges: 2.9% for AGIs below $25k, 33.5% for AGIs $25k-50k, 48.4% for AGIs $50k-75k, 2083.8% for AGIs $100k-200k)
Profit/loss from business: +$16,056 (reported on 19.0% of returns)
Here:
+$16,056
State:
+$18,991
(% of AGI for various income ranges: 217.5% for AGIs below $25k, 256.5% for AGIs $25k-50k, 601.6% for AGIs $50k-75k, 518.2% for AGIs $75k-100k, 1681.2% for AGIs $100k-200k)
Taxable individual retirement arrangement distribution: $17,885 (reported on 7.7% of returns)
38585:
$17,885
Tennessee:
$20,036
(% of AGI for various income ranges: 31.9% for AGIs below $25k, 74.6% for AGIs $25k-50k, 186.3% for AGIs $50k-75k, 1911.2% for AGIs $100k-200k)
Total itemized deductions: $37,350 (reported on 2.4% of returns)
Here:
$37,350
State:
$40,136
(% of AGI for various income ranges: 1867.5% for AGIs $100k-200k)
Charity contributions: $14,367 (reported on 1.8% of returns)
Here:
$14,367
State:
$19,852
(% of AGI for various income ranges: 538.8% for AGIs $100k-200k)
Taxes paid: $5,875 (reported on 2.4% of returns)
38585:
$5,875
State:
$6,038
(% of AGI for various income ranges: 293.8% for AGIs $100k-200k)
Earned income credit: $2,315 (reported on 24.4% of returns)
Here:
$2,315
State:
$2,391
(% of AGI for various income ranges: 116.3% for AGIs below $25k, 93.0% for AGIs $25k-50k)
Percentage of individuals using paid preparers for their 2020 taxes: 91.1%
Here:
91%
State:
93%
(% for various income ranges: 89.6% for AGIs below $25k, 89.6% for AGIs $25k-50k, 95.8% for AGIs $50k-75k, 92.9% for AGIs $75k-100k, 91.7% for AGIs $100k-200k, 100.0% for AGIs over 200k)
Averages for the 2012 tax year for zip code 38585, filed in 2013:
Average Adjusted Gross Income (AGI) in 2012: $35,714 (Individual Income Tax Returns)
Here:
$35,714
State:
$53,767
Salary/wage: $30,567 (reported on 84.4% of returns)
Here:
$30,567
State:
$45,421
(% of AGI for various income ranges: 73.4% for AGIs below $25k, 82.2% for AGIs $25k-50k, 83.9% for AGIs $50k-75k, 79.4% for AGIs $75k-100k, 34.6% for AGIs $100k-200k)
Taxable interest for individuals: $805 (reported on 25.9% of returns)
This zip code:
$805
Tennessee:
$1,732
(% of AGI for various income ranges: 0.8% for AGIs below $25k, 0.4% for AGIs $25k-50k, 0.3% for AGIs $50k-75k, 1.3% for AGIs $75k-100k, 0.4% for AGIs $100k-200k)
Ordinary dividends: $2,320 (reported on 6.8% of returns)
Here:
$2,320
State:
$6,739
Net capital gain/loss in AGI: +$9,373 (reported on 7.5% of returns)
Here:
+$9,373
State:
+$19,082
(% of AGI for various income ranges: 7.8% for AGIs below $25k, 0.4% for AGIs $25k-50k, 0.2% for AGIs $50k-75k, 13.3% for AGIs $75k-100k)
Profit/loss from business: +$7,238 (reported on 16.3% of returns)
Here:
+$7,238
State:
+$15,240
(% of AGI for various income ranges: 9.1% for AGIs below $25k, 2.9% for AGIs $25k-50k, 1.4% for AGIs $50k-75k, 3.6% for AGIs $75k-100k)
Taxable individual retirement arrangement distribution: $17,188 (reported on 5.4% of returns)
38585:
$17,188
Tennessee:
$15,505
(% of AGI for various income ranges: 3.5% for AGIs below $25k, 2.1% for AGIs $50k-75k, 11.3% for AGIs $75k-100k)
Total itemized deductions: $20,227 (26% of AGI, reported on 10.2% of returns)
Here:
$20,227
State:
$21,976
Here:
26.3% of AGI
State:
17.8% of AGI
(% of AGI for various income ranges: 2.7% for AGIs below $25k, 5.1% for AGIs $25k-50k, 4.9% for AGIs $50k-75k, 7.4% for AGIs $75k-100k, 10.1% for AGIs $100k-200k)
Charity contributions: $4,573 (reported on 7.5% of returns)
Here:
$4,573
State:
$6,709
(% of AGI for various income ranges: 0.8% for AGIs $25k-50k, 0.5% for AGIs $50k-75k, 2.0% for AGIs $75k-100k, 1.9% for AGIs $100k-200k)
Taxes paid: $3,247 (reported on 10.2% of returns)
38585:
$3,247
State:
$4,829
(% of AGI for various income ranges: 0.9% for AGIs $25k-50k, 0.7% for AGIs $50k-75k, 1.0% for AGIs $75k-100k, 2.1% for AGIs $100k-200k)
Earned income credit: $2,263 (reported on 29.3% of returns)
Here:
$2,263
State:
$2,404
(% of AGI for various income ranges: 7.6% for AGIs below $25k, 1.6% for AGIs $25k-50k)
Percentage of individuals using paid preparers for their 2012 taxes: 64.6%
Here:
65%
State:
52%
(% for various income ranges: 60.3% for AGIs below $25k, 65.1% for AGIs $25k-50k, 72.2% for AGIs $50k-75k, 75.0% for AGIs $75k-100k, 80.0% for AGIs $100k-200k)
Averages for the 2004 tax year for zip code 38585, filed in 2005:
Average Adjusted Gross Income (AGI) in 2004: $30,309 (Individual Income Tax Returns)
Here:
$30,309
State:
$44,088
Salary/wage: $28,043 (reported on 87.8% of returns)
Here:
$28,043
State:
$38,825
(% of AGI for various income ranges: 99.6% for AGIs below $10k, 81.5% for AGIs $10k-25k, 91.9% for AGIs $25k-50k, 90.2% for AGIs $50k-75k, 84.4% for AGIs $75k-100k, 20.7% for AGIs over 100k)
Taxable interest for individuals: $937 (reported on 31.6% of returns)
This zip code:
$937
Tennessee:
$1,802
(% of AGI for various income ranges: 2.6% for AGIs below $10k, 1.1% for AGIs $10k-25k, 0.9% for AGIs $25k-50k, 0.8% for AGIs $50k-75k, 0.5% for AGIs $75k-100k, 1.4% for AGIs over 100k)
Taxable dividends: $1,162 (reported on 5.5% of returns)
Here:
$1,162
State:
$3,727
(% of AGI for various income ranges: 1.7% for AGIs below $10k, 0.0% for AGIs $10k-25k, 0.1% for AGIs $25k-50k, 0.1% for AGIs $50k-75k, 0.9% for AGIs over 100k)
Net capital gain/loss: +$5,154 (reported on 6.3% of returns)
Here:
+$5,154
State:
+$15,776
(% of AGI for various income ranges: -0.6% for AGIs below $10k, 0.5% for AGIs $10k-25k, 0.8% for AGIs $25k-50k, 0.7% for AGIs $50k-75k, 2.6% for AGIs $75k-100k, 2.5% for AGIs over 100k)
Profit/loss from business: +$3,771 (reported on 16.9% of returns)
Here:
+$3,771
State:
+$12,882
(% of AGI for various income ranges: 1.8% for AGIs below $10k, 4.2% for AGIs $10k-25k, 2.0% for AGIs $25k-50k, -0.1% for AGIs $50k-75k, 5.7% for AGIs $75k-100k)
IRA payment deduction: $2,083 (reported on 0.8% of returns)
38585:
$2,083
Tennessee:
$2,934
Total itemized deductions: $13,850 (26% of AGI, reported on 6.9% of returns)
Here:
$13,850
State:
$18,035
Here:
26.5% of AGI
State:
19.9% of AGI
(% of AGI for various income ranges: 3.4% for AGIs $10k-25k, 2.6% for AGIs $25k-50k, 3.7% for AGIs $50k-75k, 7.1% for AGIs $75k-100k)
Charity contributions deductions: $3,222 (6% of AGI, reported on 5.0% of returns)
Here:
$3,222
State:
$5,167
Here:
5.8% of AGI
State:
5.3% of AGI
(% of AGI for various income ranges: 0.5% for AGIs $10k-25k, 0.5% for AGIs $25k-50k, 0.5% for AGIs $50k-75k, 1.5% for AGIs $75k-100k)
Total tax: $3,030 (reported on 71.3% of returns)
38585:
$3,030
State:
$7,482
(% of AGI for various income ranges: 4.9% for AGIs below $10k, 3.8% for AGIs $10k-25k, 6.0% for AGIs $25k-50k, 8.7% for AGIs $50k-75k, 10.6% for AGIs $75k-100k, 9.7% for AGIs over 100k)
Earned income credit: $1,664 (reported on 27.4% of returns)
Here:
$1,664
State:
$1,826
Percentage of individuals using paid preparers for their 2004 taxes: 66.6%
Here:
67%
State:
60%
(% for various income ranges: 61.3% for AGIs below $10k, 69.3% for AGIs $10k-25k, 65.4% for AGIs $25k-50k, 67.9% for AGIs $50k-75k, 74.2% for AGIs $75k-100k, 82.4% for AGIs over 100k)
Likely homosexual households (counted as self-reported same-sex unmarried-partner households)
Lesbian couples: 0.0% of all households
Gay men: 0.6% of all households
Household received Food Stamps/SNAP in the past 12 months: 496 Household did not receive Food Stamps/SNAP in the past 12 months: 1,309
Women who had a birth in the past 12 months: 49 (45 now married, 4 unmarried) Women who did not have a birth in the past 12 months: 827 (439 now married, 388 unmarried)
Housing units in zip code 38585 with a mortgage: 465 (7 second mortgage, 5 home equity loan, 3 both second mortgage and home equity loan) Houses without a mortgage: 25
Median monthly owner costs for units with a mortgage: $931 Median monthly owner costs for units without a mortgage: $320
Residents with income below the poverty level in 2022:
This zip code:
17.9%
Whole state:
13.3%
Residents with income below 50% of the poverty level in 2022:
This zip code:
7.4%
Whole state:
7.1%
Median number of rooms in houses and condos:
Here:
5.9
State:
6.5
Median number of rooms in apartments:
Here:
4.7
State:
4.4
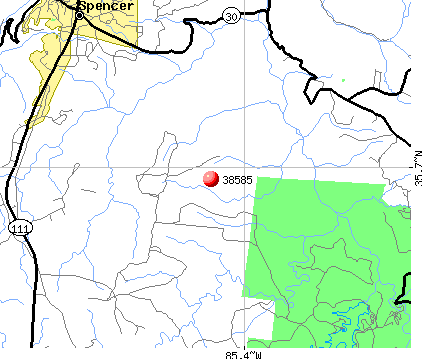
Notable locations in this zip code not listed on our city pages
Notable locations in zip code 38585: Piney Volunteer Fire Department Station 1 (A), Spencer Fire and Rescue (B), Van Buren County Courthouse (C), Piney Volunteer Fire Department Station 2 (D), Fall Creek Falls Volunteer Fire Department (E), Van Buren County Ambulance Service (F). Display/hide their locations on the map
Churches in zip code 38585 include: Piney Church of Christ (A), Welchland Baptist Church (B), Highland Church (C), Bellview Church (D), Bethlehem Church (E), Cane Creek Church (F), Mount Elim Church (G), Shockley Church (H). Display/hide their locations on the map
Cemeteries: Walling Cemetery (1), Shockley Cemetery (2), Lonewood Cemetery (3), Hale Cemetery (4), Miller Cemetery (5), Spencer Cemetery (6), Mooneyham Cemetery (7). Display/hide their locations on the map
Streams, rivers, and creeks: Longrock Branch (A), Long Fork Creek (B), Little Sink Branch (C), Lick Branch (D), Indian Camp Branch (E), Howard Branch (F), Harrison Gulf Branch (G), Green Sea Branch (H), Glade Creek (I). Display/hide their locations on the map
In group quarters: 101 (-1 institutionalized population)
Size of family households: 470 2-persons, 189 3-persons, 150 4-persons, 146 5-persons, 81 6-persons, 119 7-or-more-persons
Size of nonfamily households: 584 1-person, 82 2-persons
733 married couples with children.
183 single-parent households (70 men, 113 women).
94.7% of residents of 38585 zip code speak English at home.
5.3% of residents speak other Indo-European language at home (42% very well, 44% well, 14% not at all).
Foreign born population: 0 (0.0%)
:
0.0%
Whole state:
5.6%
30%American
17%English
11%Irish
10%German
7%Scotch-Irish
5%Swiss
3%Scottish
Year of entry for the foreign-born population
02010 or later
02000 to 2009
01990 to 1999
2Before 1990
Facilities with environmental interests located in this zip code:
COLE APPAREL CORP. (P.O. BOX 155 in SPENCER, TN)
(Resource Conservation and Recovery Act (tracking hazardous waste)) Business NAICS classification: OUTERWEAR KNITTING MILLS.
Housing units lacking complete plumbing facilities: 8.0% Housing units lacking complete kitchen facilities: 8.4%
62.5%Electricity
11.6%Bottled, tank, or LP gas
11.5%Wood
10.8%Utility gas
3.7%Fuel oil, kerosene, etc.
Population in 1990: 3,954. Population change in the 1990s: +432 (+10.9%).
Place of birth for U.S.-born residents:
This state: 3,333
Northeast: 187
Midwest: 428
South: 681
West: 54
72% of the 38585 zip code residents lived in the same house 5 years ago. Out of people who lived in different houses, 40% lived in this county. Out of people who lived in different counties, 50% lived in Tennessee.
90% of the 38585 zip code residents lived in the same house 1 year ago. Out of people who lived in different houses, 47% moved from this county. Out of people who lived in different houses, 44% moved from different county within same state. Out of people who lived in different houses, 4% moved from different state. Out of people who lived in different houses, 5% moved from abroad.
Private vs. public school enrollment:
Students in private schools in grades 1 to 8 (elementary and middle school): 137
Here:
29.3%
Tennessee:
15.0%
Students in private schools in grades 9 to 12 (high school):
Here:
0.0%
Tennessee:
16.2%
Students in private undergraduate colleges:
Here:
0.0%
Tennessee:
23.5%
Occupation by median earnings in the past 12 months ($)
66,191Architecture and engineering occupations
61,637Health diagnosing and treating practitioners and other technical occupations
56,271Business and financial operations occupations
55,317Education, training, and library occupations
52,312Management occupations
44,689Material moving occupations
Top industries in this zip code by the number of employees in 2005:
Health Care and Social Assistance: Nursing Care Facilities (50-99: 1)
Finance and Insurance: Commercial Banking (10-19: 1)
Finance and Insurance: Insurance Agencies and Brokerages (5-9: 1, 1-4: 1)
People in group quarters in 2010:
73 people in nursing facilities/skilled-nursing facilities
21 people in local jails and other municipal confinement facilities
People in group quarters in 2000:
61 people in nursing homes
17 people in local jails and other confinement facilities (including police lockups)
Fatal accident statistics in 2014:
Fatal accident count: 3
Vehicles involved in fatal accidents: 3
Fatal accidents caused by drunken drivers: 1
Fatalities: 3
Persons involved in fatal accidents: 3
Pedestrians involved in fatal accidents: 0
Fatal accident statistics in 2011:
Fatal accident count: 1
Vehicles involved in fatal accidents: 1
Fatal accidents caused by drunken drivers: 1
Fatalities: 2
Persons involved in fatal accidents: 3
Pedestrians involved in fatal accidents: 0
2002 - 2018 National Fire Incident Reporting System (NFIRS) incidents
Based on the data from the years 2002 - 2018 the average number of fires per year is 59. The highest number of fire incidents - 93 took place in 2008, and the least - 6 in 2002. The data has an increasing trend.
When looking into fire subcategories, the most incidents belonged to: Outside Fires (45.8%), and Structure Fires (42.3%).
Fire incident types reported to NFIRS in Zip Code 38585


 Nearest zip codes: 38581, 38559, 37327, 38579, 37365, 37367.


 Based on the data from the years 2002 - 2018 the average number of fires per year is 59. The highest number of fire incidents - 93 took place in 2008, and the least - 6 in 2002. The data has an increasing trend.
 When looking into fire subcategories, the most incidents belonged to: Outside Fires (45.8%), and Structure Fires (42.3%).