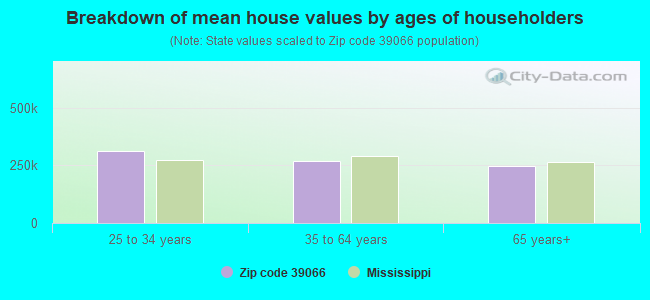
Estimated median house/condo value in 2022: $150,985
39066:
$150,985
Mississippi:
$162,500
According to our research of Mississippi and other state lists, there were 8 registered sex offenders living in 39066 zip code as of June 09, 2024. The ratio of all residents to sex offenders in zip code 39066 is 549 to 1. The ratio of registered sex offenders to all residents in this zip code is lower than the state average.
Median resident age:
This zip code:
42.5 years
Mississippi median age:
38.9 years
Average household size:
This zip code:
2.5 people
Mississippi:
2.5 people
Averages for the 2020 tax year for zip code 39066, filed in 2021:
Average Adjusted Gross Income (AGI) in 2020: $43,292 (Individual Income Tax Returns)
Here:
$43,292
State:
$54,084
Salary/wage: $37,390 (reported on 81.1% of returns)
Here:
$37,390
State:
$45,187
(% of AGI for various income ranges: 1263.5% for AGIs below $25k, 3700.4% for AGIs $25k-50k, 7053.6% for AGIs $50k-75k, 11236.0% for AGIs $75k-100k, 14896.2% for AGIs $100k-200k)
Taxable interest for individuals: $507 (reported on 15.8% of returns)
This zip code:
$507
Mississippi:
$1,434
(% of AGI for various income ranges: 1.4% for AGIs below $25k, 6.3% for AGIs $25k-50k, 18.6% for AGIs $50k-75k, 20.0% for AGIs $75k-100k, 95.0% for AGIs $100k-200k)
Ordinary dividends: $3,230 (reported on 5.3% of returns)
Here:
$3,230
State:
$6,661
(% of AGI for various income ranges: 2.4% for AGIs below $25k, 35.0% for AGIs $50k-75k, 323.8% for AGIs $100k-200k)
Net capital gain/loss in AGI: +$13,430 (reported on 5.3% of returns)
Here:
+$13,430
State:
+$16,833
(% of AGI for various income ranges: 9.4% for AGIs $25k-50k, 87.9% for AGIs $50k-75k, 1467.5% for AGIs $100k-200k)
Profit/loss from business: +$4,220 (reported on 15.8% of returns)
Here:
+$4,220
State:
+$7,724
(% of AGI for various income ranges: 106.2% for AGIs below $25k, 76.4% for AGIs $50k-75k, 627.5% for AGIs $100k-200k)
Taxable individual retirement arrangement distribution: $13,250 (reported on 4.2% of returns)
39066:
$13,250
Mississippi:
$17,717
(% of AGI for various income ranges: 25.2% for AGIs below $25k, 57.3% for AGIs $25k-50k, 1240.0% for AGIs $75k-100k)
Total itemized deductions: $26,225 (reported on 6.3% of returns)
Here:
$26,225
State:
$34,027
(% of AGI for various income ranges: 192.4% for AGIs $25k-50k, 777.9% for AGIs $50k-75k, 1393.8% for AGIs $100k-200k)
Charity contributions: $10,650 (reported on 5.3% of returns)
Here:
$10,650
State:
$14,997
(% of AGI for various income ranges: 48.0% for AGIs $25k-50k, 230.0% for AGIs $50k-75k, 635.0% for AGIs $100k-200k)
Taxes paid: $4,825 (reported on 6.3% of returns)
39066:
$4,825
State:
$6,353
(% of AGI for various income ranges: 22.9% for AGIs $25k-50k, 116.4% for AGIs $50k-75k, 380.0% for AGIs $100k-200k)
Earned income credit: $2,637 (reported on 31.6% of returns)
Here:
$2,637
State:
$2,689
(% of AGI for various income ranges: 167.9% for AGIs below $25k, 106.9% for AGIs $25k-50k)
Percentage of individuals using paid preparers for their 2020 taxes: 92.1%
Here:
92%
State:
94%
(% for various income ranges: 92.6% for AGIs below $25k, 91.9% for AGIs $25k-50k, 90.5% for AGIs $50k-75k, 90.0% for AGIs $75k-100k, 92.3% for AGIs $100k-200k, 100.0% for AGIs over 200k)
Averages for the 2012 tax year for zip code 39066, filed in 2013:
Average Adjusted Gross Income (AGI) in 2012: $37,016 (Individual Income Tax Returns)
Here:
$37,016
State:
$46,197
Salary/wage: $30,793 (reported on 87.4% of returns)
Here:
$30,793
State:
$38,549
(% of AGI for various income ranges: 83.8% for AGIs below $25k, 88.9% for AGIs $25k-50k, 80.7% for AGIs $50k-75k, 68.5% for AGIs $75k-100k, 46.1% for AGIs $100k-200k)
Taxable interest for individuals: $367 (reported on 14.2% of returns)
This zip code:
$367
Mississippi:
$1,482
(% of AGI for various income ranges: 0.1% for AGIs $25k-50k, 0.3% for AGIs $50k-75k, 0.1% for AGIs $75k-100k, 0.2% for AGIs $100k-200k)
Ordinary dividends: $3,090 (reported on 5.3% of returns)
Here:
$3,090
State:
$5,401
(% of AGI for various income ranges: 0.1% for AGIs $50k-75k, 1.5% for AGIs $100k-200k)
Net capital gain/loss in AGI: +$18,557 (reported on 3.7% of returns)
Here:
+$18,557
State:
+$12,121
(% of AGI for various income ranges: 0.3% for AGIs $50k-75k, 6.5% for AGIs $100k-200k)
Profit/loss from business: +$5,010 (reported on 15.8% of returns)
Here:
+$5,010
State:
+$10,220
(% of AGI for various income ranges: 6.9% for AGIs below $25k, 0.4% for AGIs $25k-50k, 1.4% for AGIs $50k-75k, 4.2% for AGIs $75k-100k)
Taxable individual retirement arrangement distribution: $7,367 (reported on 4.7% of returns)
39066:
$7,367
Mississippi:
$13,665
(% of AGI for various income ranges: 1.2% for AGIs below $25k, 0.7% for AGIs $25k-50k, 3.4% for AGIs $50k-75k)
Total itemized deductions: $19,866 (25% of AGI, reported on 20.0% of returns)
Here:
$19,866
State:
$22,078
Here:
25.2% of AGI
State:
21.8% of AGI
(% of AGI for various income ranges: 3.9% for AGIs below $25k, 10.3% for AGIs $25k-50k, 13.7% for AGIs $50k-75k, 16.1% for AGIs $75k-100k, 12.2% for AGIs $100k-200k)
Charity contributions: $6,310 (reported on 16.3% of returns)
Here:
$6,310
State:
$6,081
(% of AGI for various income ranges: 0.8% for AGIs below $25k, 2.2% for AGIs $25k-50k, 3.5% for AGIs $50k-75k, 3.3% for AGIs $75k-100k, 4.1% for AGIs $100k-200k)
Taxes paid: $4,479 (reported on 20.0% of returns)
39066:
$4,479
State:
$5,794
(% of AGI for various income ranges: 0.6% for AGIs below $25k, 1.5% for AGIs $25k-50k, 2.8% for AGIs $50k-75k, 3.1% for AGIs $75k-100k, 4.2% for AGIs $100k-200k)
Earned income credit: $2,795 (reported on 42.6% of returns)
Here:
$2,795
State:
$2,710
(% of AGI for various income ranges: 14.1% for AGIs below $25k, 1.7% for AGIs $25k-50k)
Percentage of individuals using paid preparers for their 2012 taxes: 56.3%
Here:
56%
State:
60%
(% for various income ranges: 54.5% for AGIs below $25k, 55.6% for AGIs $25k-50k, 61.1% for AGIs $50k-75k, 55.6% for AGIs $75k-100k, 70.0% for AGIs $100k-200k)
Averages for the 2004 tax year for zip code 39066, filed in 2005:
Average Adjusted Gross Income (AGI) in 2004: $29,389 (Individual Income Tax Returns)
Here:
$29,389
State:
$36,110
Salary/wage: $26,218 (reported on 92.4% of returns)
Here:
$26,218
State:
$31,757
(% of AGI for various income ranges: 126.7% for AGIs below $10k, 89.5% for AGIs $10k-25k, 90.1% for AGIs $25k-50k, 80.1% for AGIs $50k-75k, 79.2% for AGIs $75k-100k, 52.7% for AGIs over 100k)
Taxable interest for individuals: $623 (reported on 18.9% of returns)
This zip code:
$623
Mississippi:
$1,649
(% of AGI for various income ranges: 1.0% for AGIs below $10k, 0.3% for AGIs $10k-25k, 0.3% for AGIs $25k-50k, 0.5% for AGIs $50k-75k, 0.6% for AGIs $75k-100k, 0.3% for AGIs over 100k)
Taxable dividends: $579 (reported on 5.8% of returns)
Here:
$579
State:
$3,089
(% of AGI for various income ranges: 0.1% for AGIs below $10k, 0.1% for AGIs $10k-25k, 0.1% for AGIs $25k-50k, 0.1% for AGIs $50k-75k, 0.2% for AGIs $75k-100k, 0.2% for AGIs over 100k)
Net capital gain/loss: +$3,925 (reported on 5.5% of returns)
Here:
+$3,925
State:
+$8,427
(% of AGI for various income ranges: -0.1% for AGIs $10k-25k, 0.2% for AGIs $25k-50k, 0.7% for AGIs $50k-75k, 1.1% for AGIs $75k-100k, 3.0% for AGIs over 100k)
Profit/loss from business: +$4,030 (reported on 10.3% of returns)
Here:
+$4,030
State:
+$8,818
(% of AGI for various income ranges: 4.6% for AGIs below $10k, 1.7% for AGIs $10k-25k, 0.5% for AGIs $25k-50k, 3.3% for AGIs $50k-75k, 1.3% for AGIs $75k-100k)
IRA payment deduction: $1,667 (reported on 0.8% of returns)
39066:
$1,667
Mississippi:
$3,024
Total itemized deductions: $16,893 (27% of AGI, reported on 16.7% of returns)
Here:
$16,893
State:
$17,896
Here:
26.6% of AGI
State:
22.5% of AGI
(% of AGI for various income ranges: 5.3% for AGIs $10k-25k, 9.0% for AGIs $25k-50k, 12.8% for AGIs $50k-75k, 13.1% for AGIs $75k-100k, 12.5% for AGIs over 100k)
Charity contributions deductions: $4,617 (7% of AGI, reported on 14.4% of returns)
Here:
$4,617
State:
$4,735
Here:
7.0% of AGI
State:
5.7% of AGI
(% of AGI for various income ranges: 0.9% for AGIs $10k-25k, 1.8% for AGIs $25k-50k, 3.2% for AGIs $50k-75k, 3.8% for AGIs $75k-100k, 3.6% for AGIs over 100k)
Total tax: $4,304 (reported on 54.9% of returns)
39066:
$4,304
State:
$5,562
(% of AGI for various income ranges: 1.8% for AGIs below $10k, 1.9% for AGIs $10k-25k, 5.4% for AGIs $25k-50k, 9.5% for AGIs $50k-75k, 10.9% for AGIs $75k-100k, 20.2% for AGIs over 100k)
Earned income credit: $2,140 (reported on 42.1% of returns)
Here:
$2,140
State:
$2,107
Percentage of individuals using paid preparers for their 2004 taxes: 56.2%
Here:
56%
State:
65%
(% for various income ranges: 57.7% for AGIs below $10k, 54.1% for AGIs $10k-25k, 53.4% for AGIs $25k-50k, 61.9% for AGIs $50k-75k, 64.1% for AGIs $75k-100k, 72.9% for AGIs over 100k)
Household received Food Stamps/SNAP in the past 12 months: 195 Household did not receive Food Stamps/SNAP in the past 12 months: 1,760
Women who had a birth in the past 12 months: 12 (9 now married, 3 unmarried) Women who did not have a birth in the past 12 months: 870 (173 now married, 698 unmarried)
Housing units in zip code 39066 with a mortgage: 665 (8 second mortgage, 8 both second mortgage and home equity loan) Houses without a mortgage: 52
Median monthly owner costs for units with a mortgage: $1,145 Median monthly owner costs for units without a mortgage: $594
Residents with income below the poverty level in 2022:
This zip code:
27.5%
Whole state:
19.1%
Residents with income below 50% of the poverty level in 2022:
This zip code:
6.0%
Whole state:
10.3%
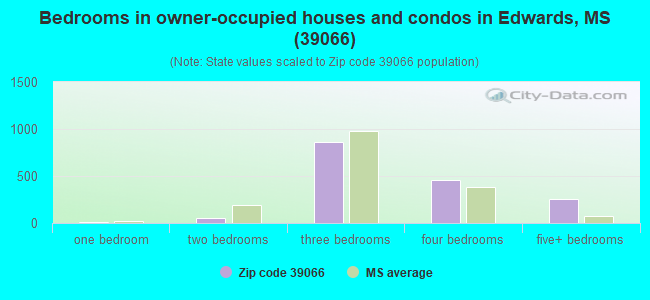
Median number of rooms in houses and condos:
Here:
6.2
State:
6.3
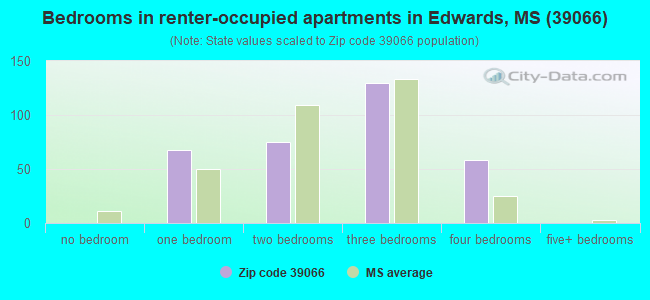
Median number of rooms in apartments:
Here:
5.2
State:
4.8
Notable locations in this zip code not listed on our city pages
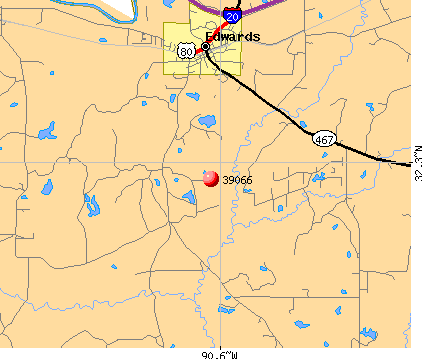
Churches in zip code 39066 include: New Hope Church (A), Oak Ridge Church (B), Morning Star Church (C), Pilgrim Rest Church (D), Pleasant Green Church (E), Pleasant Grove Church (F), Poplar Grove Church (G), Ratliff Chapel (H), Saint James Church (I). Display/hide their locations on the map
Cemeteries: Cook Cemetery (1), Edwards Cemetery (2), Friendship Cemetery (3), Montgomery Cemetery (4), Morrison Cemetery (5), Nalley Cemetery (6), Auburn Cemetery (7). Display/hide their locations on the map
Lakes and reservoirs: Horseshoe Lake (A), Askew Pond (B), Gin Lake (C), Gibbs Lake (D), Old River Lake (E), Buzzard Lake (F), Armstrong Pond (G), Lake Adanac (H). Display/hide their locations on the map
Streams, rivers, and creeks: Blue Bayou (A), Belches Bayou (B), Bakers Creek (C), Adams Bayou (D), Twelvemile Creek (E), Turkey Creek (F), Terrell Creek (G), Simms Creek (H), Shiloh Creek (I). Display/hide their locations on the map
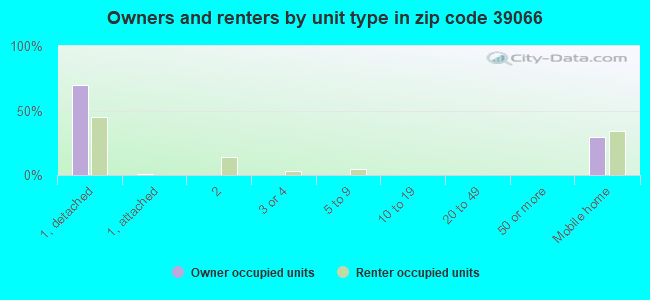
Size of family households: 477 2-persons, 350 3-persons, 226 4-persons, 88 5-persons, 47 6-persons, 8 7-or-more-persons
Size of nonfamily households: 708 1-person, 49 2-persons
220 married couples with children.
590 single-parent households (239 men, 351 women).
99.7% of residents of 39066 zip code speak English at home.
0.3% of residents speak other Indo-European language at home (100% very well).
0.2% of residents speak other language at home (100% very well).
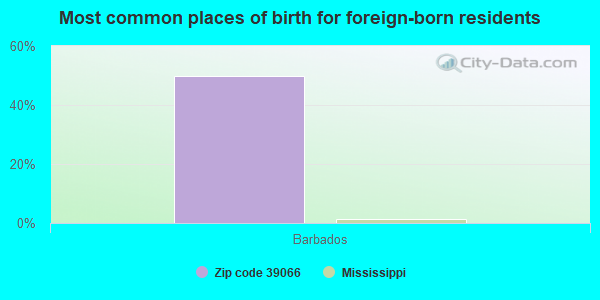
Foreign born population: 2 (0.0%) (0.0% of them are naturalized citizens)
:
0.0%
Whole state:
2.2%
50%Barbados
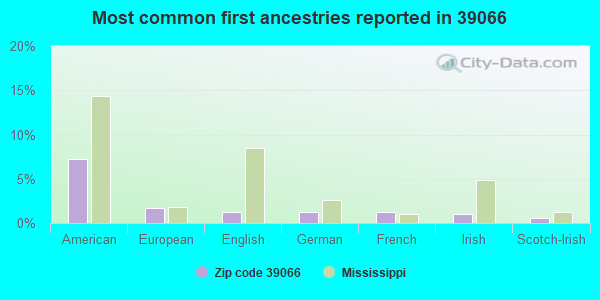
7%American
2%European
1%English
1%German
1%French
1%Irish
1%Scotch-Irish
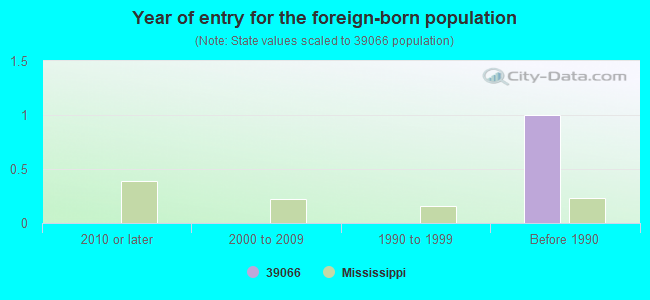
Year of entry for the foreign-born population
02010 or later
02000 to 2009
01990 to 1999
1Before 1990
Facilities with environmental interests located in this zip code:
CHARLES DONALD PULPWOOD INC, EDWARDS WOODYARD (1563 CEMETARY ROAD in EDWARDS, MS)
STATE MASTER (Mississippi compliance, permits, activity tracking ) - ENSITE-MS0055565, National Pollutant Discharge Elimination System Permit National Pollutant Discharge Elimination System NON-MAJOR (Tracking pollutant discharge elimination systems) - permit Business SIC classification: LOGGING Alternative names: HINDS COUNTY
EDWARDS POTW, SOUTHEAST (HIGHWAY 467 in EDWARDS, MS)
STATE MASTER (Mississippi compliance, permits, activity tracking ) - ENSITE-MS0036382, National Pollutant Discharge Elimination System Permit National Pollutant Discharge Elimination System NON-MAJOR (Tracking pollutant discharge elimination systems) - permit Business SIC classification: SEWERAGE SYSTEMS Alternative names: HINDS COUNTY
EDWARDS POTW, WEST (310 FRONT STREET in EDWARDS, MS)
STATE MASTER (Mississippi compliance, permits, activity tracking ) - ENSITE-MS0036374, National Pollutant Discharge Elimination System Permit National Pollutant Discharge Elimination System NON-MAJOR (Tracking pollutant discharge elimination systems) - permit Business SIC classification: SEWERAGE SYSTEMS Alternative names: HINDS COUNTY
GRAYS FLYING SERVICE INC (19798 HIGHWAY 80 WEST in EDWARDS, MS)
STATE MASTER (Mississippi compliance, permits, activity tracking ) - ENSITE-MSU084141, WASTEWATER FACILITY National Pollutant Discharge Elimination System NON-MAJOR (Tracking pollutant discharge elimination systems) - permit Business SIC classification: CROP PLANTING, CULTIVATING, AND PROTECTING Alternative names: HINDS
CAL MAINE FOODS INC, FEED DIVISION (OLD HIGHWAY 80 WEST in EDWARDS, MS)
STATE MASTER (Mississippi compliance, permits, activity tracking ) - ENSITE-04900184, AIR PROGRAM, ENSITE-108000184, CRITERIA AND HAZARDOUS AIR POLLUTANT INVENTORY (Inventory of air pollution sources) Business SIC classification: FLOUR AND OTHER GRAIN MILL PRODUCTS; PREPARED FEEDS AND FEED INGREDIENTS FOR ANIMALS AND FOWLS, EXCEPT DOGS AND CATS
CENTRAL MISS CROSSTIE COMPANY, INC. (CEMETARY ROAD in EDWARDS, MS)
(Resource Conservation and Recovery Act (tracking hazardous waste)) Business NAICS classification: WOOD PRESERVATION. Organizations: CENTRAL MISSISSIPPI CROSSTIE COMPANY (CONTACT/OWNER)
HINDS COUNTY (MILITARY ROAD in EDWARDS, MS)
National Pollutant Discharge Elimination System NON-MAJOR (Tracking pollutant discharge elimination systems) - permit Business SIC classification: CHICKEN EGGS Alternative names: CAL MAINE FARMS
Housing units lacking complete plumbing facilities: 9.5% Housing units lacking complete kitchen facilities: 9.0%
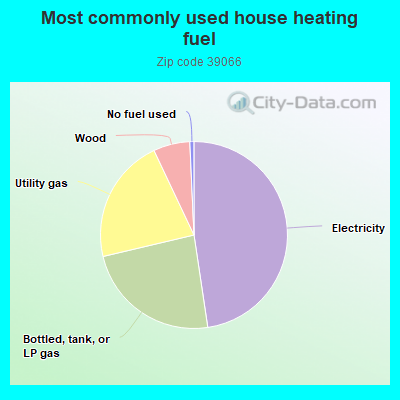
47.5%Electricity
23.6%Bottled, tank, or LP gas
21.6%Utility gas
6.3%Wood
0.7%No fuel used
Population in 1990: 4,144. Population change in the 1990s: +645 (+15.6%).
Place of birth for U.S.-born residents:
This state: 4,197
Northeast: 29
Midwest: 123
South: 326
West: 233
67% of the 39066 zip code residents lived in the same house 5 years ago. Out of people who lived in different houses, 76% lived in this county. Out of people who lived in different counties, 50% lived in Mississippi.
97% of the 39066 zip code residents lived in the same house 1 year ago. Out of people who lived in different houses, 84% moved from this county. Out of people who lived in different houses, 8% moved from different state. Out of people who lived in different houses, 10% moved from abroad.
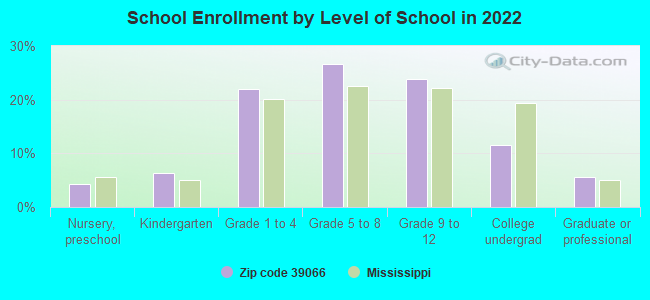
Private vs. public school enrollment:
Students in private schools in grades 1 to 8 (elementary and middle school): 210
Here:
33.0%
Mississippi:
16.1%
Students in private schools in grades 9 to 12 (high school): 124
Here:
38.6%
Mississippi:
14.6%
Students in private undergraduate colleges: 48
Here:
33.5%
Mississippi:
12.8%
Occupation by median earnings in the past 12 months ($)
89,842Architecture and engineering occupations
70,786Transportation occupations
67,915Management occupations
66,462Business and financial operations occupations
60,673Life, physical, and social science occupations
48,085Law enforcement workers including supervisors
Companies with federal contracts located in this zip code:
R W R & ASSOCIATES (13820 I 20 in EDWARDS, MS; small business) : $686,647 in 16 contractsfrom 2002 to 2006
Contracts for Other Research and Development -- Applied Research and Exploratory Development (R&D) by Army Signed by year:2000: $0; 2001: $0; 2002: $79,214; 2003: $320,062; 2004: $133,513; 2005: $9,251; 2006: $144,607.
Biggest contracts:
$127,327 with Army for Other Research and Development -- Applied Research and Exploratory Development (R&D). Signed on 2003-08-29. Completion date: 2004-02-28.
$79,214, same as above.Signed on 2002-08-27. Completion date: 2002-12-31.
$64,880, same as above.Signed on 2006-03-20. Completion date: 2006-09-17.
$60,000, same as above.Signed on 2003-09-17. Completion date: 2004-02-28.
COMPUTATIONAL HYDRAULICS & TRA (300 FRONT ST in EDWARDS, MS; small business) : $536,240 in 13 contractsfrom 2001 to 2005
Contracts for Data Analyses (other than scientific), Other Special Studies and Analyses, Oceanological Studies, ADPE System Configuration, and moreby U.S. Army Corps of Engineers - civil program financing only, Army Signed by year:2000: $0; 2001: $6,400; 2002: $126,766; 2003: $53,624; 2004: $216,400; 2005: $133,050; 2006: $0.
Biggest contracts:
$102,200 with U.S. Army Corps of Engineers - civil program financing only for Data Analyses (other than scientific). Signed on 2002-09-19. Completion date: 2004-03-30.
$88,200 with Army for Data Analyses (other than scientific). Signed on 2004-03-25. Completion date: 2004-03-30.
$88,200 with U.S. Army Corps of Engineers - civil program financing only for Data Analyses (other than scientific). Signed on 2004-03-25. Completion date: 2004-03-30.
$66,525 with Army for Other Special Studies and Analyses. Signed on 2005-08-17. Completion date: 2005-08-18.
MARY BROOKS (1840 ANDERSON ROAD in EDWARDS, MS; small business) : $15,429 in 6 contractsfrom 2002 to 2003
Contracts for Technical Assistance by Army, U.S. Army Corps of Engineers - civil program financing only Signed by year:2000: $0; 2001: $0; 2002: $9,995; 2003: $5,434; 2004: $0; 2005: $0; 2006: $0.
Biggest contracts:
$8,466 with Army for Technical Assistance. Signed on 2002-05-03. Completion date: 2002-12-31.
$8,015 with U.S. Army Corps of Engineers - civil program financing only for Technical Assistance. Signed on 2003-05-28. Completion date: 2003-12-31.
$770 with Army for Technical Assistance. Signed on 2002-04-09. Completion date: 2002-12-31.
$759 with U.S. Army Corps of Engineers - civil program financing only for Technical Assistance. Signed on 2002-01-17. Completion date: 2002-12-31.
Top industries in this zip code by the number of employees in 2005:
Health Care and Social Assistance: Child Day Care Services (20-49 employees: 1 establishment)
Construction: Other Heavy and Civil Engineering Construction (10-19: 1, 5-9: 1)
Wholesale Trade: Industrial Machinery and Equipment Merchant Wholesalers (10-19: 1)
Other Services (except Public Administration): Religious Organizations (5-9: 1)
Health Care and Social Assistance: Homes for the Elderly (5-9: 1)
Information: Data Processing, Hosting, and Related Services (5-9: 1)
Wholesale Trade: Recyclable Material Merchant Wholesalers (5-9: 1)
Health Care and Social Assistance: Offices of Dentists (5-9: 1)
People in group quarters in 2000:
8 people in nursing homes
Fatal accident statistics in 2014:
Fatal accident count: 2
Vehicles involved in fatal accidents: 3
Fatal accidents caused by drunken drivers: 1
Fatalities: 2
Persons involved in fatal accidents: 5
Pedestrians involved in fatal accidents: 0
Fatal accident statistics in 2012:
Fatal accident count: 1
Vehicles involved in fatal accidents: 1
Fatal accidents caused by drunken drivers: 0
Fatalities: 1
Persons involved in fatal accidents: 1
Pedestrians involved in fatal accidents: 0
Home Mortgage Disclosure Act Aggregated Statistics For Year 2009 (Based on 4 partial tracts)
A) FHA, FSA/RHS & VA Home Purchase Loans
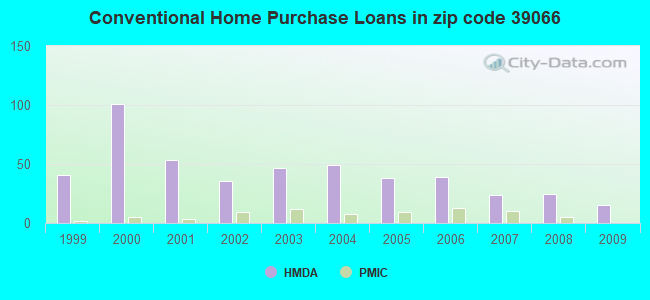
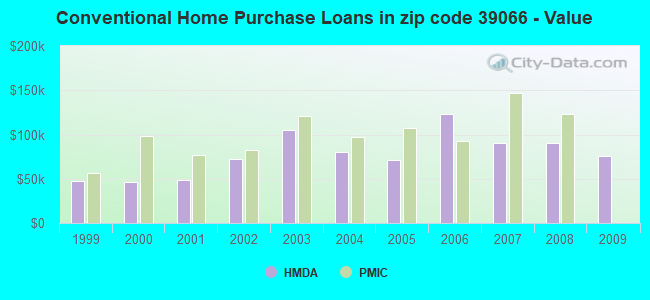
B) Conventional Home Purchase Loans
C) Refinancings
D) Home Improvement Loans
F) Non-occupant Loans on < 5 Family Dwellings (A B C & D)
G) Loans On Manufactured Home Dwelling (A B C & D)
Number
Average Value
Number
Average Value
Number
Average Value
Number
Average Value
Number
Average Value
Number
Average Value
LOANS ORIGINATED
10
$101,661
15
$75,313
51
$135,595
10
$10,686
7
$90,134
13
$50,490
APPLICATIONS APPROVED, NOT ACCEPTED
1
$129,620
4
$115,255
2
$108,960
0
$0
0
$0
4
$83,450
APPLICATIONS DENIED
5
$89,940
21
$50,248
26
$126,769
14
$31,286
2
$111,020
14
$40,360
APPLICATIONS WITHDRAWN
0
$0
5
$35,646
12
$127,978
1
$4,800
1
$18,000
2
$14,400
FILES CLOSED FOR INCOMPLETENESS
0
$0
0
$0
3
$87,867
1
$24,000
0
$0
2
$56,660
Aggregated Statistics For Year 2008 (Based on 4 partial tracts)
A) FHA, FSA/RHS & VA Home Purchase Loans
B) Conventional Home Purchase Loans
C) Refinancings
D) Home Improvement Loans
F) Non-occupant Loans on < 5 Family Dwellings (A B C & D)
G) Loans On Manufactured Home Dwelling (A B C & D)
Number
Average Value
Number
Average Value
Number
Average Value
Number
Average Value
Number
Average Value
Number
Average Value
LOANS ORIGINATED
6
$94,090
25
$90,916
36
$166,186
16
$31,985
5
$287,138
17
$40,133
APPLICATIONS APPROVED, NOT ACCEPTED
0
$0
7
$78,679
5
$128,842
0
$0
1
$27,620
4
$51,565
APPLICATIONS DENIED
0
$0
14
$77,969
36
$121,182
23
$15,280
0
$0
19
$44,602
APPLICATIONS WITHDRAWN
0
$0
1
$206,720
12
$120,373
1
$24,000
2
$46,610
1
$48,010
FILES CLOSED FOR INCOMPLETENESS
1
$152,430
0
$0
3
$266,007
0
$0
0
$0
0
$0
Aggregated Statistics For Year 2007 (Based on 4 partial tracts)
A) FHA, FSA/RHS & VA Home Purchase Loans
B) Conventional Home Purchase Loans
C) Refinancings
D) Home Improvement Loans
F) Non-occupant Loans on < 5 Family Dwellings (A B C & D)
G) Loans On Manufactured Home Dwelling (A B C & D)
Number
Average Value
Number
Average Value
Number
Average Value
Number
Average Value
Number
Average Value
Number
Average Value
LOANS ORIGINATED
6
$90,267
24
$90,036
52
$114,192
29
$37,997
5
$164,130
21
$35,293
APPLICATIONS APPROVED, NOT ACCEPTED
0
$0
11
$53,821
10
$134,058
1
$50,640
0
$0
9
$47,261
APPLICATIONS DENIED
0
$0
36
$58,581
46
$135,696
20
$35,453
6
$43,438
26
$47,250
APPLICATIONS WITHDRAWN
0
$0
3
$122,397
14
$113,121
4
$21,570
1
$35,450
3
$34,303
FILES CLOSED FOR INCOMPLETENESS
0
$0
3
$170,277
5
$144,934
0
$0
2
$128,935
0
$0
Aggregated Statistics For Year 2006 (Based on 4 partial tracts)
A) FHA, FSA/RHS & VA Home Purchase Loans
B) Conventional Home Purchase Loans
C) Refinancings
D) Home Improvement Loans
E) Loans on Dwellings For 5+ Families
F) Non-occupant Loans on < 5 Family Dwellings (A B C & D)
G) Loans On Manufactured Home Dwelling (A B C & D)
Number
Average Value
Number
Average Value
Number
Average Value
Number
Average Value
Number
Average Value
Number
Average Value
Number
Average Value
LOANS ORIGINATED
10
$84,475
39
$122,750
59
$99,833
37
$28,048
1
$124,820
8
$79,055
22
$34,820
APPLICATIONS APPROVED, NOT ACCEPTED
2
$47,410
25
$66,377
10
$112,474
0
$0
0
$0
0
$0
23
$43,627
APPLICATIONS DENIED
2
$82,965
42
$65,700
72
$82,330
27
$19,816
0
$0
5
$52,362
35
$34,182
APPLICATIONS WITHDRAWN
0
$0
7
$86,889
14
$109,943
3
$7,537
0
$0
0
$0
2
$26,930
FILES CLOSED FOR INCOMPLETENESS
1
$81,610
6
$147,810
10
$66,536
0
$0
0
$0
0
$0
0
$0
Aggregated Statistics For Year 2005 (Based on 4 partial tracts)
A) FHA, FSA/RHS & VA Home Purchase Loans
B) Conventional Home Purchase Loans
C) Refinancings
D) Home Improvement Loans
F) Non-occupant Loans on < 5 Family Dwellings (A B C & D)
G) Loans On Manufactured Home Dwelling (A B C & D)
Number
Average Value
Number
Average Value
Number
Average Value
Number
Average Value
Number
Average Value
Number
Average Value
LOANS ORIGINATED
8
$89,631
38
$71,576
79
$92,753
35
$16,603
16
$59,349
25
$45,530
APPLICATIONS APPROVED, NOT ACCEPTED
6
$61,205
20
$76,409
15
$102,028
3
$44,310
0
$0
19
$59,907
APPLICATIONS DENIED
4
$56,972
41
$66,659
86
$83,511
25
$12,102
10
$59,898
39
$46,251
APPLICATIONS WITHDRAWN
0
$0
15
$107,319
34
$111,331
10
$63,996
0
$0
7
$74,260
FILES CLOSED FOR INCOMPLETENESS
0
$0
3
$91,467
8
$119,786
0
$0
0
$0
0
$0
Aggregated Statistics For Year 2004 (Based on 4 partial tracts)
A) FHA, FSA/RHS & VA Home Purchase Loans
B) Conventional Home Purchase Loans
C) Refinancings
D) Home Improvement Loans
E) Loans on Dwellings For 5+ Families
F) Non-occupant Loans on < 5 Family Dwellings (A B C & D)
G) Loans On Manufactured Home Dwelling (A B C & D)
Number
Average Value
Number
Average Value
Number
Average Value
Number
Average Value
Number
Average Value
Number
Average Value
Number
Average Value
LOANS ORIGINATED
4
$93,472
49
$80,502
110
$92,956
28
$21,383
0
$0
13
$46,319
36
$36,994
APPLICATIONS APPROVED, NOT ACCEPTED
2
$54,430
23
$52,993
46
$74,287
1
$72,280
0
$0
4
$65,397
20
$32,310
APPLICATIONS DENIED
2
$44,715
51
$49,191
78
$84,592
34
$32,745
1
$62,410
3
$22,767
48
$44,561
APPLICATIONS WITHDRAWN
4
$88,030
5
$144,296
30
$86,826
3
$43,953
0
$0
1
$70,440
2
$85,415
FILES CLOSED FOR INCOMPLETENESS
2
$114,620
4
$117,320
22
$115,927
0
$0
0
$0
0
$0
0
$0
Aggregated Statistics For Year 2003 (Based on 4 partial tracts)
A) FHA, FSA/RHS & VA Home Purchase Loans
B) Conventional Home Purchase Loans
C) Refinancings
D) Home Improvement Loans
F) Non-occupant Loans on < 5 Family Dwellings (A B C & D)
Number
Average Value
Number
Average Value
Number
Average Value
Number
Average Value
Number
Average Value
LOANS ORIGINATED
6
$125,068
47
$105,339
112
$91,008
22
$25,411
14
$70,278
APPLICATIONS APPROVED, NOT ACCEPTED
0
$0
15
$73,953
27
$73,040
1
$12,000
1
$151,230
APPLICATIONS DENIED
0
$0
69
$45,987
88
$75,753
20
$14,816
5
$67,998
APPLICATIONS WITHDRAWN
2
$61,930
5
$88,714
33
$87,685
1
$54,010
1
$71,820
FILES CLOSED FOR INCOMPLETENESS
1
$88,810
1
$57,090
3
$64,067
2
$18,210
0
$0
Aggregated Statistics For Year 2002 (Based on 4 partial tracts)
A) FHA, FSA/RHS & VA Home Purchase Loans
B) Conventional Home Purchase Loans
C) Refinancings
D) Home Improvement Loans
F) Non-occupant Loans on < 5 Family Dwellings (A B C & D)
Number
Average Value
Number
Average Value
Number
Average Value
Number
Average Value
Number
Average Value
LOANS ORIGINATED
5
$73,522
36
$72,295
91
$87,202
29
$23,096
11
$77,927
APPLICATIONS APPROVED, NOT ACCEPTED
3
$65,560
13
$47,041
26
$62,728
6
$27,123
2
$57,875
APPLICATIONS DENIED
2
$98,935
44
$46,729
63
$64,346
29
$13,227
8
$22,070
APPLICATIONS WITHDRAWN
1
$94,820
5
$45,798
30
$69,691
0
$0
0
$0
FILES CLOSED FOR INCOMPLETENESS
0
$0
5
$63,370
5
$100,714
0
$0
0
$0
Aggregated Statistics For Year 2001 (Based on 4 partial tracts)
A) FHA, FSA/RHS & VA Home Purchase Loans
B) Conventional Home Purchase Loans
C) Refinancings
D) Home Improvement Loans
F) Non-occupant Loans on < 5 Family Dwellings (A B C & D)
Number
Average Value
Number
Average Value
Number
Average Value
Number
Average Value
Number
Average Value
LOANS ORIGINATED
8
$65,501
53
$48,040
79
$76,450
42
$17,916
9
$47,467
APPLICATIONS APPROVED, NOT ACCEPTED
0
$0
23
$34,917
11
$50,466
3
$15,570
1
$32,410
APPLICATIONS DENIED
0
$0
84
$37,351
96
$56,047
34
$13,465
5
$42,008
APPLICATIONS WITHDRAWN
0
$0
3
$50,767
43
$85,239
6
$14,697
0
$0
FILES CLOSED FOR INCOMPLETENESS
0
$0
2
$156,630
11
$55,593
0
$0
0
$0
Aggregated Statistics For Year 2000 (Based on 4 partial tracts)
A) FHA, FSA/RHS & VA Home Purchase Loans
B) Conventional Home Purchase Loans
C) Refinancings
D) Home Improvement Loans
F) Non-occupant Loans on < 5 Family Dwellings (A B C & D)
Number
Average Value
Number
Average Value
Number
Average Value
Number
Average Value
Number
Average Value
LOANS ORIGINATED
8
$59,715
101
$46,015
53
$75,233
51
$15,750
14
$43,946
APPLICATIONS APPROVED, NOT ACCEPTED
1
$43,740
33
$46,017
27
$51,991
12
$20,777
1
$37,750
APPLICATIONS DENIED
5
$51,578
162
$38,925
94
$43,654
46
$11,271
10
$30,634
APPLICATIONS WITHDRAWN
1
$56,630
11
$34,831
37
$58,869
4
$14,678
2
$41,185
FILES CLOSED FOR INCOMPLETENESS
0
$0
3
$63,283
9
$37,328
0
$0
0
$0
Aggregated Statistics For Year 1999 (Based on 2 partial tracts)
A) FHA, FSA/RHS & VA Home Purchase Loans
B) Conventional Home Purchase Loans
C) Refinancings
D) Home Improvement Loans
F) Non-occupant Loans on < 5 Family Dwellings (A B C & D)
Detailed PMIC statistics for the following Tracts:0106.00
, 0113.00
2002 - 2018 National Fire Incident Reporting System (NFIRS) incidents
Based on the data from the years 2002 - 2018 the average number of fire incidents per year is 26. The highest number of reported fire incidents - 62 took place in 2006, and the least - 4 in 2002. The data has a growing trend.
When looking into fire subcategories, the most incidents belonged to: Outside Fires (52.4%), and Structure Fires (34.8%).
Fire incident types reported to NFIRS in Zip Code 39066

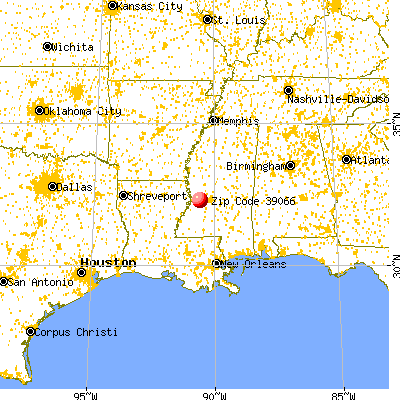


 Nearest zip codes: 39041, 39154, 39175, 39183, 39180, 39056.


 Based on the data from the years 2002 - 2018 the average number of fire incidents per year is 26. The highest number of reported fire incidents - 62 took place in 2006, and the least - 4 in 2002. The data has a growing trend.
 When looking into fire subcategories, the most incidents belonged to: Outside Fires (52.4%), and Structure Fires (34.8%).