Estimated zip code population in 2022: 3,753 Zip code population in 2010: 4,843 Zip code population in 2000: 4,820
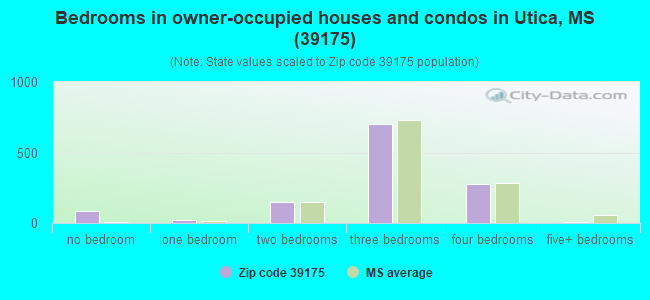
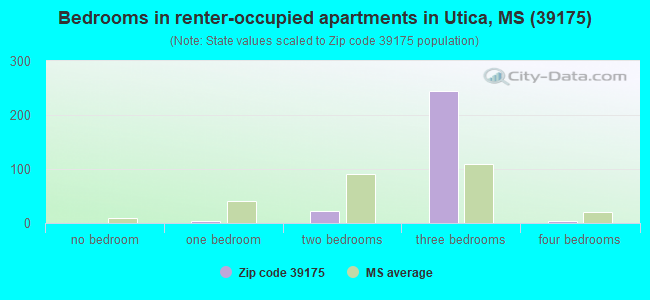
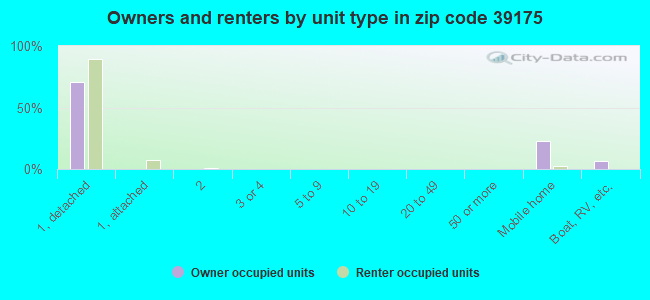
Houses and condos: 2,064 Renter-occupied apartments: 265
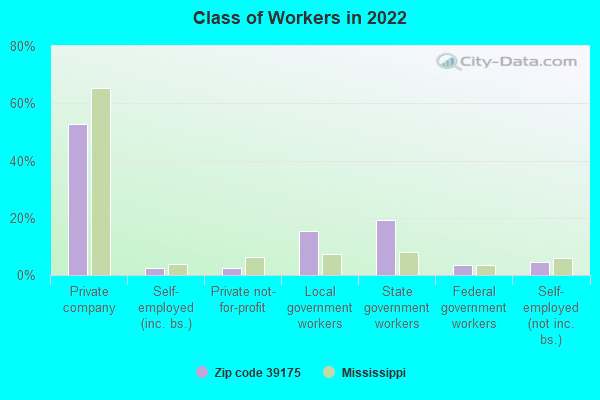
% of renters here:
18%
State:
30%
March 2022 cost of living index in zip code 39175: 78.7 (low, U.S. average is 100)
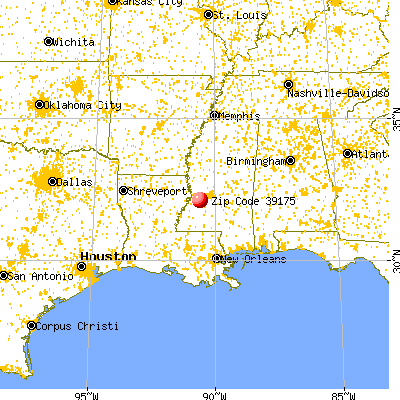
Land area: 242.9 sq. mi. Water area: 1.1 sq. mi.
Population density: 15 people per square mile
(very low).
OSM Map
General Map
Google Map
MSN Map
OSM Map
General Map
Google Map
MSN Map
OSM Map
General Map
Google Map
MSN Map
OSM Map
General Map
Google Map
MSN Map
Please wait while loading the map...
Real estate property taxes paid for housing units in 2022:
This zip code:
0.7% ($753)
Mississippi:
0.7% ($1,161)
Median real estate property taxes paid for housing units with mortgages in 2022: $957 (0.7%) Median real estate property taxes paid for housing units with no mortgage in 2022: $570 (0.6%)
Business Search- 14 Million verified businesses
Males: 1,788
(47.7%)
Females: 1,964
(52.3%)
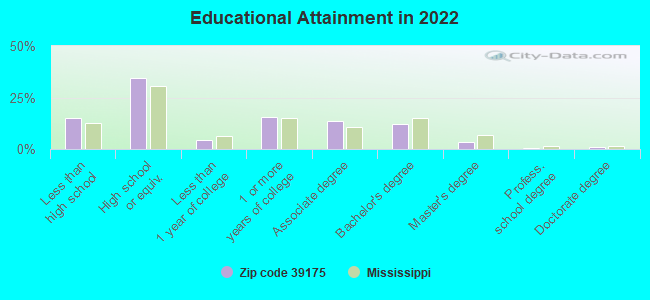
For population 25 years and over in 39175:
High school or higher: 84.1%
Bachelor's degree or higher: 17.3%
Graduate or professional degree: 5.1%
Unemployed: 6.9%
Mean travel time to work (commute): 33.1 minutes
For population 15 years and over in 39175:
Never married: 40.0%
Now married: 37.0%
Separated: 3.5%
Widowed: 9.5%
Divorced: 9.9%
Zip code 39175 compared to state average:
Median house value below state average.
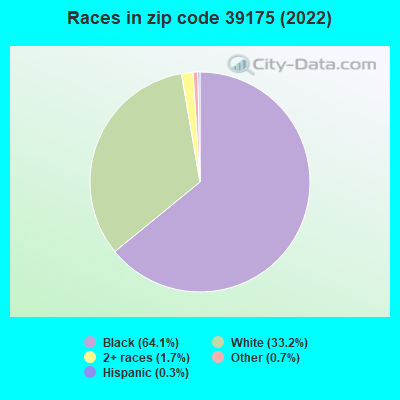
Black race population percentage above state average.
Hispanic race population percentage significantly below state average.
Median age significantly above state average.
Foreign-born population percentage significantly below state average.
Renting percentage below state average.
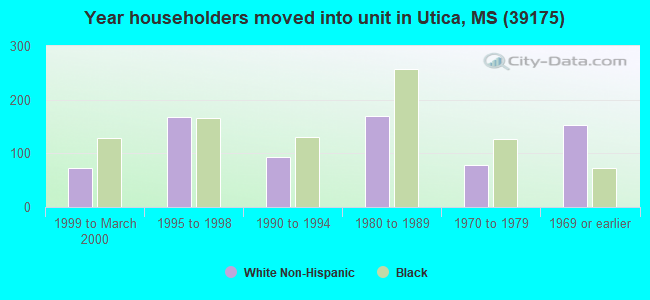
Length of stay since moving in significantly above state average.
Estimated median house/condo value in 2022: $103,634
39175:
$103,634
Mississippi:
$162,500
According to our research of Mississippi and other state lists, there were 11 registered sex offenders living in 39175 zip code as of May 28, 2024. The ratio of all residents to sex offenders in zip code 39175 is 389 to 1. The ratio of registered sex offenders to all residents in this zip code is near the state average.
Median resident age:
This zip code:
47.7 years
Mississippi median age:
38.9 years
Average household size:
This zip code:
2.3 people
Mississippi:
2.5 people
Averages for the 2020 tax year for zip code 39175, filed in 2021:
Average Adjusted Gross Income (AGI) in 2020: $40,178 (Individual Income Tax Returns)
Here:
$40,178
State:
$54,084
Salary/wage: $36,022 (reported on 81.8% of returns)
Here:
$36,022
State:
$45,187
(% of AGI for various income ranges: 1311.7% for AGIs below $25k, 3708.5% for AGIs $25k-50k, 7265.6% for AGIs $50k-75k, 11295.7% for AGIs $75k-100k, 21168.3% for AGIs $100k-200k)
Taxable interest for individuals: $671 (reported on 18.7% of returns)
This zip code:
$671
Mississippi:
$1,434
(% of AGI for various income ranges: 4.2% for AGIs below $25k, 5.2% for AGIs $25k-50k, 17.8% for AGIs $50k-75k, 55.7% for AGIs $75k-100k, 218.3% for AGIs $100k-200k)
Ordinary dividends: $3,292 (reported on 5.9% of returns)
Here:
$3,292
State:
$6,661
(% of AGI for various income ranges: 8.0% for AGIs below $25k, 17.2% for AGIs $50k-75k, 191.4% for AGIs $75k-100k, 291.7% for AGIs $100k-200k)
Net capital gain/loss in AGI: +$10,330 (reported on 4.9% of returns)
Here:
+$10,330
State:
+$16,833
(% of AGI for various income ranges: 14.1% for AGIs below $25k, 56.1% for AGIs $50k-75k, 1391.7% for AGIs $100k-200k)
Profit/loss from business: +$4,015 (reported on 16.7% of returns)
Here:
+$4,015
State:
+$7,724
(% of AGI for various income ranges: 64.2% for AGIs below $25k, 92.8% for AGIs $50k-75k, 361.4% for AGIs $75k-100k, 916.7% for AGIs $100k-200k)
Taxable individual retirement arrangement distribution: $14,346 (reported on 6.4% of returns)
39175:
$14,346
Mississippi:
$17,717
(% of AGI for various income ranges: 38.1% for AGIs below $25k, 66.3% for AGIs $25k-50k, 350.6% for AGIs $50k-75k, 1110.0% for AGIs $100k-200k)
Total itemized deductions: $26,209 (reported on 5.4% of returns)
Here:
$26,209
State:
$34,027
(% of AGI for various income ranges: 80.0% for AGIs below $25k, 785.6% for AGIs $50k-75k, 1528.3% for AGIs $100k-200k)
Charity contributions: $11,133 (reported on 4.4% of returns)
Here:
$11,133
State:
$14,997
(% of AGI for various income ranges: 21.2% for AGIs below $25k, 237.8% for AGIs $50k-75k, 713.3% for AGIs $100k-200k)
Taxes paid: $4,264 (reported on 5.4% of returns)
39175:
$4,264
State:
$6,353
(% of AGI for various income ranges: 13.8% for AGIs below $25k, 98.9% for AGIs $50k-75k, 326.7% for AGIs $100k-200k)
Earned income credit: $2,595 (reported on 30.5% of returns)
Here:
$2,595
State:
$2,689
(% of AGI for various income ranges: 164.6% for AGIs below $25k, 102.8% for AGIs $25k-50k)
Percentage of individuals using paid preparers for their 2020 taxes: 90.1%
Here:
90%
State:
94%
(% for various income ranges: 89.8% for AGIs below $25k, 90.0% for AGIs $25k-50k, 92.9% for AGIs $50k-75k, 92.3% for AGIs $75k-100k, 85.7% for AGIs $100k-200k)
Averages for the 2012 tax year for zip code 39175, filed in 2013:
Average Adjusted Gross Income (AGI) in 2012: $36,588 (Individual Income Tax Returns)
Here:
$36,588
State:
$46,197
Salary/wage: $32,505 (reported on 86.5% of returns)
Here:
$32,505
State:
$38,549
(% of AGI for various income ranges: 85.3% for AGIs below $25k, 84.7% for AGIs $25k-50k, 75.6% for AGIs $50k-75k, 73.1% for AGIs $75k-100k, 64.5% for AGIs $100k-200k)
Taxable interest for individuals: $1,050 (reported on 19.2% of returns)
This zip code:
$1,050
Mississippi:
$1,482
(% of AGI for various income ranges: 0.3% for AGIs below $25k, 0.3% for AGIs $25k-50k, 0.6% for AGIs $50k-75k, 0.6% for AGIs $75k-100k, 1.1% for AGIs $100k-200k)
Ordinary dividends: $2,367 (reported on 7.2% of returns)
Here:
$2,367
State:
$5,401
(% of AGI for various income ranges: 0.2% for AGIs below $25k, 0.3% for AGIs $25k-50k, 0.4% for AGIs $50k-75k, 1.1% for AGIs $100k-200k)
Net capital gain/loss in AGI: +$5,457 (reported on 6.7% of returns)
Here:
+$5,457
State:
+$12,121
(% of AGI for various income ranges: 0.1% for AGIs $25k-50k, 1.0% for AGIs $50k-75k, 3.3% for AGIs $100k-200k)
Profit/loss from business: +$3,080 (reported on 16.8% of returns)
Here:
+$3,080
State:
+$10,220
(% of AGI for various income ranges: 4.2% for AGIs below $25k, 0.8% for AGIs $25k-50k, 0.9% for AGIs $50k-75k, 1.0% for AGIs $100k-200k)
Taxable individual retirement arrangement distribution: $13,830 (reported on 4.8% of returns)
39175:
$13,830
Mississippi:
$13,665
(% of AGI for various income ranges: 1.4% for AGIs below $25k, 1.2% for AGIs $25k-50k, 2.0% for AGIs $50k-75k, 7.2% for AGIs $75k-100k)
Total itemized deductions: $19,870 (27% of AGI, reported on 19.2% of returns)
Here:
$19,870
State:
$22,078
Here:
27.0% of AGI
State:
21.8% of AGI
(% of AGI for various income ranges: 4.6% for AGIs below $25k, 9.8% for AGIs $25k-50k, 11.9% for AGIs $50k-75k, 10.6% for AGIs $75k-100k, 14.6% for AGIs $100k-200k)
Charity contributions: $5,646 (reported on 16.8% of returns)
Here:
$5,646
State:
$6,081
(% of AGI for various income ranges: 0.9% for AGIs below $25k, 2.4% for AGIs $25k-50k, 2.9% for AGIs $50k-75k, 2.4% for AGIs $75k-100k, 3.9% for AGIs $100k-200k)
Taxes paid: $3,795 (reported on 19.2% of returns)
39175:
$3,795
State:
$5,794
(% of AGI for various income ranges: 0.6% for AGIs below $25k, 1.4% for AGIs $25k-50k, 1.8% for AGIs $50k-75k, 2.6% for AGIs $75k-100k, 3.6% for AGIs $100k-200k)
Earned income credit: $2,824 (reported on 38.5% of returns)
Here:
$2,824
State:
$2,710
(% of AGI for various income ranges: 13.4% for AGIs below $25k, 1.5% for AGIs $25k-50k)
Percentage of individuals using paid preparers for their 2012 taxes: 54.8%
Here:
55%
State:
60%
(% for various income ranges: 50.0% for AGIs below $25k, 54.4% for AGIs $25k-50k, 65.2% for AGIs $50k-75k, 60.0% for AGIs $75k-100k, 75.0% for AGIs $100k-200k)
Averages for the 2004 tax year for zip code 39175, filed in 2005:
Average Adjusted Gross Income (AGI) in 2004: $30,196 (Individual Income Tax Returns)
Here:
$30,196
State:
$36,110
Salary/wage: $28,644 (reported on 88.9% of returns)
Here:
$28,644
State:
$31,757
(% of AGI for various income ranges: 116.4% for AGIs below $10k, 87.3% for AGIs $10k-25k, 86.7% for AGIs $25k-50k, 85.5% for AGIs $50k-75k, 73.6% for AGIs $75k-100k, 74.9% for AGIs over 100k)
Taxable interest for individuals: $1,528 (reported on 23.3% of returns)
This zip code:
$1,528
Mississippi:
$1,649
(% of AGI for various income ranges: 2.7% for AGIs below $10k, 1.0% for AGIs $10k-25k, 1.2% for AGIs $25k-50k, 0.8% for AGIs $50k-75k, 1.6% for AGIs $75k-100k, 1.3% for AGIs over 100k)
Taxable dividends: $1,488 (reported on 8.0% of returns)
Here:
$1,488
State:
$3,089
(% of AGI for various income ranges: 1.0% for AGIs below $10k, 0.2% for AGIs $10k-25k, 0.3% for AGIs $25k-50k, 0.1% for AGIs $50k-75k, 0.9% for AGIs $75k-100k, 0.7% for AGIs over 100k)
Net capital gain/loss: +$2,497 (reported on 7.4% of returns)
Here:
+$2,497
State:
+$8,427
(% of AGI for various income ranges: 0.8% for AGIs below $10k, -0.1% for AGIs $10k-25k, 0.6% for AGIs $25k-50k, 0.8% for AGIs $50k-75k, 0.6% for AGIs $75k-100k, 1.4% for AGIs over 100k)
Profit/loss from business: +$4,383 (reported on 12.2% of returns)
Here:
+$4,383
State:
+$8,818
(% of AGI for various income ranges: 3.6% for AGIs below $10k, 4.0% for AGIs $10k-25k, 1.9% for AGIs $25k-50k, 0.6% for AGIs $50k-75k, 1.2% for AGIs $75k-100k)
IRA payment deduction: $2,348 (reported on 1.1% of returns)
39175:
$2,348
Mississippi:
$3,024
Total itemized deductions: $17,375 (28% of AGI, reported on 18.2% of returns)
Here:
$17,375
State:
$17,896
Here:
28.2% of AGI
State:
22.5% of AGI
(% of AGI for various income ranges: 4.6% for AGIs $10k-25k, 10.4% for AGIs $25k-50k, 12.2% for AGIs $50k-75k, 12.4% for AGIs $75k-100k, 17.3% for AGIs over 100k)
Charity contributions deductions: $5,156 (8% of AGI, reported on 16.3% of returns)
Here:
$5,156
State:
$4,735
Here:
8.3% of AGI
State:
5.7% of AGI
(% of AGI for various income ranges: 0.8% for AGIs $10k-25k, 2.2% for AGIs $25k-50k, 3.2% for AGIs $50k-75k, 2.8% for AGIs $75k-100k, 6.8% for AGIs over 100k)
Total tax: $3,829 (reported on 59.6% of returns)
39175:
$3,829
State:
$5,562
(% of AGI for various income ranges: 2.4% for AGIs below $10k, 2.8% for AGIs $10k-25k, 5.5% for AGIs $25k-50k, 8.7% for AGIs $50k-75k, 11.0% for AGIs $75k-100k, 15.8% for AGIs over 100k)
Earned income credit: $2,122 (reported on 39.9% of returns)
Here:
$2,122
State:
$2,107
Percentage of individuals using paid preparers for their 2004 taxes: 57.1%
Here:
57%
State:
65%
(% for various income ranges: 51.1% for AGIs below $10k, 58.0% for AGIs $10k-25k, 56.5% for AGIs $25k-50k, 64.2% for AGIs $50k-75k, 61.4% for AGIs $75k-100k, 61.9% for AGIs over 100k)
Likely homosexual households (counted as self-reported same-sex unmarried-partner households)
Lesbian couples: 0.0% of all households
Gay men: 0.1% of all households
Household received Food Stamps/SNAP in the past 12 months: 233 Household did not receive Food Stamps/SNAP in the past 12 months: 1,261
Women who had a birth in the past 12 months: 21 (18 now married, 4 unmarried) Women who did not have a birth in the past 12 months: 923 (164 now married, 761 unmarried)
Housing units in zip code 39175 with a mortgage: 487 (7 second mortgage, 3 home equity loan, 2 both second mortgage and home equity loan) Houses without a mortgage: 19
Median monthly owner costs for units with a mortgage: $1,110 Median monthly owner costs for units without a mortgage: $369
Residents with income below the poverty level in 2022:
This zip code:
17.5%
Whole state:
19.1%
Residents with income below 50% of the poverty level in 2022:
This zip code:
11.7%
Whole state:
10.3%
Median number of rooms in houses and condos:
Here:
5.7
State:
6.3
Median number of rooms in apartments:
Here:
5.7
State:
4.8
Notable locations in this zip code not listed on our city pages
Churches in zip code 39175 include: New Salem Church (A), Rohelia Church (B), Paige Grove Church (C), Bear Creek Church (D), Saint John Church (E), Saint Paul Baptist Church (F), Second Union Church (G), Seven Star Church (H), Antioch Church (I). Display/hide their locations on the map
Cemeteries: Carpenter Cemetery (1), Chatham Cemetery (2), Hutchins Cemetery (3), McClellan Cemetery (4), McElwee Cemetery (5), Fatherree Cemetery (6), Flower Hill Cemetery (7). Display/hide their locations on the map
Streams, rivers, and creeks: Anderson Creek (A), Alford Branch (B), Tallahalla Creek (C), Scutchalo Creek (D), Saddlers Creek (E), Browning Branch (F), Potter Creek (G), Payton Branch (H), Owens Creek (I). Display/hide their locations on the map
In group quarters: 324 (-1 institutionalized population)
Size of family households: 434 2-persons, 206 3-persons, 164 4-persons, 60 5-persons, 3 6-persons, 22 7-or-more-persons
Size of nonfamily households: 565 1-person, 41 2-persons
160 married couples with children.
41 single-parent households (27 men, 14 women).
98.8% of residents of 39175 zip code speak English at home.
0.7% of residents speak Spanish at home (12% very well, 85% well, 4% not well).
0.5% of residents speak other language at home (100% very well).
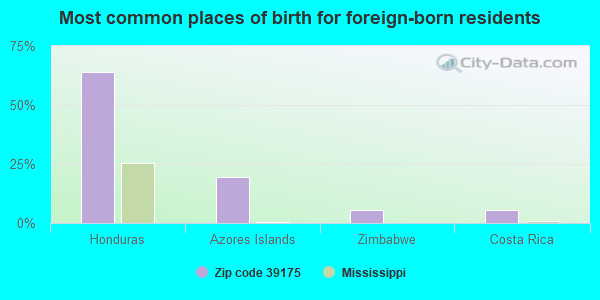
Foreign born population: 34 (0.9%) (44.5% of them are naturalized citizens)
This zip code:
0.9%
Whole state:
2.2%
64%Honduras
19%Azores Islands
6%Zimbabwe
6%Costa Rica
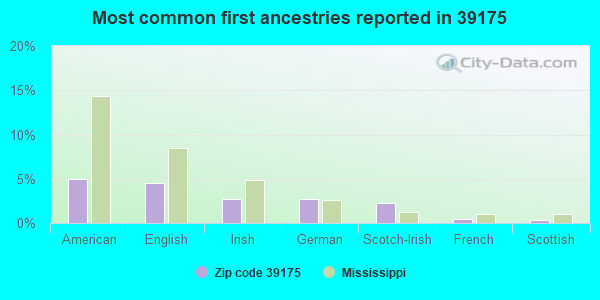
5%American
4%English
3%Irish
3%German
2%Scotch-Irish
1%French
0%Scottish
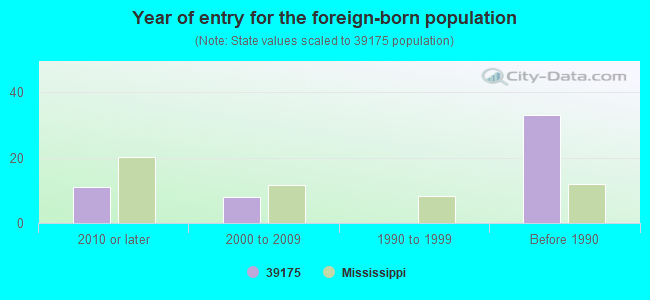
Year of entry for the foreign-born population
112010 or later
82000 to 2009
01990 to 1999
33Before 1990
Facilities with environmental interests located in this zip code:
HINDS COUNTY AGRICULTURAL HIGH SCH (HIGHWAY 18,HINDS AHS in UTICA, MS)
(Geographic Names Information System) COMPLIANCE ACTIVITY (Tracking inspections of insecticide, fungicide, and rodenticide, and toxic substances) (National Center for Education Statistics) - STATE ID-2502004 Organizations: HINDS CO AHS (SCHOOL DISTRICT)
HINDS COUNTY HUMAN RESOURCE AGENCY, WELCOME HEAD START CENTER (2873 OLD ADAMS STATION ROAD in UTICA, MS)
STATE MASTER (Mississippi compliance, permits, activity tracking ) - ENSITE-MS0046051, National Pollutant Discharge Elimination System Permit National Pollutant Discharge Elimination System NON-MAJOR (Tracking pollutant discharge elimination systems) - permit Business SIC classification: CHILD DAY CARE SERVICES Alternative names: WELCOME HEADSTART CENTER
HINDS COUNTY (34175 HWY 18 W in UTICA, MS)
National Pollutant Discharge Elimination System NON-MAJOR (Tracking pollutant discharge elimination systems) - permit Business SIC classification: SEWERAGE SYSTEMS Alternative names: HINDS COMMUNITY COLLEGE
Housing units lacking complete plumbing facilities: 11.1% Housing units lacking complete kitchen facilities: 4.1%
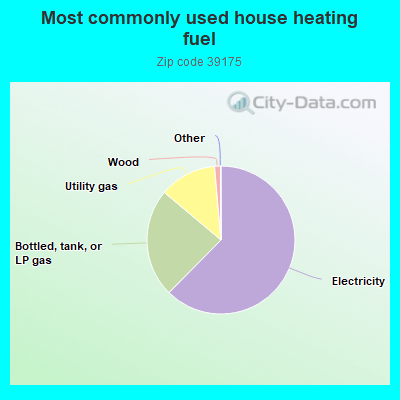
62.5%Electricity
23.7%Bottled, tank, or LP gas
12.5%Utility gas
1.3%Wood
Population in 1990: 4,630. Population change in the 1990s: +190 (+4.1%).
Place of birth for U.S.-born residents:
This state: 3,251
Northeast: 28
Midwest: 66
South: 292
West: 31
62% of the 39175 zip code residents lived in the same house 5 years ago. Out of people who lived in different houses, 50% lived in this county. Out of people who lived in different counties, 50% lived in Mississippi.
97% of the 39175 zip code residents lived in the same house 1 year ago. Out of people who lived in different houses, 87% moved from this county. Out of people who lived in different houses, 1% moved from different county within same state. Out of people who lived in different houses, 5% moved from different state. Out of people who lived in different houses, 4% moved from abroad.
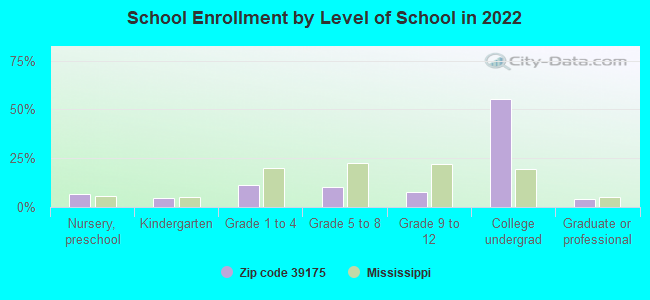
Private vs. public school enrollment:
Students in private schools in grades 1 to 8 (elementary and middle school): 90
Here:
46.7%
Mississippi:
16.1%
Students in private schools in grades 9 to 12 (high school): 24
Here:
37.5%
Mississippi:
14.6%
Students in private undergraduate colleges: 49
Here:
10.5%
Mississippi:
12.8%
Occupation by median earnings in the past 12 months ($)
148,252Health diagnosing and treating practitioners and other technical occupations
92,124Sales and related occupations
83,973Management occupations
70,945Architecture and engineering occupations
60,913Installation, maintenance, and repair occupations
58,198Transportation occupations
Companies with federal contracts located in this zip code:
B&R CHARTERING SERVICE (1349 GONIA RD in UTICA, MS)
$6,000 with Army for Lease or Rental of Equipment -- Ground Effect Vehicles, Motor Vehicles, Trailers, and Cycles. Signed on 2005-03-31. Completion date: 2005-04-03.
Top industries in this zip code by the number of employees in 2005:
Other Services (except Public Administration): Religious Organizations (10-19 employees: 1 establishment)
Health Care and Social Assistance: Child Day Care Services (10-19: 1)
Accommodation and Food Services: Full-Service Restaurants (10-19: 1)
Construction: Painting and Wall Covering Contractors (5-9: 2)
Construction: Poured Concrete Foundation and Structure Contractors (5-9: 1, 1-4: 1)
People in group quarters in 2010:
87 people in college/university student housing
People in group quarters in 2000:
270 people in college dormitories (includes college quarters off campus)
Fatal accident statistics in 2013:
Fatal accident count: 1
Vehicles involved in fatal accidents: 1
Fatal accidents caused by drunken drivers: 0
Fatalities: 1
Persons involved in fatal accidents: 3
Pedestrians involved in fatal accidents: 0
Fatal accident statistics in 2011:
Fatal accident count: 2
Vehicles involved in fatal accidents: 2
Fatal accidents caused by drunken drivers: 1
Fatalities: 2
Persons involved in fatal accidents: 7
Pedestrians involved in fatal accidents: 1
Home Mortgage Disclosure Act Aggregated Statistics For Year 2009 (Based on 4 partial tracts)
A) FHA, FSA/RHS & VA Home Purchase Loans
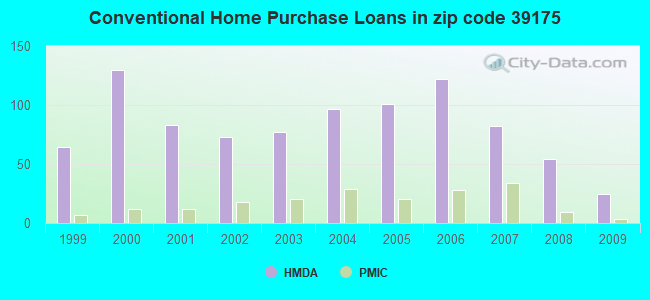
B) Conventional Home Purchase Loans
C) Refinancings
D) Home Improvement Loans
F) Non-occupant Loans on < 5 Family Dwellings (A B C & D)
G) Loans On Manufactured Home Dwelling (A B C & D)
Number
Average Value
Number
Average Value
Number
Average Value
Number
Average Value
Number
Average Value
Number
Average Value
LOANS ORIGINATED
31
$142,455
25
$134,938
118
$150,748
26
$24,010
13
$61,566
16
$36,678
APPLICATIONS APPROVED, NOT ACCEPTED
2
$167,975
6
$106,958
11
$156,955
1
$7,270
1
$101,750
5
$83,324
APPLICATIONS DENIED
7
$114,974
22
$66,527
56
$143,384
13
$13,429
2
$118,915
20
$39,564
APPLICATIONS WITHDRAWN
3
$140,890
4
$77,522
35
$166,641
1
$21,900
0
$0
1
$99,860
FILES CLOSED FOR INCOMPLETENESS
0
$0
2
$132,255
13
$149,662
1
$137,970
0
$0
3
$112,397
Aggregated Statistics For Year 2008 (Based on 4 partial tracts)
A) FHA, FSA/RHS & VA Home Purchase Loans
B) Conventional Home Purchase Loans
C) Refinancings
D) Home Improvement Loans
F) Non-occupant Loans on < 5 Family Dwellings (A B C & D)
G) Loans On Manufactured Home Dwelling (A B C & D)
Number
Average Value
Number
Average Value
Number
Average Value
Number
Average Value
Number
Average Value
Number
Average Value
LOANS ORIGINATED
22
$150,472
54
$130,106
92
$150,977
27
$23,881
13
$104,747
25
$45,230
APPLICATIONS APPROVED, NOT ACCEPTED
3
$179,580
20
$98,850
14
$157,342
3
$33,157
3
$34,183
17
$55,595
APPLICATIONS DENIED
5
$150,616
25
$85,092
53
$159,816
35
$32,672
3
$69,897
23
$35,228
APPLICATIONS WITHDRAWN
3
$133,153
7
$171,827
22
$176,158
2
$15,110
2
$49,140
2
$53,000
FILES CLOSED FOR INCOMPLETENESS
1
$119,570
2
$139,395
7
$204,200
0
$0
0
$0
0
$0
Aggregated Statistics For Year 2007 (Based on 4 partial tracts)
A) FHA, FSA/RHS & VA Home Purchase Loans
B) Conventional Home Purchase Loans
C) Refinancings
D) Home Improvement Loans
F) Non-occupant Loans on < 5 Family Dwellings (A B C & D)
G) Loans On Manufactured Home Dwelling (A B C & D)
Number
Average Value
Number
Average Value
Number
Average Value
Number
Average Value
Number
Average Value
Number
Average Value
LOANS ORIGINATED
19
$106,516
82
$137,790
109
$132,651
46
$21,275
12
$71,843
38
$35,371
APPLICATIONS APPROVED, NOT ACCEPTED
2
$81,125
31
$93,180
20
$172,585
4
$46,545
3
$91,297
20
$51,266
APPLICATIONS DENIED
1
$70,520
59
$86,306
67
$159,772
19
$27,082
9
$27,569
47
$46,915
APPLICATIONS WITHDRAWN
2
$146,950
10
$114,241
24
$180,292
6
$19,555
3
$37,310
6
$17,368
FILES CLOSED FOR INCOMPLETENESS
0
$0
5
$161,028
19
$170,335
0
$0
1
$207,860
0
$0
Aggregated Statistics For Year 2006 (Based on 4 partial tracts)
A) FHA, FSA/RHS & VA Home Purchase Loans
B) Conventional Home Purchase Loans
C) Refinancings
D) Home Improvement Loans
F) Non-occupant Loans on < 5 Family Dwellings (A B C & D)
G) Loans On Manufactured Home Dwelling (A B C & D)
Number
Average Value
Number
Average Value
Number
Average Value
Number
Average Value
Number
Average Value
Number
Average Value
LOANS ORIGINATED
19
$125,260
122
$129,870
119
$137,347
49
$34,084
21
$98,760
43
$36,571
APPLICATIONS APPROVED, NOT ACCEPTED
0
$0
23
$103,647
15
$178,827
3
$21,840
2
$192,280
9
$38,987
APPLICATIONS DENIED
6
$66,392
76
$89,372
82
$108,490
27
$34,625
5
$74,206
52
$43,866
APPLICATIONS WITHDRAWN
2
$117,285
22
$97,934
28
$134,873
4
$118,280
4
$155,032
4
$42,380
FILES CLOSED FOR INCOMPLETENESS
0
$0
6
$136,028
20
$155,314
0
$0
0
$0
1
$52,330
Aggregated Statistics For Year 2005 (Based on 4 partial tracts)
A) FHA, FSA/RHS & VA Home Purchase Loans
B) Conventional Home Purchase Loans
C) Refinancings
D) Home Improvement Loans
F) Non-occupant Loans on < 5 Family Dwellings (A B C & D)
G) Loans On Manufactured Home Dwelling (A B C & D)
Number
Average Value
Number
Average Value
Number
Average Value
Number
Average Value
Number
Average Value
Number
Average Value
LOANS ORIGINATED
21
$122,441
101
$121,934
128
$124,903
39
$23,342
17
$92,959
36
$47,032
APPLICATIONS APPROVED, NOT ACCEPTED
2
$24,590
37
$100,182
32
$128,823
4
$65,785
1
$100,300
21
$46,062
APPLICATIONS DENIED
8
$73,582
90
$91,524
119
$94,335
39
$18,560
7
$56,783
63
$42,611
APPLICATIONS WITHDRAWN
4
$79,320
41
$116,080
52
$126,933
11
$73,472
3
$84,590
10
$66,558
FILES CLOSED FOR INCOMPLETENESS
0
$0
11
$104,680
21
$160,662
2
$247,160
1
$472,420
1
$104,660
Aggregated Statistics For Year 2004 (Based on 4 partial tracts)
A) FHA, FSA/RHS & VA Home Purchase Loans
B) Conventional Home Purchase Loans
C) Refinancings
D) Home Improvement Loans
F) Non-occupant Loans on < 5 Family Dwellings (A B C & D)
G) Loans On Manufactured Home Dwelling (A B C & D)
Number
Average Value
Number
Average Value
Number
Average Value
Number
Average Value
Number
Average Value
Number
Average Value
LOANS ORIGINATED
13
$141,262
97
$104,763
160
$100,646
32
$17,757
14
$53,495
43
$38,430
APPLICATIONS APPROVED, NOT ACCEPTED
2
$56,360
45
$65,726
60
$89,016
4
$63,625
5
$85,004
34
$37,484
APPLICATIONS DENIED
4
$64,037
68
$59,349
100
$91,236
36
$15,858
5
$32,652
66
$55,119
APPLICATIONS WITHDRAWN
1
$107,570
14
$109,875
56
$106,631
7
$38,321
4
$82,318
5
$55,202
FILES CLOSED FOR INCOMPLETENESS
0
$0
1
$258,420
25
$136,003
2
$163,595
0
$0
0
$0
Aggregated Statistics For Year 2003 (Based on 4 partial tracts)
A) FHA, FSA/RHS & VA Home Purchase Loans
B) Conventional Home Purchase Loans
C) Refinancings
D) Home Improvement Loans
F) Non-occupant Loans on < 5 Family Dwellings (A B C & D)
Number
Average Value
Number
Average Value
Number
Average Value
Number
Average Value
Number
Average Value
LOANS ORIGINATED
12
$97,222
77
$102,668
259
$108,045
32
$31,202
21
$61,661
APPLICATIONS APPROVED, NOT ACCEPTED
0
$0
28
$68,939
41
$83,352
3
$28,177
0
$0
APPLICATIONS DENIED
4
$57,078
90
$52,961
126
$91,032
20
$18,142
5
$75,376
APPLICATIONS WITHDRAWN
3
$121,480
14
$99,820
50
$106,743
1
$197,100
3
$85,223
FILES CLOSED FOR INCOMPLETENESS
0
$0
3
$71,177
7
$102,827
3
$22,300
0
$0
Aggregated Statistics For Year 2002 (Based on 4 partial tracts)
A) FHA, FSA/RHS & VA Home Purchase Loans
B) Conventional Home Purchase Loans
C) Refinancings
D) Home Improvement Loans
F) Non-occupant Loans on < 5 Family Dwellings (A B C & D)
Number
Average Value
Number
Average Value
Number
Average Value
Number
Average Value
Number
Average Value
LOANS ORIGINATED
9
$104,113
73
$79,190
166
$99,536
29
$27,919
12
$45,193
APPLICATIONS APPROVED, NOT ACCEPTED
5
$67,338
20
$53,998
26
$78,085
3
$19,997
1
$138,090
APPLICATIONS DENIED
4
$71,880
99
$49,065
91
$83,269
23
$26,904
11
$42,698
APPLICATIONS WITHDRAWN
2
$116,070
7
$73,560
32
$92,580
1
$7,010
2
$32,565
FILES CLOSED FOR INCOMPLETENESS
0
$0
1
$294,340
7
$164,691
0
$0
0
$0
Aggregated Statistics For Year 2001 (Based on 4 partial tracts)
A) FHA, FSA/RHS & VA Home Purchase Loans
B) Conventional Home Purchase Loans
C) Refinancings
D) Home Improvement Loans
F) Non-occupant Loans on < 5 Family Dwellings (A B C & D)
Number
Average Value
Number
Average Value
Number
Average Value
Number
Average Value
Number
Average Value
LOANS ORIGINATED
17
$98,120
83
$73,856
143
$92,633
43
$16,627
13
$42,402
APPLICATIONS APPROVED, NOT ACCEPTED
0
$0
36
$43,895
27
$69,909
3
$28,557
1
$24,970
APPLICATIONS DENIED
1
$109,940
92
$44,085
138
$66,622
51
$12,402
4
$44,458
APPLICATIONS WITHDRAWN
1
$97,390
7
$63,036
43
$66,516
13
$14,791
0
$0
FILES CLOSED FOR INCOMPLETENESS
0
$0
4
$57,955
13
$76,392
0
$0
0
$0
Aggregated Statistics For Year 2000 (Based on 4 partial tracts)
A) FHA, FSA/RHS & VA Home Purchase Loans
B) Conventional Home Purchase Loans
C) Refinancings
D) Home Improvement Loans
F) Non-occupant Loans on < 5 Family Dwellings (A B C & D)
Number
Average Value
Number
Average Value
Number
Average Value
Number
Average Value
Number
Average Value
LOANS ORIGINATED
21
$85,749
130
$60,741
67
$82,731
55
$22,507
13
$40,346
APPLICATIONS APPROVED, NOT ACCEPTED
5
$56,438
47
$46,653
22
$73,956
13
$21,945
3
$44,113
APPLICATIONS DENIED
7
$54,481
171
$45,378
126
$56,617
36
$11,644
9
$29,243
APPLICATIONS WITHDRAWN
3
$59,597
14
$67,869
53
$44,752
2
$31,885
1
$85,760
FILES CLOSED FOR INCOMPLETENESS
0
$0
2
$103,135
7
$64,199
0
$0
0
$0
Aggregated Statistics For Year 1999 (Based on 2 partial tracts)
A) FHA, FSA/RHS & VA Home Purchase Loans
B) Conventional Home Purchase Loans
C) Refinancings
D) Home Improvement Loans
F) Non-occupant Loans on < 5 Family Dwellings (A B C & D)
Detailed PMIC statistics for the following Tracts:0112.00
, 0113.00
2002 - 2018 National Fire Incident Reporting System (NFIRS) incidents
Based on the data from the years 2002 - 2018 the average number of fires per year is 56. The highest number of fire incidents - 92 took place in 2011, and the least - 27 in 2014. The data has a dropping trend.
When looking into fire subcategories, the most reports belonged to: Outside Fires (51.9%), and Structure Fires (29.4%).
Fire incident types reported to NFIRS in Zip Code 39175


 Nearest zip codes: 39086, 39066, 39154, 39180, 39083, 39059.


 Based on the data from the years 2002 - 2018 the average number of fires per year is 56. The highest number of fire incidents - 92 took place in 2011, and the least - 27 in 2014. The data has a dropping trend.
 When looking into fire subcategories, the most reports belonged to: Outside Fires (51.9%), and Structure Fires (29.4%).