Estimated zip code population in 2022: 7,856 Zip code population in 2010: 7,705 Zip code population in 2000: 4,445
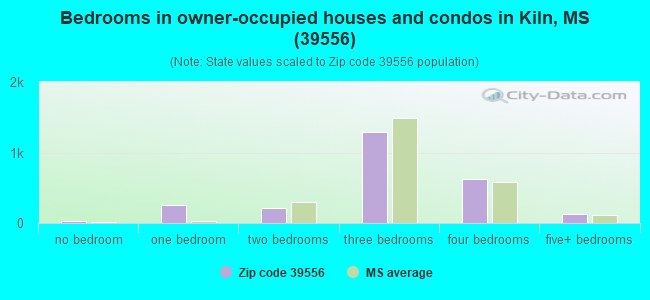
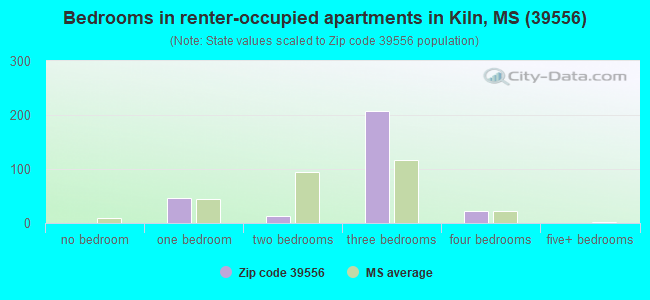
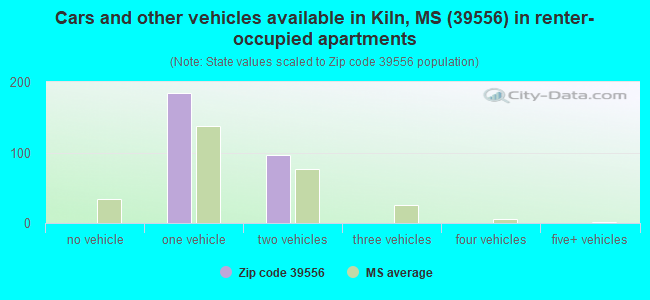
Houses and condos: 3,424 Renter-occupied apartments: 280
% of renters here:
10%
State:
30%
March 2022 cost of living index in zip code 39556: 79.3 (low, U.S. average is 100)
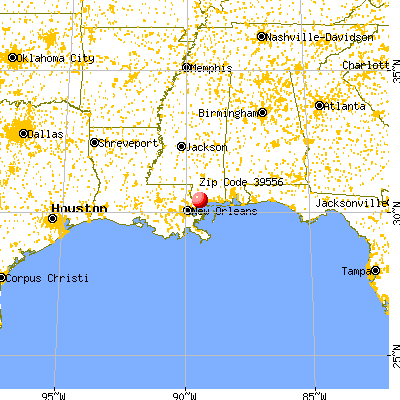
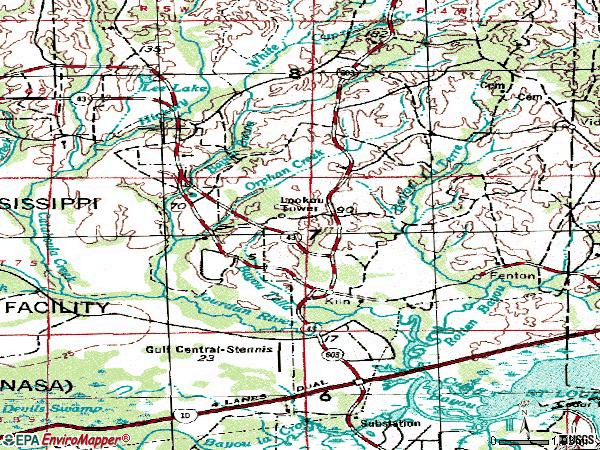
Land area: 105.2 sq. mi. Water area: 1.4 sq. mi.
Population density: 75 people per square mile
(very low).
OSM Map
General Map
Google Map
MSN Map
OSM Map
General Map
Google Map
MSN Map
OSM Map
General Map
Google Map
MSN Map
OSM Map
General Map
Google Map
MSN Map
Please wait while loading the map...
Real estate property taxes paid for housing units in 2022:
This zip code:
0.9% ($1,329)
Mississippi:
0.7% ($1,161)
Median real estate property taxes paid for housing units with mortgages in 2022: $1,381 (0.8%) Median real estate property taxes paid for housing units with no mortgage in 2022: $1,248 (0.9%)
Business Search- 14 Million verified businesses
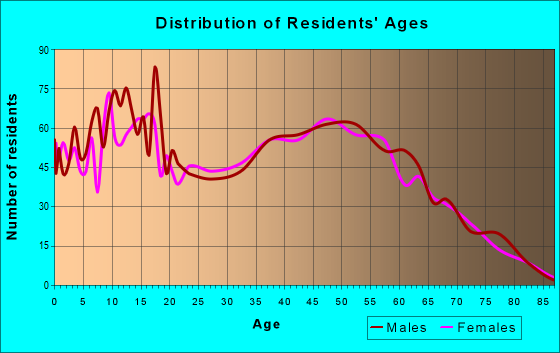
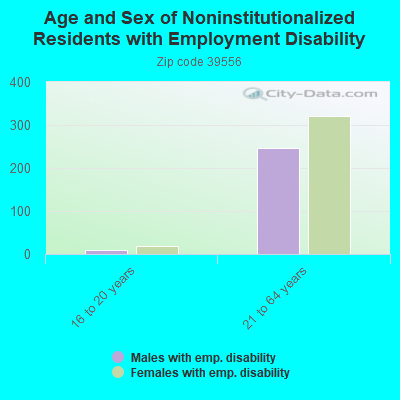
Males: 3,681
(46.9%)
Females: 4,175
(53.1%)
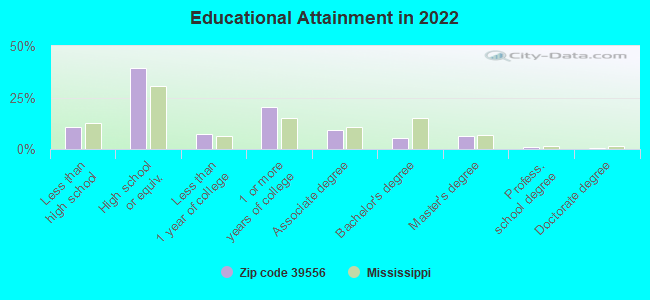
For population 25 years and over in 39556:
High school or higher: 89.0%
Bachelor's degree or higher: 13.2%
Graduate or professional degree: 7.7%
Unemployed: 3.1%
Mean travel time to work (commute): 37.2 minutes
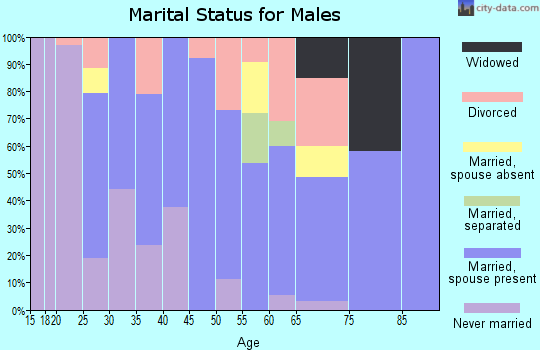
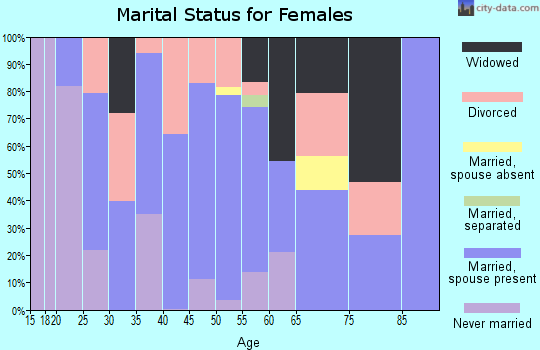
For population 15 years and over in 39556:
Never married: 29.4%
Now married: 46.1%
Separated: 1.3%
Widowed: 9.6%
Divorced: 13.6%
Zip code 39556 compared to state average:
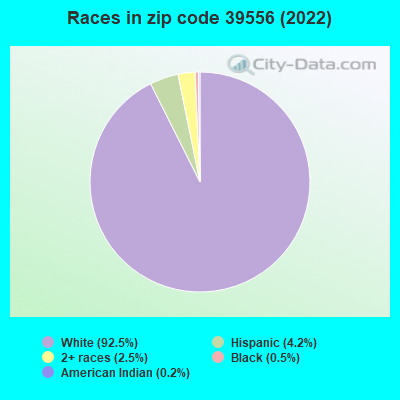
Black race population percentage significantly below state average.
Foreign-born population percentage significantly below state average.
Renting percentage significantly below state average.
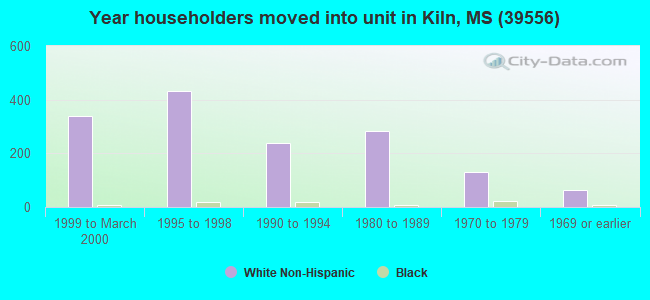
Length of stay since moving in significantly above state average.
House age below state average.
Percentage of population with a bachelor's degree or higher below state average.
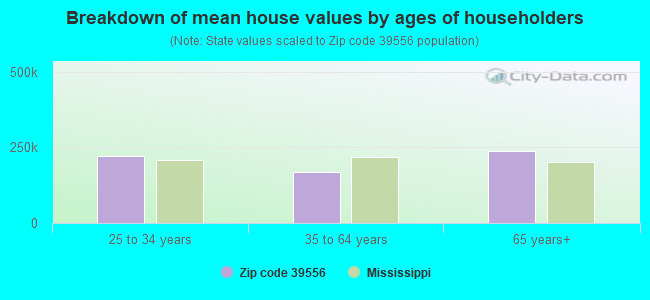
Estimated median house/condo value in 2022: $156,043
39556:
$156,043
Mississippi:
$162,500
According to our research of Mississippi and other state lists, there were 18 registered sex offenders living in 39556 zip code as of May 18, 2024. The ratio of all residents to sex offenders in zip code 39556 is 431 to 1. The ratio of registered sex offenders to all residents in this zip code is lower than the state average.
Median resident age:
This zip code:
38.8 years
Mississippi median age:
38.9 years
Average household size:
This zip code:
2.8 people
Mississippi:
2.5 people
Averages for the 2020 tax year for zip code 39556, filed in 2021:
Average Adjusted Gross Income (AGI) in 2020: $51,029 (Individual Income Tax Returns)
Here:
$51,029
State:
$54,084
Salary/wage: $47,037 (reported on 81.2% of returns)
Here:
$47,037
State:
$45,187
(% of AGI for various income ranges: 1066.1% for AGIs below $25k, 3642.4% for AGIs $25k-50k, 6534.2% for AGIs $50k-75k, 9513.3% for AGIs $75k-100k, 17770.5% for AGIs $100k-200k, 52515.0% for AGIs over 200k)
Taxable interest for individuals: $854 (reported on 22.1% of returns)
This zip code:
$854
Mississippi:
$1,434
(% of AGI for various income ranges: 5.9% for AGIs below $25k, 20.8% for AGIs $25k-50k, 21.5% for AGIs $50k-75k, 21.1% for AGIs $75k-100k, 56.0% for AGIs $100k-200k, 870.0% for AGIs over 200k)
Ordinary dividends: $3,037 (reported on 9.7% of returns)
Here:
$3,037
State:
$6,661
(% of AGI for various income ranges: 9.2% for AGIs below $25k, 17.6% for AGIs $25k-50k, 14.2% for AGIs $50k-75k, 42.8% for AGIs $75k-100k, 172.0% for AGIs $100k-200k, 1230.0% for AGIs over 200k)
Net capital gain/loss in AGI: +$6,390 (reported on 9.4% of returns)
Here:
+$6,390
State:
+$16,833
(% of AGI for various income ranges: 4.3% for AGIs below $25k, 16.2% for AGIs $25k-50k, 39.7% for AGIs $50k-75k, 93.9% for AGIs $75k-100k, 423.5% for AGIs $100k-200k, 2820.0% for AGIs over 200k)
Profit/loss from business: +$9,176 (reported on 18.8% of returns)
Here:
+$9,176
State:
+$7,724
(% of AGI for various income ranges: 197.3% for AGIs below $25k, 140.8% for AGIs $25k-50k, 47.3% for AGIs $50k-75k, 292.8% for AGIs $75k-100k, 958.5% for AGIs $100k-200k)
Taxable individual retirement arrangement distribution: $16,000 (reported on 6.2% of returns)
39556:
$16,000
Mississippi:
$17,717
(% of AGI for various income ranges: 27.6% for AGIs below $25k, 41.7% for AGIs $25k-50k, 130.0% for AGIs $50k-75k, 358.3% for AGIs $75k-100k, 723.0% for AGIs $100k-200k)
Total itemized deductions: $35,833 (reported on 3.9% of returns)
Here:
$35,833
State:
$34,027
(% of AGI for various income ranges: 167.3% for AGIs $25k-50k, 395.6% for AGIs $75k-100k, 650.0% for AGIs $100k-200k, 6170.0% for AGIs over 200k)
Charity contributions: $9,183 (reported on 1.9% of returns)
Here:
$9,183
State:
$14,997
(% of AGI for various income ranges: 17.0% for AGIs $25k-50k, 222.0% for AGIs $100k-200k)
Taxes paid: $6,162 (reported on 2.6% of returns)
39556:
$6,162
State:
$6,353
(% of AGI for various income ranges: 38.8% for AGIs $50k-75k, 182.5% for AGIs $100k-200k)
Earned income credit: $2,618 (reported on 23.4% of returns)
Here:
$2,618
State:
$2,689
(% of AGI for various income ranges: 130.4% for AGIs below $25k, 106.7% for AGIs $25k-50k)
Percentage of individuals using paid preparers for their 2020 taxes: 92.9%
Here:
93%
State:
94%
(% for various income ranges: 93.2% for AGIs below $25k, 93.7% for AGIs $25k-50k, 93.0% for AGIs $50k-75k, 92.3% for AGIs $75k-100k, 91.7% for AGIs $100k-200k, 83.3% for AGIs over 200k)
Averages for the 2012 tax year for zip code 39556, filed in 2013:
Average Adjusted Gross Income (AGI) in 2012: $43,607 (Individual Income Tax Returns)
Here:
$43,607
State:
$46,197
Salary/wage: $39,881 (reported on 84.3% of returns)
Here:
$39,881
State:
$38,549
(% of AGI for various income ranges: 77.4% for AGIs below $25k, 82.1% for AGIs $25k-50k, 84.9% for AGIs $50k-75k, 82.0% for AGIs $75k-100k, 82.1% for AGIs $100k-200k, 33.2% for AGIs over 200k)
Taxable interest for individuals: $902 (reported on 22.0% of returns)
This zip code:
$902
Mississippi:
$1,482
(% of AGI for various income ranges: 0.5% for AGIs below $25k, 0.6% for AGIs $25k-50k, 0.8% for AGIs $50k-75k, 0.3% for AGIs $75k-100k, 0.4% for AGIs $100k-200k)
Ordinary dividends: $1,800 (reported on 10.1% of returns)
Here:
$1,800
State:
$5,401
(% of AGI for various income ranges: 0.4% for AGIs below $25k, 0.4% for AGIs $25k-50k, 0.4% for AGIs $50k-75k, 0.4% for AGIs $75k-100k, 0.7% for AGIs $100k-200k)
Net capital gain/loss in AGI: +$3,809 (reported on 8.0% of returns)
Here:
+$3,809
State:
+$12,121
(% of AGI for various income ranges: 0.1% for AGIs below $25k, 0.8% for AGIs $25k-50k, 0.2% for AGIs $50k-75k, 2.1% for AGIs $100k-200k)
Profit/loss from business: +$7,333 (reported on 19.9% of returns)
Here:
+$7,333
State:
+$10,220
(% of AGI for various income ranges: 11.5% for AGIs below $25k, 3.0% for AGIs $25k-50k, 1.2% for AGIs $50k-75k, 1.0% for AGIs $75k-100k, 3.7% for AGIs $100k-200k)
Taxable individual retirement arrangement distribution: $14,779 (reported on 4.9% of returns)
39556:
$14,779
Mississippi:
$13,665
(% of AGI for various income ranges: 1.8% for AGIs below $25k, 0.9% for AGIs $25k-50k, 3.2% for AGIs $50k-75k, 2.9% for AGIs $100k-200k)
Total itemized deductions: $26,539 (30% of AGI, reported on 20.6% of returns)
Here:
$26,539
State:
$22,078
Here:
29.5% of AGI
State:
21.8% of AGI
(% of AGI for various income ranges: 6.0% for AGIs below $25k, 7.6% for AGIs $25k-50k, 9.7% for AGIs $50k-75k, 9.6% for AGIs $75k-100k, 12.6% for AGIs $100k-200k, 40.7% for AGIs over 200k)
Charity contributions: $2,926 (reported on 14.7% of returns)
Here:
$2,926
State:
$6,081
(% of AGI for various income ranges: 0.4% for AGIs below $25k, 0.6% for AGIs $25k-50k, 1.1% for AGIs $50k-75k, 1.2% for AGIs $75k-100k, 1.5% for AGIs $100k-200k, 0.9% for AGIs over 200k)
Taxes paid: $5,442 (reported on 20.6% of returns)
39556:
$5,442
State:
$5,794
(% of AGI for various income ranges: 1.0% for AGIs below $25k, 1.4% for AGIs $25k-50k, 2.0% for AGIs $50k-75k, 2.4% for AGIs $75k-100k, 4.1% for AGIs $100k-200k, 4.6% for AGIs over 200k)
Earned income credit: $2,508 (reported on 29.4% of returns)
Here:
$2,508
State:
$2,710
(% of AGI for various income ranges: 10.2% for AGIs below $25k, 1.7% for AGIs $25k-50k)
Percentage of individuals using paid preparers for their 2012 taxes: 57.3%
Here:
57%
State:
60%
(% for various income ranges: 53.4% for AGIs below $25k, 54.3% for AGIs $25k-50k, 68.4% for AGIs $50k-75k, 54.5% for AGIs $75k-100k, 68.2% for AGIs $100k-200k, 100.0% for AGIs over 200k)
Averages for the 2004 tax year for zip code 39556, filed in 2005:
Average Adjusted Gross Income (AGI) in 2004: $30,416 (Individual Income Tax Returns)
Here:
$30,416
State:
$36,110
Salary/wage: $29,235 (reported on 86.6% of returns)
Here:
$29,235
State:
$31,757
(% of AGI for various income ranges: 158.9% for AGIs below $10k, 80.7% for AGIs $10k-25k, 84.5% for AGIs $25k-50k, 87.8% for AGIs $50k-75k, 85.1% for AGIs $75k-100k, 66.5% for AGIs over 100k)
Taxable interest for individuals: $881 (reported on 27.3% of returns)
This zip code:
$881
Mississippi:
$1,649
(% of AGI for various income ranges: 4.0% for AGIs below $10k, 1.1% for AGIs $10k-25k, 0.8% for AGIs $25k-50k, 0.4% for AGIs $50k-75k, 0.8% for AGIs $75k-100k, 0.5% for AGIs over 100k)
Taxable dividends: $1,374 (reported on 9.8% of returns)
Here:
$1,374
State:
$3,089
(% of AGI for various income ranges: 1.9% for AGIs below $10k, 0.2% for AGIs $10k-25k, 0.4% for AGIs $25k-50k, 0.2% for AGIs $50k-75k, 0.4% for AGIs $75k-100k, 1.0% for AGIs over 100k)
Net capital gain/loss: +$4,490 (reported on 7.8% of returns)
Here:
+$4,490
State:
+$8,427
(% of AGI for various income ranges: -1.3% for AGIs below $10k, 0.8% for AGIs $10k-25k, 0.5% for AGIs $25k-50k, 0.1% for AGIs $50k-75k, 0.4% for AGIs $75k-100k, 4.8% for AGIs over 100k)
Profit/loss from business: +$6,980 (reported on 19.8% of returns)
Here:
+$6,980
State:
+$8,818
(% of AGI for various income ranges: 33.4% for AGIs below $10k, 8.8% for AGIs $10k-25k, 3.4% for AGIs $25k-50k, 1.6% for AGIs $50k-75k, 1.7% for AGIs $75k-100k, 4.6% for AGIs over 100k)
IRA payment deduction: $2,151 (reported on 2.1% of returns)
39556:
$2,151
Mississippi:
$3,024
Total itemized deductions: $16,277 (25% of AGI, reported on 19.2% of returns)
Here:
$16,277
State:
$17,896
Here:
25.2% of AGI
State:
22.5% of AGI
(% of AGI for various income ranges: 8.1% for AGIs below $10k, 4.2% for AGIs $10k-25k, 11.4% for AGIs $25k-50k, 11.0% for AGIs $50k-75k, 11.8% for AGIs $75k-100k, 12.8% for AGIs over 100k)
Charity contributions deductions: $2,163 (3% of AGI, reported on 16.1% of returns)
Here:
$2,163
State:
$4,735
Here:
3.2% of AGI
State:
5.7% of AGI
(% of AGI for various income ranges: 0.5% for AGIs $10k-25k, 1.2% for AGIs $25k-50k, 1.2% for AGIs $50k-75k, 1.4% for AGIs $75k-100k, 1.6% for AGIs over 100k)
Total tax: $3,807 (reported on 64.8% of returns)
39556:
$3,807
State:
$5,562
(% of AGI for various income ranges: 7.7% for AGIs below $10k, 3.6% for AGIs $10k-25k, 5.6% for AGIs $25k-50k, 8.0% for AGIs $50k-75k, 10.7% for AGIs $75k-100k, 15.3% for AGIs over 100k)
Earned income credit: $2,049 (reported on 33.7% of returns)
Here:
$2,049
State:
$2,107
Percentage of individuals using paid preparers for their 2004 taxes: 63.0%
Here:
63%
State:
65%
(% for various income ranges: 63.4% for AGIs below $10k, 65.3% for AGIs $10k-25k, 63.0% for AGIs $25k-50k, 56.2% for AGIs $50k-75k, 60.9% for AGIs $75k-100k, 63.6% for AGIs over 100k)
Household received Food Stamps/SNAP in the past 12 months: 687 Household did not receive Food Stamps/SNAP in the past 12 months: 2,095
Women who had a birth in the past 12 months: 123 (32 now married, 89 unmarried) Women who did not have a birth in the past 12 months: 1,453 (583 now married, 869 unmarried)
Housing units in zip code 39556 with a mortgage: 1,096 (78 second mortgage, 69 both second mortgage and home equity loan) Houses without a mortgage: 25
Median monthly owner costs for units with a mortgage: $1,108 Median monthly owner costs for units without a mortgage: $356
Residents with income below the poverty level in 2022:
This zip code:
20.3%
Whole state:
19.1%
Residents with income below 50% of the poverty level in 2022:
This zip code:
13.6%
Whole state:
10.3%
Median number of rooms in houses and condos:
Here:
6.0
State:
6.3
Median number of rooms in apartments:
Here:
5.1
State:
4.8
Notable locations in this zip code not listed on our city pages
Notable locations in zip code 39556: Bayou Talla Boat Ramp (A), Country Acres Summer Camp (B), Stennis International Airport Aircraft Rescue Fire Fighting (C), Kiln Volunteer Fire Department (D), Fenton Volunteer Fire Department (E), Hancock County Sheriff's Department (F), Hancock County Library - Kiln Public Library (G), Post 58 Volunteer Fire Department Station 1 (H). Display/hide their locations on the map
Churches in zip code 39556 include: Saint Edwards Church (A), Saint Joseph Church (B), Annunciation Catholic Church (C), Wolf Creek Church (D), First Pentecostal Lighthouse Church (E), Victory Church (F), Faith Assembly of God Church (G), Bayou Talla Fellowship Church (H). Display/hide their locations on the map
In group quarters: 6 (-1 institutionalized population)
Size of family households: 726 2-persons, 429 3-persons, 287 4-persons, 277 5-persons, 84 6-persons, 120 7-or-more-persons
Size of nonfamily households: 771 1-person, 86 2-persons
545 married couples with children.
710 single-parent households (710 women).
98.0% of residents of 39556 zip code speak English at home.
0.9% of residents speak Spanish at home (100% very well).
1.5% of residents speak other Indo-European language at home (44% very well, 56% well).
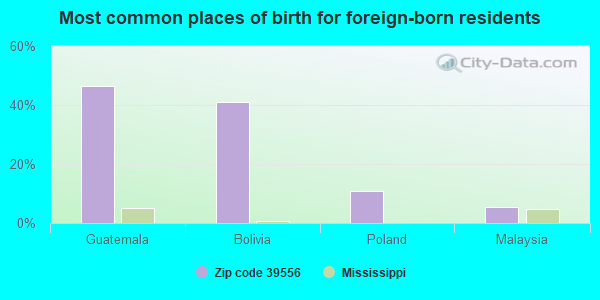
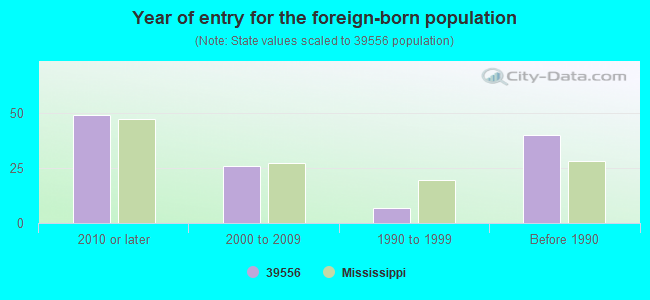
Foreign born population: 53 (0.7%) (35.6% of them are naturalized citizens)
This zip code:
0.7%
Whole state:
2.2%
46%Guatemala
41%Bolivia
11%Poland
5%Malaysia
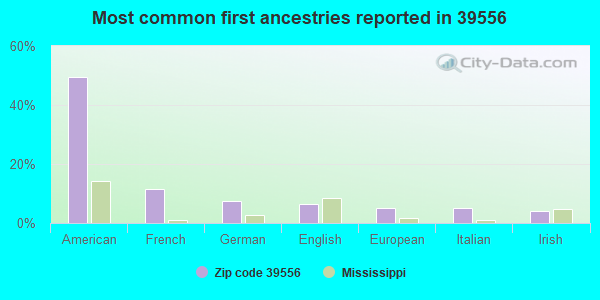
49%American
11%French
7%German
6%English
5%European
5%Italian
4%Irish
Year of entry for the foreign-born population
492010 or later
262000 to 2009
71990 to 1999
40Before 1990
Major facilities with environmental interests located in this zip code:
HANCOCK COUNTY SCHOOLS, EAST HANCOCK ELEMENTARY SCHOOL (4221 KILN-DELISLE ROAD in KILN, MS)
STATE MASTER (Mississippi compliance, permits, activity tracking ) - ENSITE-MS0057070, National Pollutant Discharge Elimination System Permit (National Center for Education Statistics) - STATE ID-2300005 National Pollutant Discharge Elimination System NON-MAJOR (Tracking pollutant discharge elimination systems) - permit Business SIC classification: ELEMENTARY AND SECONDARY SCHOOLS Organizations: HANCOCK CO SCHOOL DIST (SCHOOL DISTRICT)
Alternative names: KILN-DELISLE ROAD ELEMENTARY
DOLLYS QUICK STOP, WHITE LITENIN CARWASH (16593 HIGHWAY 603 in KILN, MS)
STATE MASTER (Mississippi compliance, permits, activity tracking ) - ENSITE-MSU091043, WASTEWATER FACILITY National Pollutant Discharge Elimination System NON-MAJOR (Tracking pollutant discharge elimination systems) - permit National Pollutant Discharge Elimination System NON-MAJOR (Tracking pollutant discharge elimination systems) - permit Business SIC classification: EATING PLACES; CARWASHES Alternative names: CAJUN CONNECTION SEAFOOD, DOLLY S QUICK STOP, DOLLY'S CAR WASH, DOLLYS CARWASH, HANCOCK, PERR HONAS INC
GULF SOUTH PIPELINE COMPANY LP, WAVELAND TREATING PLANT (JUNIOR ROAD 3 MILES SOUTH OF KILN in KILN, MS)
AIR SYNTHETIC MINOR (AIRS/AFS) STATE MASTER (Mississippi compliance, permits, activity tracking ) - ENSITE-04500027, AIR PROGRAM, ENSITE-100000027, AIR SYNTHETIC MINOR, ENSITE-MSD985973536, LQG, ENSITE-MSR101085, NPDES STORMWATER PERMIT CRITERIA AND HAZARDOUS AIR POLLUTANT INVENTORY (Inventory of air pollution sources) (Resource Conservation and Recovery Act (tracking hazardous waste)) Business SIC classification: PIPELINES; NATURAL GAS TRANSMISSION Organizations: KOCH GATEWAY PIPELINE COMPANY (CONTACT/OWNER)
Alternative names: GULF SOUTH PIPELINE company lp waveland, KOCH GATEWAY PIPELINE - WAVELAND, KOCH PIPELINE SOUTHEAST, INC
GULF SOUTH PIPELINE COMPANY LP, KILN COMPRESSOR STATION (17281 BOBINGER ROAD in KILN, MS)
AIR MAJOR (AIRS/AFS) STATE MASTER (Mississippi compliance, permits, activity tracking ) - ENSITE-100000028, AIR MAJOR, ENSITE-MSR000001073, SQG, ENSITE-04500028, AIR PROGRAM, ENSITE-MSR000001073, CESQG CRITERIA AND HAZARDOUS AIR POLLUTANT INVENTORY (Inventory of air pollution sources) Conditionally Exempt Small Quantity Generators, less than 100 kg/month of hazardous waste (Resource Conservation and Recovery Act (tracking hazardous waste)) Business SIC classification: NATURAL GAS TRANSMISSION; NATURAL GAS TRANSMISSION AND DISTRIBUTION Organizations: GULF SOUTH PIPELINE COMPANY, LP (CONTACT/OPERATOR)
Alternative names: GULF SOUTH PIPELINE COMPANY- KILN, KOCH GATEWAY PIPELINE COMPANY, KILN
BREAUX SERVICES INC (6153 ROAD 305 in KILN, MS)
STATE MASTER (Mississippi compliance, permits, activity tracking ) - ENSITE-MSD982117830, TRANSPORTER TRANSPORTER (Resource Conservation and Recovery Act (tracking hazardous waste)) Organizations: LOUIS BREAUX (CONTACT/OPERATOR)
Alternative names: BREAUX SEVICES INCORPORATED, BREAUXS SERVICES, INC.
COAST ELECTRIC POWER ASSOCIATION, COAST ELECTRIC SERVICE CENTER, HIGHWAY 603 (18020 HIGHWAY 603 in KILN, MS)
STATE MASTER (Mississippi compliance, permits, activity tracking ) - ENSITE-MSR000101881, SQG Small Quantity Generators, between 100 kg and 1000 kg of hazardous waste/month (Resource Conservation and Recovery Act (tracking hazardous waste)) Business NAICS classification: ELECTRIC POWER DISTRIBUTION.
HANCOCK COUNTY VOCATIONAL CENTER (7180 AIRPORT ROAD in KILN, MS)
(National Center for Education Statistics) - STATE ID-2300090 Organizations: HANCOCK CO SCHOOL DIST (SCHOOL DISTRICT)
HANCOCK HIGH SCHOOL (7084 STENNIS AIRPORT DRIVE in KILN, MS)
(National Center for Education Statistics) - STATE ID-2300008 Organizations: HANCOCK CO SCHOOL DIST (SCHOOL DISTRICT)
HANCOCK MIDDLE SCHOOL (7070 STENNIS AIRPORT DR in KILN, MS)
(National Center for Education Statistics) - STATE ID-2300009 Organizations: HANCOCK CO SCHOOL DIST (SCHOOL DISTRICT)
HANCOCK NORTH CENTRAL ELEMENTARY (6122 CUEVAS TOWN ROAD in KILN, MS)
(National Center for Education Statistics) - STATE ID-2300006 Organizations: HANCOCK CO SCHOOL DIST (SCHOOL DISTRICT)
HANCOCK COUNTY (17304 HIGHWAY 603 in KILN, MS)
COMPLIANCE ACTIVITY (Tracking inspections of insecticide, fungicide, and rodenticide, and toxic substances) National Pollutant Discharge Elimination System NON-MAJOR (Tracking pollutant discharge elimination systems) - permit Business SIC classification: ELEMENTARY AND SECONDARY SCHOOLS Alternative names: CHARLES B MURPHY ELEM-HANCOCK, CHARLES B MURPHY ELEMENTARY, HANCOCK COUNTY SCHOOL DISTRICT
HENLEY TIMBER CO (17299 OLD JOE MORAN RD in KILN, MS)
(Integrated Compliance Information System) - ICIS-04-1997-0356, FORMAL ENFORCEMENT ACTION
HANCOCK COUNTY (SALEM SCOUT RESERVATION # 2 in KILN, MS)
National Pollutant Discharge Elimination System NON-MAJOR (Tracking pollutant discharge elimination systems) - permit Business SIC classification: SPORTING AND RECREATIONAL CAMPS Alternative names: NEW ORLEANS AREA COUNCIL, SALMEN SCOUT RES DINING HALL, SALMEN SCOUT RESERVATION DINING HALL
Housing units lacking complete plumbing facilities: 3.9% Housing units lacking complete kitchen facilities: 4.6%
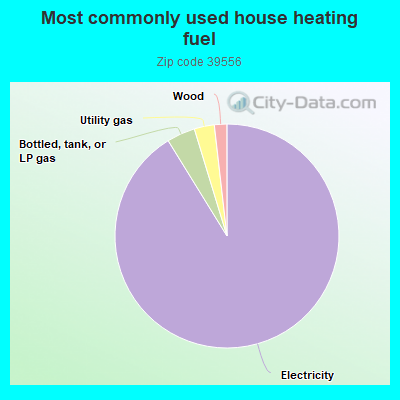
91.3%Electricity
4.1%Bottled, tank, or LP gas
2.9%Utility gas
1.8%Wood
Place of birth for U.S.-born residents:
This state: 4,792
Northeast: 127
Midwest: 376
South: 2,141
West: 331
58% of the 39556 zip code residents lived in the same house 5 years ago. Out of people who lived in different houses, 54% lived in this county. Out of people who lived in different counties, 50% lived in Mississippi.
94% of the 39556 zip code residents lived in the same house 1 year ago. Out of people who lived in different houses, 28% moved from this county. Out of people who lived in different houses, 30% moved from different county within same state. Out of people who lived in different houses, 31% moved from different state. Out of people who lived in different houses, 21% moved from abroad.
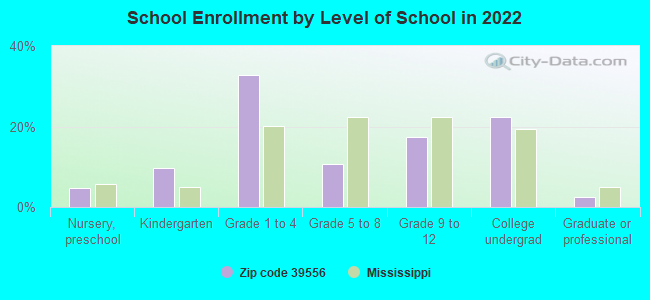
Private vs. public school enrollment:
Students in private schools in grades 1 to 8 (elementary and middle school): 73
Here:
10.2%
Mississippi:
16.1%
Students in private schools in grades 9 to 12 (high school): 39
Here:
13.9%
Mississippi:
14.6%
Students in private undergraduate colleges:
Here:
0.0%
Mississippi:
12.8%
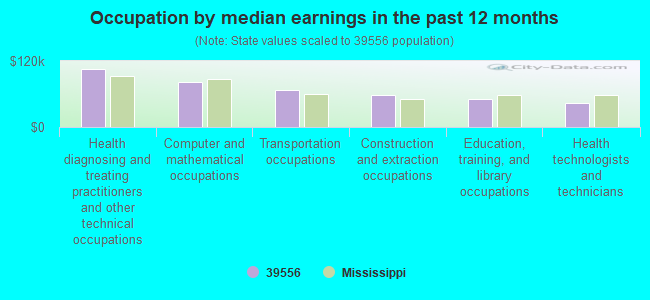
Occupation by median earnings in the past 12 months ($)
104,627Health diagnosing and treating practitioners and other technical occupations
81,881Computer and mathematical occupations
67,162Transportation occupations
58,509Construction and extraction occupations
51,046Education, training, and library occupations
42,732Health technologists and technicians
Companies with federal contracts located in this zip code (KILN, MS):
OPTECH INTERNATIONAL (7225 STENNIS AIRPORT DR; small business) : $1,131,584 in 2 contractsin 2005
$931,584 with Navy for Other Defense -- Advanced Development (R&D). Signed on 2005-11-07. Completion date: 2006-11-06.
$200,000 with Army for Other Research and Development -- Applied Research and Exploratory Development (R&D). Signed on 2005-09-30. Completion date: 2006-10-06.
SMITH & SMITH AIRCRAFT INTERNA (7095 RD C; small business) : $488,248 in 7 contractsfrom 2000 to 2001
Contracts for Airframe Structural Components, Aircraft Landing Gear Components, Aircraft Hydraulic, Vacuum, and De-icing System Components, Nuts and Washers, and moreby Defense Logistics Agency Signed by year:2000: $136,078; 2001: $352,170; 2002: $0; 2003: $0; 2004: $0; 2005: $0; 2006: $0.
Biggest contracts:
$263,785 with Defense Logistics Agency for Airframe Structural Components. Signed on 2001-01-30. Completion date: 2001-12-11.
$58,760 with Defense Logistics Agency for Aircraft Landing Gear Components. Signed on 2001-02-07. Completion date: 2002-01-03.
$43,539 with Defense Logistics Agency for Aircraft Hydraulic, Vacuum, and De-icing System Components. Signed on 2000-05-26. Completion date: 2000-12-22.
$35,748 with Defense Logistics Agency for Airframe Structural Components. Taking place in KS. Signed on 2000-10-23. Completion date: 2001-04-18.
MARDI GRAS AIR, LLC (7252 STENNIS AIRPORT RD; small business)
$295,324 with Defense Logistics Agency for Liquid Propellants and Fuels, Petroleum Base. Signed on 2004-01-15. Completion date: 2007-03-31.
JOSEPH E PETTIGREW (6080 ROAD 542; small business) : $59,112 in 5 contractsfrom 2001 to 2003
Contracts for Other Natural Resources and Conservation Services, Seeds and Nursery Stock, Forest Tree Planting Services by Army, U.S. Army Corps of Engineers - civil program financing only Signed by year:2000: $0; 2001: $41,328; 2002: $8,084; 2003: $9,700; 2004: $0; 2005: $0; 2006: $0.
Biggest contracts:
$35,002 with Army for Other Natural Resources and Conservation Services. Signed on 2001-09-25. Completion date: 2001-12-30.
$9,700 with Army for Seeds and Nursery Stock. Signed on 2003-09-25. Completion date: 2003-10-31.
$8,084 with Army for Forest Tree Planting Services. Signed on 2002-12-11. Completion date: 2002-10-31.
$6,326 with U.S. Army Corps of Engineers - civil program financing only for Forest Tree Planting Services. Signed on 2001-03-19. Completion date: 2001-04-13.
S AND B PRESSURE WASHING (6510 SHAWNEE ST; small business)
$50,000 with Navy for Maintenance, Repair or Alteration of Real Property -- Other Industrial Buildings. Signed on 2005-05-20. Completion date: 2005-06-20.
Top industries in this zip code by the number of employees in 2005:
Utilities: Electric Power Distribution (50-99 employees: 1 establishment)
Construction: Other Building Equipment Contractors (20-49: 1, 1-4: 1)
Construction: Poured Concrete Foundation and Structure Contractors (10-19: 1, 5-9: 2)
Accommodation and Food Services: Full-Service Restaurants (10-19: 1, 5-9: 1)
Mining: Support Activities for Oil and Gas Operations (10-19: 1)
Professional, Scientific, and Technical Services: Public Relations Agencies (10-19: 1)
People in group quarters in 2010:
44 people in group homes intended for adults
Fatal accident statistics in 2014:
Fatal accident count: 2
Vehicles involved in fatal accidents: 3
Fatal accidents caused by drunken drivers: 0
Fatalities: 2
Persons involved in fatal accidents: 4
Pedestrians involved in fatal accidents: 0
Fatal accident statistics in 2013:
Fatal accident count: 4
Vehicles involved in fatal accidents: 4
Fatal accidents caused by drunken drivers: 0
Fatalities: 4
Persons involved in fatal accidents: 6
Pedestrians involved in fatal accidents: 0
Home Mortgage Disclosure Act Aggregated Statistics For Year 2009 (Based on 4 partial tracts)
A) FHA, FSA/RHS & VA Home Purchase Loans
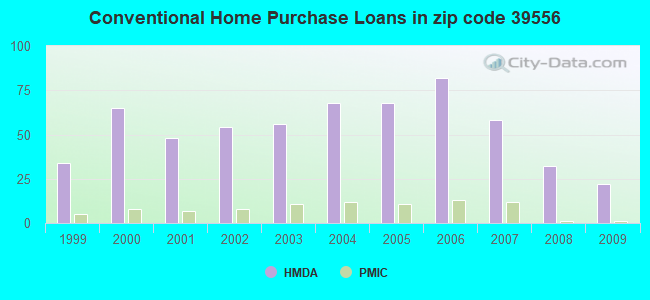
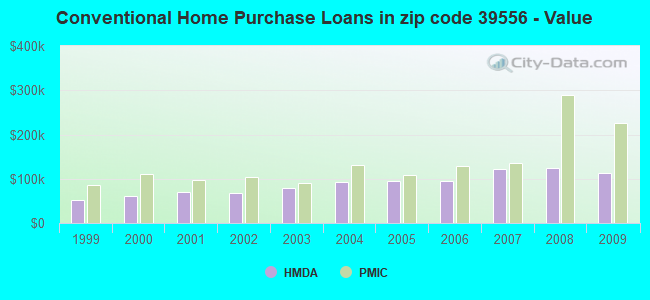
B) Conventional Home Purchase Loans
C) Refinancings
D) Home Improvement Loans
F) Non-occupant Loans on < 5 Family Dwellings (A B C & D)
G) Loans On Manufactured Home Dwelling (A B C & D)
Number
Average Value
Number
Average Value
Number
Average Value
Number
Average Value
Number
Average Value
Number
Average Value
LOANS ORIGINATED
13
$130,531
22
$112,350
69
$170,099
22
$30,264
10
$285,222
16
$40,569
APPLICATIONS APPROVED, NOT ACCEPTED
1
$134,530
3
$86,580
10
$134,681
1
$92,310
0
$0
2
$53,030
APPLICATIONS DENIED
6
$116,858
19
$68,533
51
$132,859
14
$34,195
2
$98,935
22
$49,412
APPLICATIONS WITHDRAWN
1
$115,880
3
$68,903
22
$149,688
3
$48,773
2
$105,075
3
$85,760
FILES CLOSED FOR INCOMPLETENESS
1
$213,590
0
$0
7
$123,451
1
$191,490
0
$0
0
$0
Aggregated Statistics For Year 2008 (Based on 4 partial tracts)
A) FHA, FSA/RHS & VA Home Purchase Loans
B) Conventional Home Purchase Loans
C) Refinancings
D) Home Improvement Loans
F) Non-occupant Loans on < 5 Family Dwellings (A B C & D)
G) Loans On Manufactured Home Dwelling (A B C & D)
Number
Average Value
Number
Average Value
Number
Average Value
Number
Average Value
Number
Average Value
Number
Average Value
LOANS ORIGINATED
7
$139,444
32
$123,287
67
$154,313
34
$41,345
20
$199,518
24
$39,403
APPLICATIONS APPROVED, NOT ACCEPTED
2
$123,485
10
$85,336
11
$140,069
1
$23,570
3
$109,330
10
$52,193
APPLICATIONS DENIED
7
$120,506
22
$77,980
39
$131,424
22
$40,931
7
$101,987
25
$52,910
APPLICATIONS WITHDRAWN
1
$98,200
7
$125,766
21
$122,165
2
$82,490
4
$72,178
6
$61,620
FILES CLOSED FOR INCOMPLETENESS
0
$0
4
$140,918
6
$154,502
0
$0
1
$244,520
1
$85,920
Aggregated Statistics For Year 2007 (Based on 4 partial tracts)
A) FHA, FSA/RHS & VA Home Purchase Loans
B) Conventional Home Purchase Loans
C) Refinancings
D) Home Improvement Loans
F) Non-occupant Loans on < 5 Family Dwellings (A B C & D)
G) Loans On Manufactured Home Dwelling (A B C & D)
Number
Average Value
Number
Average Value
Number
Average Value
Number
Average Value
Number
Average Value
Number
Average Value
LOANS ORIGINATED
6
$150,328
58
$122,758
89
$140,288
43
$34,393
20
$218,323
29
$50,421
APPLICATIONS APPROVED, NOT ACCEPTED
1
$53,030
10
$72,030
17
$125,869
3
$37,643
0
$0
9
$47,354
APPLICATIONS DENIED
1
$95,250
41
$85,003
50
$124,655
21
$36,217
12
$101,964
31
$57,795
APPLICATIONS WITHDRAWN
0
$0
14
$132,289
20
$129,477
7
$73,089
4
$113,912
6
$57,528
FILES CLOSED FOR INCOMPLETENESS
0
$0
5
$136,498
9
$168,140
1
$83,470
1
$92,310
0
$0
Aggregated Statistics For Year 2006 (Based on 4 partial tracts)
A) FHA, FSA/RHS & VA Home Purchase Loans
B) Conventional Home Purchase Loans
C) Refinancings
D) Home Improvement Loans
F) Non-occupant Loans on < 5 Family Dwellings (A B C & D)
G) Loans On Manufactured Home Dwelling (A B C & D)
Number
Average Value
Number
Average Value
Number
Average Value
Number
Average Value
Number
Average Value
Number
Average Value
LOANS ORIGINATED
7
$126,117
82
$95,458
58
$114,835
33
$29,326
16
$97,341
36
$44,217
APPLICATIONS APPROVED, NOT ACCEPTED
1
$113,910
23
$67,907
9
$84,070
3
$45,663
0
$0
17
$42,977
APPLICATIONS DENIED
5
$81,212
47
$63,882
34
$106,995
23
$16,075
8
$55,729
38
$47,601
APPLICATIONS WITHDRAWN
1
$90,340
18
$129,215
19
$115,359
3
$41,407
2
$179,460
3
$36,497
FILES CLOSED FOR INCOMPLETENESS
0
$0
7
$93,570
5
$181,474
1
$46,650
0
$0
0
$0
Aggregated Statistics For Year 2005 (Based on 4 partial tracts)
A) FHA, FSA/RHS & VA Home Purchase Loans
B) Conventional Home Purchase Loans
C) Refinancings
D) Home Improvement Loans
F) Non-occupant Loans on < 5 Family Dwellings (A B C & D)
G) Loans On Manufactured Home Dwelling (A B C & D)
Number
Average Value
Number
Average Value
Number
Average Value
Number
Average Value
Number
Average Value
Number
Average Value
LOANS ORIGINATED
7
$100,094
68
$94,510
48
$95,581
36
$27,128
15
$73,126
30
$35,761
APPLICATIONS APPROVED, NOT ACCEPTED
1
$83,960
16
$63,247
17
$80,004
2
$43,700
2
$86,170
13
$39,922
APPLICATIONS DENIED
4
$61,130
39
$68,073
46
$92,158
20
$21,482
5
$72,176
33
$46,764
APPLICATIONS WITHDRAWN
1
$91,820
22
$88,692
30
$99,804
4
$61,865
1
$139,440
9
$64,376
FILES CLOSED FOR INCOMPLETENESS
0
$0
1
$131,100
4
$101,268
0
$0
0
$0
0
$0
Aggregated Statistics For Year 2004 (Based on 4 partial tracts)
A) FHA, FSA/RHS & VA Home Purchase Loans
B) Conventional Home Purchase Loans
C) Refinancings
D) Home Improvement Loans
F) Non-occupant Loans on < 5 Family Dwellings (A B C & D)
G) Loans On Manufactured Home Dwelling (A B C & D)
Number
Average Value
Number
Average Value
Number
Average Value
Number
Average Value
Number
Average Value
Number
Average Value
LOANS ORIGINATED
10
$106,154
68
$92,850
82
$90,039
37
$20,211
13
$98,125
29
$37,892
APPLICATIONS APPROVED, NOT ACCEPTED
0
$0
5
$89,656
19
$100,526
1
$24,550
0
$0
3
$45,990
APPLICATIONS DENIED
2
$89,115
34
$60,451
45
$85,467
25
$24,884
4
$88,012
30
$34,141
APPLICATIONS WITHDRAWN
0
$0
13
$82,752
33
$95,552
3
$43,373
2
$89,360
4
$30,075
FILES CLOSED FOR INCOMPLETENESS
0
$0
5
$120,296
9
$100,382
0
$0
0
$0
0
$0
Aggregated Statistics For Year 2003 (Based on 4 partial tracts)
A) FHA, FSA/RHS & VA Home Purchase Loans
B) Conventional Home Purchase Loans
C) Refinancings
D) Home Improvement Loans
F) Non-occupant Loans on < 5 Family Dwellings (A B C & D)
Number
Average Value
Number
Average Value
Number
Average Value
Number
Average Value
Number
Average Value
LOANS ORIGINATED
10
$87,545
56
$78,954
128
$95,975
34
$9,676
17
$68,105
APPLICATIONS APPROVED, NOT ACCEPTED
1
$113,420
9
$57,557
18
$76,514
1
$7,370
1
$28,970
APPLICATIONS DENIED
2
$108,020
25
$40,694
53
$87,796
20
$11,980
4
$54,255
APPLICATIONS WITHDRAWN
1
$106,060
7
$77,227
43
$107,312
3
$63,013
2
$138,215
FILES CLOSED FOR INCOMPLETENESS
2
$115,140
0
$0
16
$82,334
1
$36,820
0
$0
Aggregated Statistics For Year 2002 (Based on 4 partial tracts)
A) FHA, FSA/RHS & VA Home Purchase Loans
B) Conventional Home Purchase Loans
C) Refinancings
D) Home Improvement Loans
E) Loans on Dwellings For 5+ Families
F) Non-occupant Loans on < 5 Family Dwellings (A B C & D)
Number
Average Value
Number
Average Value
Number
Average Value
Number
Average Value
Number
Average Value
Number
Average Value
LOANS ORIGINATED
9
$118,494
54
$67,567
100
$88,041
31
$8,078
1
$76,600
8
$59,104
APPLICATIONS APPROVED, NOT ACCEPTED
0
$0
15
$46,351
17
$69,982
3
$5,237
0
$0
1
$89,360
APPLICATIONS DENIED
1
$141,900
42
$38,134
69
$73,273
16
$15,896
0
$0
2
$66,530
APPLICATIONS WITHDRAWN
0
$0
6
$79,297
29
$97,608
4
$13,992
0
$0
0
$0
FILES CLOSED FOR INCOMPLETENESS
1
$58,920
2
$111,705
15
$95,974
0
$0
0
$0
0
$0
Aggregated Statistics For Year 2001 (Based on 4 partial tracts)
A) FHA, FSA/RHS & VA Home Purchase Loans
B) Conventional Home Purchase Loans
C) Refinancings
D) Home Improvement Loans
F) Non-occupant Loans on < 5 Family Dwellings (A B C & D)
Number
Average Value
Number
Average Value
Number
Average Value
Number
Average Value
Number
Average Value
LOANS ORIGINATED
6
$91,735
48
$70,192
104
$84,830
44
$7,867
9
$43,208
APPLICATIONS APPROVED, NOT ACCEPTED
0
$0
16
$47,167
14
$80,524
1
$14,730
2
$41,245
APPLICATIONS DENIED
0
$0
55
$36,709
61
$58,928
16
$6,874
2
$42,470
APPLICATIONS WITHDRAWN
3
$81,997
11
$82,533
36
$83,524
1
$30,930
1
$97,220
FILES CLOSED FOR INCOMPLETENESS
0
$0
1
$98,200
6
$66,858
0
$0
0
$0
Aggregated Statistics For Year 2000 (Based on 4 partial tracts)
A) FHA, FSA/RHS & VA Home Purchase Loans
B) Conventional Home Purchase Loans
C) Refinancings
D) Home Improvement Loans
F) Non-occupant Loans on < 5 Family Dwellings (A B C & D)
Number
Average Value
Number
Average Value
Number
Average Value
Number
Average Value
Number
Average Value
LOANS ORIGINATED
2
$97,465
65
$60,476
55
$68,499
47
$7,898
13
$46,947
APPLICATIONS APPROVED, NOT ACCEPTED
1
$71,190
18
$47,491
11
$74,498
1
$9,820
4
$61,988
APPLICATIONS DENIED
3
$36,990
56
$37,009
39
$75,904
20
$6,604
2
$8,840
APPLICATIONS WITHDRAWN
0
$0
8
$68,434
22
$74,855
1
$49,590
2
$25,780
FILES CLOSED FOR INCOMPLETENESS
0
$0
1
$128,640
5
$83,372
0
$0
0
$0
Aggregated Statistics For Year 1999 (Based on 2 partial tracts)
A) FHA, FSA/RHS & VA Home Purchase Loans
B) Conventional Home Purchase Loans
C) Refinancings
D) Home Improvement Loans
F) Non-occupant Loans on < 5 Family Dwellings (A B C & D)
Detailed PMIC statistics for the following Tracts:0306.00
2003 - 2018 National Fire Incident Reporting System (NFIRS) incidents
According to the data from the years 2003 - 2018 the average number of fires per year is 56. The highest number of fire incidents - 183 took place in 2006, and the least - 14 in 2018. The data has a declining trend.
When looking into fire subcategories, the most reports belonged to: Outside Fires (58.0%), and Structure Fires (26.0%).
Fire incident types reported to NFIRS in Zip Code 39556


 Nearest zip codes: 39525, 39576, 39466, 39571, 39520, 39572.
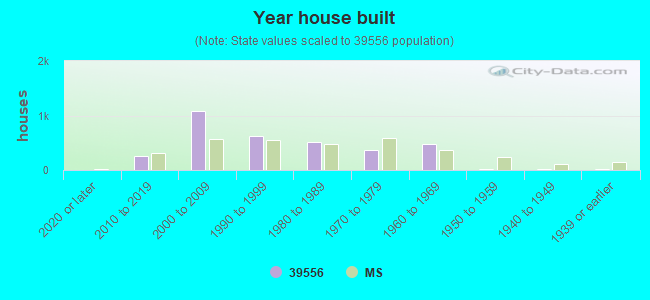


 According to the data from the years 2003 - 2018 the average number of fires per year is 56. The highest number of fire incidents - 183 took place in 2006, and the least - 14 in 2018. The data has a declining trend.
 When looking into fire subcategories, the most reports belonged to: Outside Fires (58.0%), and Structure Fires (26.0%).