Estimated median house/condo value in 2022: $122,790
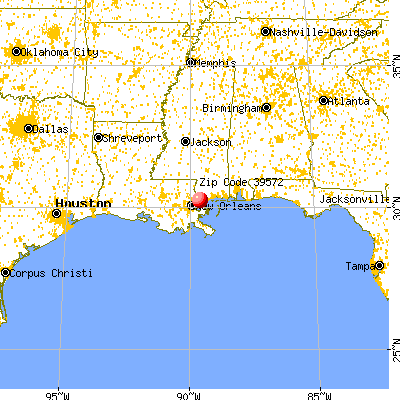
39572:
$122,790
Mississippi:
$162,500
Median resident age:
This zip code:
53.7 years
Mississippi median age:
38.9 years
Average household size:
This zip code:
1.8 people
Mississippi:
2.5 people
Averages for the 2020 tax year for zip code 39572, filed in 2021:
Average Adjusted Gross Income (AGI) in 2020: $42,100 (Individual Income Tax Returns)
Here:
$42,100
State:
$54,084
Salary/wage: $40,100 (reported on 83.0% of returns)
Here:
$40,100
State:
$45,187
(% of AGI for various income ranges: 1007.2% for AGIs below $25k, 3479.1% for AGIs $25k-50k, 6222.0% for AGIs $50k-75k, 12495.0% for AGIs $75k-100k, 21313.3% for AGIs $100k-200k)
Taxable interest for individuals: $443 (reported on 13.2% of returns)
This zip code:
$443
Mississippi:
$1,434
(% of AGI for various income ranges: 22.7% for AGIs $25k-50k, 30.0% for AGIs $75k-100k)
Profit/loss from business: +$3,156 (reported on 17.0% of returns)
Here:
+$3,156
State:
+$7,724
(% of AGI for various income ranges: 126.7% for AGIs below $25k, 78.2% for AGIs $25k-50k)
Earned income credit: $2,225 (reported on 30.2% of returns)
Here:
$2,225
State:
$2,689
(% of AGI for various income ranges: 127.2% for AGIs below $25k, 115.5% for AGIs $25k-50k)
Percentage of individuals using paid preparers for their 2020 taxes: 90.6%
Here:
91%
State:
94%
(% for various income ranges: 91.7% for AGIs below $25k, 92.9% for AGIs $25k-50k, 100.0% for AGIs $50k-75k, 75.0% for AGIs $75k-100k, 80.0% for AGIs $100k-200k)
Averages for the 2012 tax year for zip code 39572, filed in 2013:
Average Adjusted Gross Income (AGI) in 2012: $38,239 (Individual Income Tax Returns)
Here:
$38,239
State:
$46,197
Salary/wage: $36,983 (reported on 81.8% of returns)
Here:
$36,983
State:
$38,549
(% of AGI for various income ranges: 73.5% for AGIs below $25k, 80.4% for AGIs $25k-50k, 82.6% for AGIs $50k-75k, 86.7% for AGIs $75k-100k, 73.7% for AGIs $100k-200k)
Taxable interest for individuals: $525 (reported on 18.2% of returns)
This zip code:
$525
Mississippi:
$1,482
(% of AGI for various income ranges: 0.4% for AGIs below $25k, 0.6% for AGIs $25k-50k, 0.3% for AGIs $75k-100k)
Ordinary dividends: $1,267 (reported on 6.8% of returns)
Here:
$1,267
State:
$5,401
Net capital gain/loss in AGI: +$267 (reported on 6.8% of returns)
Here:
+$267
State:
+$12,121
Profit/loss from business: +$4,025 (reported on 18.2% of returns)
Here:
+$4,025
State:
+$10,220
Total itemized deductions: $22,044 (34% of AGI, reported on 20.5% of returns)
Here:
$22,044
State:
$22,078
Here:
34.4% of AGI
State:
21.8% of AGI
(% of AGI for various income ranges: 15.2% for AGIs $25k-50k, 14.5% for AGIs $50k-75k, 33.1% for AGIs $75k-100k)
Charity contributions: $2,017 (reported on 13.6% of returns)
Here:
$2,017
State:
$6,081
Taxes paid: $3,578 (reported on 20.5% of returns)
39572:
$3,578
State:
$5,794
(% of AGI for various income ranges: 1.4% for AGIs $25k-50k, 2.8% for AGIs $50k-75k, 6.2% for AGIs $75k-100k)
Earned income credit: $2,393 (reported on 31.8% of returns)
Here:
$2,393
State:
$2,710
(% of AGI for various income ranges: 9.5% for AGIs below $25k, 1.4% for AGIs $25k-50k)
Percentage of individuals using paid preparers for their 2012 taxes: 54.5%
Here:
55%
State:
60%
(% for various income ranges: 45.5% for AGIs below $25k, 60.0% for AGIs $25k-50k, 66.7% for AGIs $50k-75k, 133.3% for AGIs $75k-100k)
Averages for the 2004 tax year for zip code 39572, filed in 2005:
Average Adjusted Gross Income (AGI) in 2004: $29,920 (Individual Income Tax Returns)
Here:
$29,920
State:
$36,110
Salary/wage: $28,420 (reported on 86.9% of returns)
Here:
$28,420
State:
$31,757
(% of AGI for various income ranges: 120.5% for AGIs below $10k, 85.5% for AGIs $10k-25k, 86.6% for AGIs $25k-50k, 79.0% for AGIs $50k-75k, 80.3% for AGIs $75k-100k, 69.4% for AGIs over 100k)
Taxable interest for individuals: $967 (reported on 24.8% of returns)
This zip code:
$967
Mississippi:
$1,649
(% of AGI for various income ranges: 3.2% for AGIs below $10k, 0.7% for AGIs $10k-25k, 1.4% for AGIs $25k-50k, 0.5% for AGIs $50k-75k, 0.6% for AGIs $75k-100k)
Taxable dividends: $483 (reported on 5.9% of returns)
Here:
$483
State:
$3,089
Profit/loss from business: +$3,000 (reported on 13.1% of returns)
Here:
+$3,000
State:
+$8,818
(% of AGI for various income ranges: 20.9% for AGIs below $10k, 5.2% for AGIs $10k-25k, -1.9% for AGIs $50k-75k)
Total itemized deductions: $16,260 (27% of AGI, reported on 15.8% of returns)
Here:
$16,260
State:
$17,896
Here:
26.9% of AGI
State:
22.5% of AGI
(% of AGI for various income ranges: 4.6% for AGIs $10k-25k, 8.8% for AGIs $25k-50k, 8.7% for AGIs $50k-75k, 14.7% for AGIs $75k-100k, 10.9% for AGIs over 100k)
Charity contributions deductions: $2,800 (5% of AGI, reported on 12.3% of returns)
Here:
$2,800
State:
$4,735
Here:
4.5% of AGI
State:
5.7% of AGI
Total tax: $3,488 (reported on 67.2% of returns)
39572:
$3,488
State:
$5,562
(% of AGI for various income ranges: 4.0% for AGIs below $10k, 3.1% for AGIs $10k-25k, 5.9% for AGIs $25k-50k, 8.5% for AGIs $50k-75k, 10.3% for AGIs $75k-100k, 16.2% for AGIs over 100k)
Earned income credit: $2,013 (reported on 31.8% of returns)
Here:
$2,013
State:
$2,107
Percentage of individuals using paid preparers for their 2004 taxes: 55.7%
Here:
56%
State:
65%
(% for various income ranges: 50.0% for AGIs below $10k, 57.5% for AGIs $10k-25k, 53.8% for AGIs $25k-50k, 58.3% for AGIs $50k-75k, 115.0% for AGIs $75k-100k)
Household received Food Stamps/SNAP in the past 12 months: 49 Household did not receive Food Stamps/SNAP in the past 12 months: 522
Women who did not have a birth in the past 12 months: 166 (100 now married, 64 unmarried)
Housing units in zip code 39572 with a mortgage: 211 Median monthly owner costs for units with a mortgage: $1,095 Median monthly owner costs for units without a mortgage: $394
Residents with income below the poverty level in 2022:
This zip code:
17.9%
Whole state:
19.1%
Residents with income below 50% of the poverty level in 2022:
This zip code:
13.0%
Whole state:
10.3%
Median number of rooms in houses and condos:
Here:
4.9
State:
6.3
Notable locations in this zip code not listed on our city pages
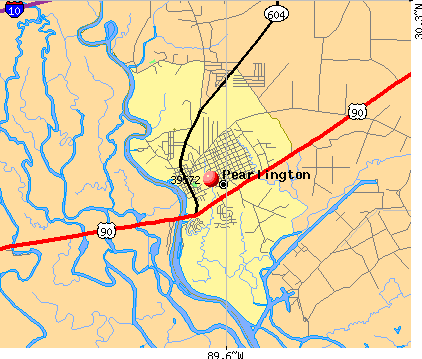
Churches in zip code 39572 include: Holmes Chapel United Methodist Church (A), Greater Mount Zion African Methodist Episcopal Church (B), New Hope Baptist Church (C), First Southern Baptist Church (D). Display/hide their locations on the map
Year house built (houses)
02020 or later
92010 to 2019
4402000 to 2009
641990 to 1999
251980 to 1989
421970 to 1979
131960 to 1969
501950 to 1959
01940 to 1949
01939 or earlier
Bedrooms in owner-occupied houses and condos in Pearlington, MS (39572)
0no bedroom
471 bedroom
1262 bedrooms
3033 bedrooms
964 bedrooms
05+ bedrooms
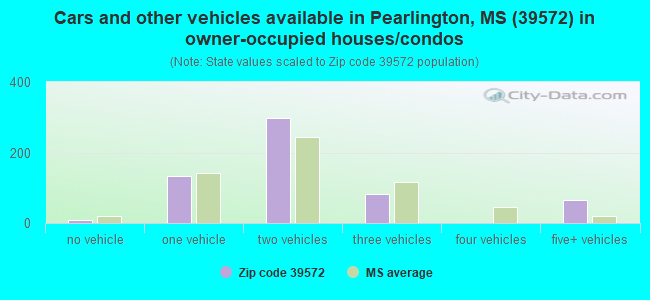
Cars and other vehicles available in Pearlington, MS (39572) in owner-occupied houses/condos
9no vehicle
1321 vehicle
2982 vehicles
823 vehicles
04 vehicles
655+ vehicles
Zip code 39572 household income distribution in 2022
27Less than $10,000
37$10,000 to $14,999
29$15,000 to $19,999
40$20,000 to $24,999
44$30,000 to $34,999
19$35,000 to $39,999
52$40,000 to $44,999
41$45,000 to $49,999
116$50,000 to $59,999
61$60,000 to $74,999
60$75,000 to $99,999
12$125,000 to $149,999
33$150,000 to $199,999
Estimate of home value of owner-occupied houses/condos in 2022 in zip code 39572
35Less than $10,000
36$10,000 to $14,999
6$15,000 to $19,999
38$30,000 to $34,999
24$50,000 to $59,999
30$60,000 to $69,999
57$70,000 to $79,999
35$80,000 to $89,999
5$90,000 to $99,999
36$100,000 to $124,999
66$125,000 to $149,999
73$150,000 to $174,999
39$175,000 to $199,999
55$200,000 to $249,999
20$500,000 to $749,999
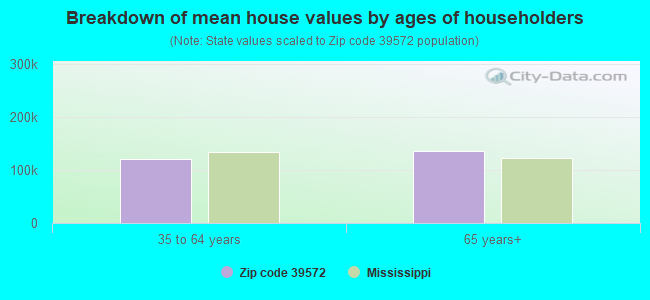
Estimated median house (or condo) value in 2022 for:
White Non-Hispanic householders: $135,930
Black or African American householders: $93,923
American Indian or Alaska Native householders: $48,469
Hispanic or Latino householders: $204,649
Estimated median house or condo value in 2022: $122,790
39572:
$122,790
Mississippi:
$162,500
Lower value quartile - upper value quartile: $59,792 - $183,028
Mean price in 2022:
Detached houses: $159,315
Here:
$159,315
State:
$226,494
Mobile homes: $46,749
Here:
$46,749
State:
$73,695
Housing units in structures:
One, detached: 482
Mobile homes: 172
Unemployment: 2.5%
Means of transportation to work in zip code 39572
73.1%330Drove a car alone
22.1%100Carpooled
1.3%6Other means
3.1%14Worked at home
Travel time to work (commute) in zip code 39572
25Less than 5 minutes
145 to 9 minutes
4815 to 19 minutes
6620 to 24 minutes
9630 to 34 minutes
2435 to 39 minutes
4045 to 59 minutes
10160 to 89 minutes
1990 or more minutes
Percentage of zip code residents living and working in this county: 41.7%
Household type by relationship:
Households: 1,042
Male householders: 393 (196 living alone), Female householders: 177 (72 living alone)
Size of family households: 127 2-persons, 61 3-persons, 42 4-persons, 56 5-persons
Size of nonfamily households: 268 1-person, 18 2-persons
45 married couples with children.
17 single-parent households (17 men).
96.0% of residents of 39572 zip code speak English at home.
5.6% of residents speak other Indo-European language at home (66% very well, 12% well, 22% not well).
Foreign born population: 18 (1.8%) (62.5% of them are naturalized citizens)
This zip code:
1.8%
Whole state:
2.2%
100%Bhutan
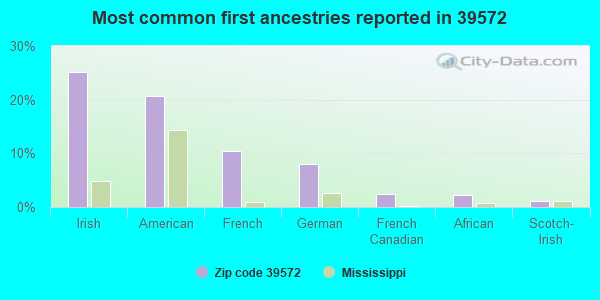
25%Irish
21%American
10%French
8%German
2%French Canadian
2%African
1%Scotch-Irish
Year of entry for the foreign-born population
02010 or later
52000 to 2009
141990 to 1999
0Before 1990
Facilities with environmental interests located in this zip code:
CONTINENTAL ELECTRIC SERVICE (PORT BIENVILLE INDUSTRIAL PARK in PEARLINGTON, MS)
STATE MASTER (Mississippi compliance, permits, activity tracking ) - ENSITE-MSD048104384, HAZARDOUS WASTE PROGRAM (Resource Conservation and Recovery Act (tracking hazardous waste)) Organizations: HALTER MARINE INC. (CONTACT/OWNER)
AZ SERVE LLC, EZ SERVE (16504 HIGHWAY 90 in PEARLINGTON, MS)
STATE MASTER (Mississippi compliance, permits, activity tracking ) - ENSITE-MSU030110, WASTEWATER FACILITY National Pollutant Discharge Elimination System NON-MAJOR (Tracking pollutant discharge elimination systems) - permit Business SIC classification: GASOLINE SERVICE STATIONS Alternative names: HANCOCK
EAGLEBROOK INC (13221 ROAD EAST in PEARLINGTON, MS)
STATE MASTER (Mississippi compliance, permits, activity tracking ) - ENSITE-04500038, AIR PROGRAM, ENSITE-MS0052027, National Pollutant Discharge Elimination System Permit, ENSITE-MSD985979822, CESQG Conditionally Exempt Small Quantity Generators, less than 100 kg/month of hazardous waste (Resource Conservation and Recovery Act (tracking hazardous waste)) - notification TRI REPORTER (Tracking of toxic chemicals releasing facilities) Business SIC classification: INDUSTRIAL INORGANIC CHEMICALS Organizations: EAGLEBROOK INTERNATIONAL GROUP, LTD. (CONTACT/OWNER)
Alternative names: EAGLEBROOK INTERNATIONAL GROUP, LTD.
C AND P ENVIRONMENTAL BROKERS INCORPORATED (17071 BIRCH DRIVE in PEARLINGTON, MS)
STATE MASTER (Mississippi compliance, permits, activity tracking ) - ENSITE-MSD985976166, TRANSPORTER TRANSPORTER (Resource Conservation and Recovery Act (tracking hazardous waste)) Organizations: CHERYL ANN BENNETT (CONTACT/OWNER)
CHARLES B MURPHY SCHOOL (6098 1ST AVENUE in PEARLINGTON, MS)
(National Center for Education Statistics) - STATE ID-2300012 Organizations: HANCOCK CO SCHOOL DIST (SCHOOL DISTRICT)
CON-TECH POWER SYSTEMS INC (17 PORT BIENVILLE IND PARK in PEARLINGTON, MS)
Small Quantity Generators, between 100 kg and 1000 kg of hazardous waste/month (Resource Conservation and Recovery Act (tracking hazardous waste)) - notification Organizations: HAROLD THIBODEAUX (CONTACT/OWNER)
Housing units lacking complete plumbing facilities: 5.7% Housing units lacking complete kitchen facilities: 4.9%
80.9%Electricity
14.0%Bottled, tank, or LP gas
5.6%Utility gas
Place of birth for U.S.-born residents:
This state: 484
Midwest: 12
South: 529
63% of the 39572 zip code residents lived in the same house 5 years ago. Out of people who lived in different houses, 51% lived in this county. Out of people who lived in different counties, 50% lived in Mississippi.
89% of the 39572 zip code residents lived in the same house 1 year ago. Out of people who lived in different houses, 24% moved from this county. Out of people who lived in different houses, 81% moved from different state.
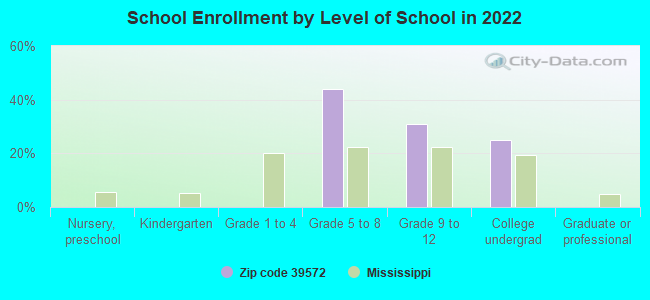
Private vs. public school enrollment:
Students in private schools in grades 1 to 8 (elementary and middle school):
Here:
0.0%
Mississippi:
16.1%
Students in private schools in grades 9 to 12 (high school): 11
Here:
59.6%
Mississippi:
14.6%
Students in private undergraduate colleges:
Here:
0.0%
Mississippi:
12.8%
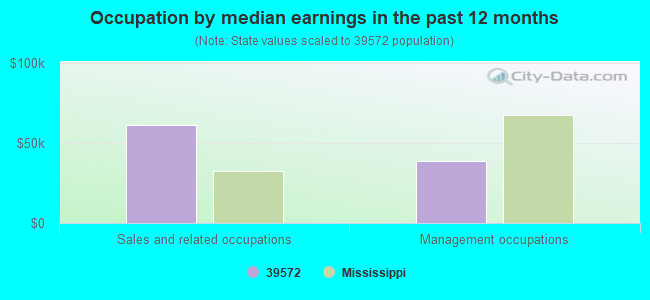
Occupation by median earnings in the past 12 months ($)
61,033Sales and related occupations
38,861Management occupations
Top industries in this zip code by the number of employees in 2005:
Mining: Construction Sand and Gravel Mining (20-49 employees: 1 establishment)
Wholesale Trade: Other Chemical and Allied Products Merchant Wholesalers (10-19: 1)
Administrative and Support and Waste Management and Remediation Services: Temporary Help Services (5-9: 1)
Other Services (except Public Administration): Religious Organizations (1-4: 1)
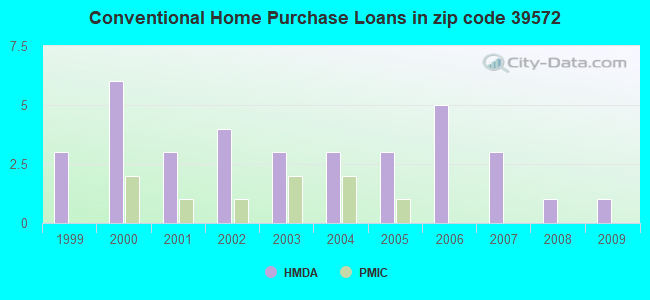
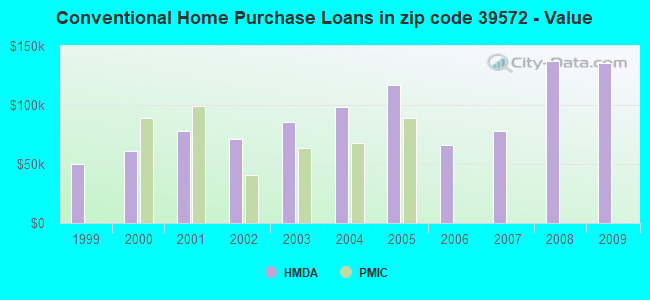
Home Mortgage Disclosure Act Aggregated Statistics For Year 2009 (Based on 2 partial tracts)
B) Conventional Home Purchase Loans
C) Refinancings
D) Home Improvement Loans
F) Non-occupant Loans on < 5 Family Dwellings (A B C & D)
G) Loans On Manufactured Home Dwelling (A B C & D)
Number
Average Value
Number
Average Value
Number
Average Value
Number
Average Value
Number
Average Value
LOANS ORIGINATED
1
$136,010
2
$104,325
3
$18,687
1
$167,000
1
$15,400
APPLICATIONS APPROVED, NOT ACCEPTED
0
$0
0
$0
0
$0
0
$0
0
$0
APPLICATIONS DENIED
1
$98,110
2
$90,605
1
$22,310
0
$0
1
$39,280
APPLICATIONS WITHDRAWN
0
$0
1
$84,490
0
$0
0
$0
0
$0
FILES CLOSED FOR INCOMPLETENESS
0
$0
0
$0
0
$0
0
$0
0
$0
Aggregated Statistics For Year 2008 (Based on 2 partial tracts)
B) Conventional Home Purchase Loans
C) Refinancings
D) Home Improvement Loans
F) Non-occupant Loans on < 5 Family Dwellings (A B C & D)
G) Loans On Manufactured Home Dwelling (A B C & D)
Number
Average Value
Number
Average Value
Number
Average Value
Number
Average Value
Number
Average Value
LOANS ORIGINATED
1
$137,590
2
$102,255
3
$34,610
1
$148,640
0
$0
APPLICATIONS APPROVED, NOT ACCEPTED
0
$0
0
$0
0
$0
0
$0
0
$0
APPLICATIONS DENIED
1
$91,590
3
$115,677
1
$51,720
1
$231,750
1
$82,320
APPLICATIONS WITHDRAWN
1
$81,920
1
$86,460
0
$0
0
$0
0
$0
FILES CLOSED FOR INCOMPLETENESS
0
$0
1
$80,740
0
$0
0
$0
0
$0
Aggregated Statistics For Year 2007 (Based on 2 partial tracts)
B) Conventional Home Purchase Loans
C) Refinancings
D) Home Improvement Loans
F) Non-occupant Loans on < 5 Family Dwellings (A B C & D)
G) Loans On Manufactured Home Dwelling (A B C & D)
Number
Average Value
Number
Average Value
Number
Average Value
Number
Average Value
Number
Average Value
LOANS ORIGINATED
3
$77,907
3
$78,630
2
$26,750
1
$156,930
2
$38,395
APPLICATIONS APPROVED, NOT ACCEPTED
0
$0
1
$131,270
0
$0
0
$0
0
$0
APPLICATIONS DENIED
3
$85,080
3
$109,097
2
$17,765
1
$148,250
2
$71,855
APPLICATIONS WITHDRAWN
1
$92,980
2
$72,645
0
$0
0
$0
0
$0
FILES CLOSED FOR INCOMPLETENESS
0
$0
1
$184,960
0
$0
0
$0
0
$0
Aggregated Statistics For Year 2006 (Based on 2 partial tracts)
B) Conventional Home Purchase Loans
C) Refinancings
D) Home Improvement Loans
F) Non-occupant Loans on < 5 Family Dwellings (A B C & D)
G) Loans On Manufactured Home Dwelling (A B C & D)
Number
Average Value
Number
Average Value
Number
Average Value
Number
Average Value
Number
Average Value
LOANS ORIGINATED
5
$66,484
1
$53,690
2
$22,700
1
$135,420
4
$36,668
APPLICATIONS APPROVED, NOT ACCEPTED
4
$47,622
1
$45,400
0
$0
0
$0
4
$44,415
APPLICATIONS DENIED
8
$54,161
1
$74,420
3
$18,227
0
$0
7
$45,261
APPLICATIONS WITHDRAWN
0
$0
1
$78,370
0
$0
0
$0
0
$0
FILES CLOSED FOR INCOMPLETENESS
0
$0
0
$0
0
$0
0
$0
0
$0
Aggregated Statistics For Year 2005 (Based on 2 partial tracts)
A) FHA, FSA/RHS & VA Home Purchase Loans
B) Conventional Home Purchase Loans
C) Refinancings
D) Home Improvement Loans
F) Non-occupant Loans on < 5 Family Dwellings (A B C & D)
G) Loans On Manufactured Home Dwelling (A B C & D)
Number
Average Value
Number
Average Value
Number
Average Value
Number
Average Value
Number
Average Value
Number
Average Value
LOANS ORIGINATED
0
$0
3
$116,860
3
$99,490
2
$16,385
2
$130,975
0
$0
APPLICATIONS APPROVED, NOT ACCEPTED
0
$0
2
$72,940
1
$165,030
0
$0
0
$0
2
$62,080
APPLICATIONS DENIED
1
$36,320
2
$87,545
4
$97,072
2
$16,185
1
$33,760
2
$44,020
APPLICATIONS WITHDRAWN
0
$0
2
$172,920
3
$69,220
0
$0
1
$76,590
0
$0
FILES CLOSED FOR INCOMPLETENESS
0
$0
0
$0
1
$67,910
0
$0
0
$0
0
$0
Aggregated Statistics For Year 2004 (Based on 2 partial tracts)
B) Conventional Home Purchase Loans
C) Refinancings
D) Home Improvement Loans
F) Non-occupant Loans on < 5 Family Dwellings (A B C & D)
G) Loans On Manufactured Home Dwelling (A B C & D)
Number
Average Value
Number
Average Value
Number
Average Value
Number
Average Value
Number
Average Value
LOANS ORIGINATED
3
$98,240
5
$86,974
2
$13,225
1
$43,630
1
$22,900
APPLICATIONS APPROVED, NOT ACCEPTED
1
$38,490
2
$82,710
0
$0
0
$0
0
$0
APPLICATIONS DENIED
1
$52,510
5
$57,996
2
$17,865
0
$0
0
$0
APPLICATIONS WITHDRAWN
1
$113,110
2
$79,550
0
$0
0
$0
0
$0
FILES CLOSED FOR INCOMPLETENESS
0
$0
1
$39,280
0
$0
0
$0
0
$0
Aggregated Statistics For Year 2003 (Based on 2 partial tracts)
A) FHA, FSA/RHS & VA Home Purchase Loans
B) Conventional Home Purchase Loans
C) Refinancings
D) Home Improvement Loans
F) Non-occupant Loans on < 5 Family Dwellings (A B C & D)
Number
Average Value
Number
Average Value
Number
Average Value
Number
Average Value
Number
Average Value
LOANS ORIGINATED
1
$52,310
3
$85,803
9
$80,759
2
$7,600
1
$106,000
APPLICATIONS APPROVED, NOT ACCEPTED
0
$0
1
$45,990
1
$136,400
1
$6,710
0
$0
APPLICATIONS DENIED
0
$0
2
$63,365
5
$62,418
1
$4,340
0
$0
APPLICATIONS WITHDRAWN
0
$0
1
$58,630
4
$71,952
0
$0
0
$0
FILES CLOSED FOR INCOMPLETENESS
0
$0
1
$59,020
1
$33,760
0
$0
0
$0
Aggregated Statistics For Year 2002 (Based on 2 partial tracts)
A) FHA, FSA/RHS & VA Home Purchase Loans
B) Conventional Home Purchase Loans
C) Refinancings
D) Home Improvement Loans
F) Non-occupant Loans on < 5 Family Dwellings (A B C & D)
Number
Average Value
Number
Average Value
Number
Average Value
Number
Average Value
Number
Average Value
LOANS ORIGINATED
1
$57,840
4
$71,015
9
$85,430
3
$22,637
1
$42,240
APPLICATIONS APPROVED, NOT ACCEPTED
0
$0
1
$38,890
2
$74,220
0
$0
0
$0
APPLICATIONS DENIED
0
$0
3
$25,727
4
$75,012
2
$14,215
1
$15,990
APPLICATIONS WITHDRAWN
0
$0
2
$42,340
2
$79,455
0
$0
0
$0
FILES CLOSED FOR INCOMPLETENESS
0
$0
0
$0
3
$61,720
0
$0
0
$0
Aggregated Statistics For Year 2001 (Based on 2 partial tracts)
B) Conventional Home Purchase Loans
C) Refinancings
D) Home Improvement Loans
F) Non-occupant Loans on < 5 Family Dwellings (A B C & D)
Number
Average Value
Number
Average Value
Number
Average Value
Number
Average Value
LOANS ORIGINATED
3
$78,303
8
$65,488
4
$7,945
2
$47,670
APPLICATIONS APPROVED, NOT ACCEPTED
1
$71,850
3
$54,350
1
$16,780
0
$0
APPLICATIONS DENIED
2
$70,175
4
$62,180
3
$6,053
1
$31,980
APPLICATIONS WITHDRAWN
0
$0
5
$64,312
0
$0
0
$0
FILES CLOSED FOR INCOMPLETENESS
0
$0
0
$0
0
$0
0
$0
Aggregated Statistics For Year 2000 (Based on 2 partial tracts)
A) FHA, FSA/RHS & VA Home Purchase Loans
B) Conventional Home Purchase Loans
C) Refinancings
D) Home Improvement Loans
F) Non-occupant Loans on < 5 Family Dwellings (A B C & D)
Number
Average Value
Number
Average Value
Number
Average Value
Number
Average Value
Number
Average Value
LOANS ORIGINATED
0
$0
6
$61,030
6
$53,923
5
$12,554
1
$74,620
APPLICATIONS APPROVED, NOT ACCEPTED
1
$21,520
2
$50,730
1
$36,320
1
$16,580
0
$0
APPLICATIONS DENIED
0
$0
4
$49,300
5
$39,874
2
$13,030
1
$10,860
APPLICATIONS WITHDRAWN
0
$0
0
$0
1
$52,310
0
$0
0
$0
FILES CLOSED FOR INCOMPLETENESS
0
$0
1
$44,220
0
$0
0
$0
0
$0
Aggregated Statistics For Year 1999 (Based on 1 partial tract)
B) Conventional Home Purchase Loans
C) Refinancings
D) Home Improvement Loans
F) Non-occupant Loans on < 5 Family Dwellings (A B C & D)
Detailed PMIC statistics for the following Tracts:0304.00
2003 - 2017 National Fire Incident Reporting System (NFIRS) incidents
Based on the data from the years 2003 - 2017 the average number of fires per year is 26. The highest number of fire incidents - 87 took place in 2004, and the least - 0 in 2014. The data has a dropping trend.
When looking into fire subcategories, the most incidents belonged to: Outside Fires (57.1%), and Mobile Property/Vehicle Fires (22.3%).
Fire incident types reported to NFIRS in Zip Code 39572


 Nearest zip codes: 70461, 39520, 70458, 39576, 70460, 39556.
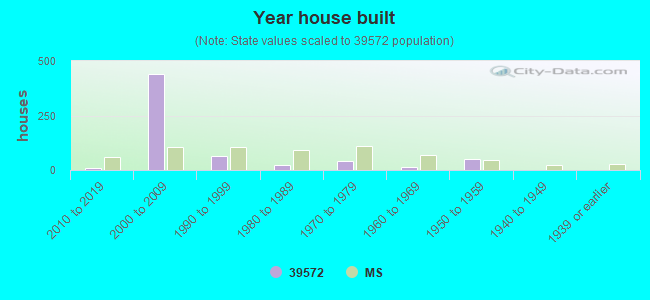


 Based on the data from the years 2003 - 2017 the average number of fires per year is 26. The highest number of fire incidents - 87 took place in 2004, and the least - 0 in 2014. The data has a dropping trend.
 When looking into fire subcategories, the most incidents belonged to: Outside Fires (57.1%), and Mobile Property/Vehicle Fires (22.3%).