Estimated median house/condo value in 2022: $299,219
40003:
$299,219
Kentucky:
$196,300
According to our research of Kentucky and other state lists, there were 3 registered sex offenders living in 40003 zip code as of June 08, 2024. The ratio of all residents to sex offenders in zip code 40003 is 689 to 1. The ratio of registered sex offenders to all residents in this zip code is lower than the state average.
Median resident age:
This zip code:
50.2 years
Kentucky median age:
39.4 years
Average household size:
This zip code:
2.8 people
Kentucky:
2.4 people
Averages for the 2020 tax year for zip code 40003, filed in 2021:
Average Adjusted Gross Income (AGI) in 2020: $60,803 (Individual Income Tax Returns)
Here:
$60,803
State:
$61,342
Salary/wage: $51,493 (reported on 82.0% of returns)
Here:
$51,493
State:
$50,827
(% of AGI for various income ranges: 1218.3% for AGIs below $25k, 3652.9% for AGIs $25k-50k, 5839.1% for AGIs $50k-75k, 10251.4% for AGIs $75k-100k, 18537.8% for AGIs $100k-200k)
Taxable interest for individuals: $607 (reported on 33.7% of returns)
This zip code:
$607
Kentucky:
$1,441
(% of AGI for various income ranges: 7.8% for AGIs below $25k, 54.3% for AGIs $25k-50k, 20.0% for AGIs $50k-75k, 25.7% for AGIs $75k-100k, 57.8% for AGIs $100k-200k)
Ordinary dividends: $4,125 (reported on 13.5% of returns)
Here:
$4,125
State:
$7,388
(% of AGI for various income ranges: 20.0% for AGIs below $25k, 37.9% for AGIs $25k-50k, 93.6% for AGIs $50k-75k, 336.7% for AGIs $100k-200k)
Net capital gain/loss in AGI: +$6,382 (reported on 12.4% of returns)
Here:
+$6,382
State:
+$19,475
(% of AGI for various income ranges: 21.7% for AGIs below $25k, 150.9% for AGIs $50k-75k, 552.2% for AGIs $100k-200k)
Profit/loss from business: +$12,179 (reported on 15.7% of returns)
Here:
+$12,179
State:
+$11,386
(% of AGI for various income ranges: 188.3% for AGIs below $25k, 204.3% for AGIs $25k-50k, 491.8% for AGIs $50k-75k, 298.6% for AGIs $75k-100k, 366.7% for AGIs $100k-200k)
Taxable individual retirement arrangement distribution: $12,629 (reported on 7.9% of returns)
40003:
$12,629
Kentucky:
$18,941
(% of AGI for various income ranges: 277.9% for AGIs $25k-50k, 707.1% for AGIs $75k-100k)
Total itemized deductions: $26,520 (reported on 5.6% of returns)
Here:
$26,520
State:
$32,473
(% of AGI for various income ranges: 1473.3% for AGIs $100k-200k)
Charity contributions: $7,933 (reported on 3.4% of returns)
Here:
$7,933
State:
$13,472
(% of AGI for various income ranges: 264.4% for AGIs $100k-200k)
Taxes paid: $7,180 (reported on 5.6% of returns)
40003:
$7,180
State:
$7,830
(% of AGI for various income ranges: 398.9% for AGIs $100k-200k)
Earned income credit: $2,364 (reported on 12.4% of returns)
Here:
$2,364
State:
$2,336
(% of AGI for various income ranges: 93.9% for AGIs below $25k, 65.0% for AGIs $25k-50k)
Percentage of individuals using paid preparers for their 2020 taxes: 93.3%
Here:
93%
State:
94%
(% for various income ranges: 88.9% for AGIs below $25k, 95.0% for AGIs $25k-50k, 93.3% for AGIs $50k-75k, 90.9% for AGIs $75k-100k, 100.0% for AGIs $100k-200k, 100.0% for AGIs over 200k)
Averages for the 2012 tax year for zip code 40003, filed in 2013:
Average Adjusted Gross Income (AGI) in 2012: $47,774 (Individual Income Tax Returns)
Here:
$47,774
State:
$50,814
Salary/wage: $41,704 (reported on 83.5% of returns)
Here:
$41,704
State:
$42,723
(% of AGI for various income ranges: 75.5% for AGIs below $25k, 75.3% for AGIs $25k-50k, 75.7% for AGIs $50k-75k, 73.3% for AGIs $75k-100k, 68.7% for AGIs $100k-200k)
Taxable interest for individuals: $997 (reported on 34.1% of returns)
This zip code:
$997
Kentucky:
$1,381
(% of AGI for various income ranges: 1.0% for AGIs below $25k, 1.5% for AGIs $25k-50k, 0.7% for AGIs $50k-75k, 0.3% for AGIs $75k-100k, 0.4% for AGIs $100k-200k)
Ordinary dividends: $2,118 (reported on 12.9% of returns)
Here:
$2,118
State:
$6,239
(% of AGI for various income ranges: 1.4% for AGIs $25k-50k, 0.8% for AGIs $50k-75k, 0.4% for AGIs $100k-200k)
Net capital gain/loss in AGI: +$5,633 (reported on 14.1% of returns)
Here:
+$5,633
State:
+$11,336
(% of AGI for various income ranges: 1.1% for AGIs $25k-50k, 1.4% for AGIs $50k-75k, 3.6% for AGIs $100k-200k)
Profit/loss from business: +$8,579 (reported on 16.5% of returns)
Here:
+$8,579
State:
+$10,862
(% of AGI for various income ranges: 5.6% for AGIs below $25k, 2.7% for AGIs $25k-50k, 2.6% for AGIs $50k-75k, 7.4% for AGIs $75k-100k)
Taxable individual retirement arrangement distribution: $10,129 (reported on 8.2% of returns)
40003:
$10,129
Kentucky:
$14,296
Total itemized deductions: $18,592 (23% of AGI, reported on 30.6% of returns)
Here:
$18,592
State:
$21,160
Here:
22.6% of AGI
State:
20.0% of AGI
(% of AGI for various income ranges: 9.3% for AGIs $25k-50k, 12.5% for AGIs $50k-75k, 14.1% for AGIs $75k-100k, 15.0% for AGIs $100k-200k)
Charity contributions: $3,386 (reported on 25.9% of returns)
Here:
$3,386
State:
$4,303
(% of AGI for various income ranges: 1.3% for AGIs $25k-50k, 1.5% for AGIs $50k-75k, 1.8% for AGIs $75k-100k, 2.9% for AGIs $100k-200k)
Taxes paid: $6,296 (reported on 30.6% of returns)
40003:
$6,296
State:
$8,496
(% of AGI for various income ranges: 2.2% for AGIs $25k-50k, 3.5% for AGIs $50k-75k, 5.2% for AGIs $75k-100k, 5.9% for AGIs $100k-200k)
Earned income credit: $1,981 (reported on 18.8% of returns)
Here:
$1,981
State:
$2,273
(% of AGI for various income ranges: 6.4% for AGIs below $25k, 1.1% for AGIs $25k-50k)
Percentage of individuals using paid preparers for their 2012 taxes: 62.4%
Here:
62%
State:
60%
(% for various income ranges: 61.3% for AGIs below $25k, 59.1% for AGIs $25k-50k, 64.3% for AGIs $50k-75k, 66.7% for AGIs $75k-100k, 66.7% for AGIs $100k-200k)
Averages for the 2004 tax year for zip code 40003, filed in 2005:
Average Adjusted Gross Income (AGI) in 2004: $39,340 (Individual Income Tax Returns)
Here:
$39,340
State:
$41,540
Salary/wage: $37,628 (reported on 83.5% of returns)
Here:
$37,628
State:
$36,432
(% of AGI for various income ranges: 121.2% for AGIs below $10k, 73.1% for AGIs $10k-25k, 81.8% for AGIs $25k-50k, 83.2% for AGIs $50k-75k, 83.4% for AGIs $75k-100k, 67.0% for AGIs over 100k)
Taxable interest for individuals: $1,080 (reported on 44.6% of returns)
This zip code:
$1,080
Kentucky:
$1,571
(% of AGI for various income ranges: 15.0% for AGIs below $10k, 2.7% for AGIs $10k-25k, 1.5% for AGIs $25k-50k, 0.4% for AGIs $50k-75k, 0.6% for AGIs $75k-100k, 0.9% for AGIs over 100k)
Taxable dividends: $811 (reported on 15.6% of returns)
Here:
$811
State:
$3,453
(% of AGI for various income ranges: 0.9% for AGIs below $10k, 0.3% for AGIs $10k-25k, 0.2% for AGIs $25k-50k, 0.2% for AGIs $50k-75k, 0.4% for AGIs $75k-100k, 0.6% for AGIs over 100k)
Net capital gain/loss: +$4,103 (reported on 12.4% of returns)
Here:
+$4,103
State:
+$9,663
(% of AGI for various income ranges: -2.4% for AGIs below $10k, 0.5% for AGIs $10k-25k, 0.1% for AGIs $25k-50k, 1.1% for AGIs $50k-75k, 5.5% for AGIs over 100k)
Profit/loss from business: +$6,037 (reported on 17.1% of returns)
Here:
+$6,037
State:
+$9,233
(% of AGI for various income ranges: 6.5% for AGIs below $10k, 6.0% for AGIs $10k-25k, 4.4% for AGIs $25k-50k, 2.9% for AGIs $50k-75k, 0.0% for AGIs $75k-100k)
IRA payment deduction: $3,000 (reported on 1.8% of returns)
40003:
$3,000
Kentucky:
$2,955
Total itemized deductions: $15,953 (25% of AGI, reported on 35.4% of returns)
Here:
$15,953
State:
$17,474
Here:
25.2% of AGI
State:
21.0% of AGI
(% of AGI for various income ranges: 15.7% for AGIs $10k-25k, 12.2% for AGIs $25k-50k, 13.9% for AGIs $50k-75k, 18.6% for AGIs $75k-100k, 14.4% for AGIs over 100k)
Charity contributions deductions: $2,468 (4% of AGI, reported on 29.8% of returns)
Here:
$2,468
State:
$3,494
Here:
3.8% of AGI
State:
4.0% of AGI
(% of AGI for various income ranges: 2.0% for AGIs $10k-25k, 1.4% for AGIs $25k-50k, 1.8% for AGIs $50k-75k, 2.5% for AGIs $75k-100k, 2.1% for AGIs over 100k)
Total tax: $4,615 (reported on 75.3% of returns)
40003:
$4,615
State:
$6,162
(% of AGI for various income ranges: 3.5% for AGIs below $10k, 4.7% for AGIs $10k-25k, 7.6% for AGIs $25k-50k, 7.8% for AGIs $50k-75k, 10.1% for AGIs $75k-100k, 14.2% for AGIs over 100k)
Earned income credit: $1,590 (reported on 13.4% of returns)
Here:
$1,590
State:
$1,723
Percentage of individuals using paid preparers for their 2004 taxes: 66.4%
Here:
66%
State:
66%
(% for various income ranges: 61.3% for AGIs below $10k, 65.5% for AGIs $10k-25k, 67.4% for AGIs $25k-50k, 70.8% for AGIs $50k-75k, 68.3% for AGIs $75k-100k, 65.8% for AGIs over 100k)
Household received Food Stamps/SNAP in the past 12 months: 140 Household did not receive Food Stamps/SNAP in the past 12 months: 576
Women who had a birth in the past 12 months: 9 (9 now married, 0 unmarried) Women who did not have a birth in the past 12 months: 418 (223 now married, 196 unmarried)
Housing units in zip code 40003 with a mortgage: 454 (69 second mortgage, 15 home equity loan, 50 both second mortgage and home equity loan) Median monthly owner costs for units with a mortgage: $1,823 Median monthly owner costs for units without a mortgage: $475
Residents with income below the poverty level in 2022:
This zip code:
13.7%
Whole state:
16.5%
Residents with income below 50% of the poverty level in 2022:
This zip code:
3.7%
Whole state:
9.0%
Median number of rooms in houses and condos:
Here:
7.4
State:
6.4
Median number of rooms in apartments:
Here:
5.8
State:
4.4
Notable locations in this zip code not listed on our city pages
Churches in zip code 40003 include: Indian Fork Baptist Church (A), Lebanon Church (B), Beech Ridge Baptist Church (C). Display/hide their locations on the map
Streams, rivers, and creeks: Sweet Home Branch (A), Burg Creek (B), Indian Fork (C), Goose Creek (D), Andrews Branch (E), Beaver Dam Creek (F), Dutch Fork (G). Display/hide their locations on the map
Size of family households: 254 2-persons, 145 3-persons, 166 4-persons, 57 6-persons
Size of nonfamily households: 58 1-person, 13 2-persons, 7 5-persons
201 married couples with children.
90 single-parent households (19 men, 71 women).
99.2% of residents of 40003 zip code speak English at home.
0.5% of residents speak Spanish at home (100% very well).
0.3% of residents speak Asian or Pacific Island language at home (100% not well).
Foreign born population: 29 (1.5%) (100.0% of them are naturalized citizens)
This zip code:
1.5%
Whole state:
4.0%
114%Uganda
26%American
17%English
11%German
5%Italian
4%European
4%Irish
1%Swedish
Year of entry for the foreign-born population
02010 or later
02000 to 2009
01990 to 1999
27Before 1990
Facilities with environmental interests located in this zip code:
CEDARMORE CAMP & CONF CTR WEST (3083 CEDARMORE RD RAMBO CAMPUS in BAGDAD, KY)
National Pollutant Discharge Elimination System NON-MAJOR (Tracking pollutant discharge elimination systems) - permit National Pollutant Discharge Elimination System NON-MAJOR (Tracking pollutant discharge elimination systems) - permit Business SIC classification: SPORTING AND RECREATIONAL CAMPS Organizations: CEDARMORE CAMP & CONF CTR EAST (CONTACT/OWNER)
Alternative names: CEDARMORE BAPT CONFERENCE EAST, CEDARMORE BAPT CONFERENCE WEST, CEDARMORE CAMP & CONF CTR EAST
BAGDAD ROLLER MILLS INCORPORATED (5740 ELMBURG ROAD in BAGDAD, KY)
AIR MINOR (AIRS/AFS) COMPLIANCE ACTIVITY (Tracking inspections of insecticide, fungicide, and rodenticide, and toxic substances) CRITERIA AND HAZARDOUS AIR POLLUTANT INVENTORY (Inventory of air pollution sources) Business SIC classification: FLOUR AND OTHER GRAIN MILL PRODUCTS; GRAIN AND FIELD BEANS Business NAICS classification: FLOUR MILLING.
B & N FOOD MART (HIGHWAY 395 in BAGDAD, KY)
(Resource Conservation and Recovery Act (tracking hazardous waste)) Organizations: RUSTY NEWTON (CONTACT/OWNER)
Housing units lacking complete plumbing facilities: 3.8% Housing units lacking complete kitchen facilities: 3.8%
69.3%Electricity
22.2%Bottled, tank, or LP gas
6.4%Wood
2.3%Utility gas
Population in 1990: 1,272. Population change in the 1990s: +674 (+53.0%).
Place of birth for U.S.-born residents:
This state: 1,373
Northeast: 144
Midwest: 283
South: 133
West: 84
58% of the 40003 zip code residents lived in the same house 5 years ago. Out of people who lived in different houses, 66% lived in this county. Out of people who lived in different counties, 50% lived in Kentucky.
98% of the 40003 zip code residents lived in the same house 1 year ago. Out of people who lived in different houses, 29% moved from this county. Out of people who lived in different houses, 21% moved from different county within same state. Out of people who lived in different houses, 67% moved from different state.
Private vs. public school enrollment:
Students in private schools in grades 1 to 8 (elementary and middle school):
Here:
0.0%
Kentucky:
17.2%
Students in private schools in grades 9 to 12 (high school):
Here:
0.0%
Kentucky:
15.2%
Students in private undergraduate colleges:
Here:
0.0%
Kentucky:
19.6%
Occupation by median earnings in the past 12 months ($)
114,144Computer and mathematical occupations
67,693Business and financial operations occupations
63,348Management occupations
56,519Education, training, and library occupations
51,941Health technologists and technicians
50,488Production occupations
Top industries in this zip code by the number of employees in 2005:
Other Services (except Public Administration): Religious Organizations (10-19 employees: 1 establishment, 1-4 employees: 1 establishment)
Utilities: Water Supply and Irrigation Systems (10-19: 1)
Construction: New Single-Family Housing Construction (except Operative Builders) (1-4: 2)
Professional, Scientific, and Technical Services: Process, Physical Distribution, and Logistics Consulting Services (1-4: 1)
Construction: Site Preparation Contractors (1-4: 1)
Home Mortgage Disclosure Act Aggregated Statistics For Year 2009 (Based on 2 partial tracts)
A) FHA, FSA/RHS & VA Home Purchase Loans
B) Conventional Home Purchase Loans
C) Refinancings
D) Home Improvement Loans
E) Loans on Dwellings For 5+ Families
F) Non-occupant Loans on < 5 Family Dwellings (A B C & D)
G) Loans On Manufactured Home Dwelling (A B C & D)
Number
Average Value
Number
Average Value
Number
Average Value
Number
Average Value
Number
Average Value
Number
Average Value
Number
Average Value
LOANS ORIGINATED
10
$136,079
21
$146,774
109
$151,034
9
$44,853
1
$263,760
15
$93,518
6
$85,158
APPLICATIONS APPROVED, NOT ACCEPTED
1
$29,020
0
$0
5
$166,238
1
$11,920
0
$0
0
$0
1
$22,280
APPLICATIONS DENIED
5
$163,854
5
$104,054
56
$163,890
7
$65,516
0
$0
2
$72,030
5
$61,044
APPLICATIONS WITHDRAWN
4
$116,725
2
$256,510
21
$173,720
1
$106,230
0
$0
1
$77,730
1
$105,710
FILES CLOSED FOR INCOMPLETENESS
0
$0
0
$0
5
$114,212
1
$25,910
0
$0
0
$0
0
$0
Aggregated Statistics For Year 2008 (Based on 2 partial tracts)
A) FHA, FSA/RHS & VA Home Purchase Loans
B) Conventional Home Purchase Loans
C) Refinancings
D) Home Improvement Loans
F) Non-occupant Loans on < 5 Family Dwellings (A B C & D)
G) Loans On Manufactured Home Dwelling (A B C & D)
Number
Average Value
Number
Average Value
Number
Average Value
Number
Average Value
Number
Average Value
Number
Average Value
LOANS ORIGINATED
11
$152,634
33
$118,762
69
$146,162
11
$43,246
14
$99,901
7
$82,320
APPLICATIONS APPROVED, NOT ACCEPTED
1
$159,610
3
$116,250
6
$171,438
1
$3,630
0
$0
1
$90,170
APPLICATIONS DENIED
4
$169,322
9
$104,964
51
$135,220
11
$77,965
1
$68,400
4
$107,268
APPLICATIONS WITHDRAWN
2
$143,280
1
$20,210
21
$148,279
4
$110,895
1
$91,200
1
$63,220
FILES CLOSED FOR INCOMPLETENESS
1
$39,380
0
$0
4
$123,850
0
$0
0
$0
0
$0
Aggregated Statistics For Year 2007 (Based on 2 partial tracts)
A) FHA, FSA/RHS & VA Home Purchase Loans
B) Conventional Home Purchase Loans
C) Refinancings
D) Home Improvement Loans
F) Non-occupant Loans on < 5 Family Dwellings (A B C & D)
G) Loans On Manufactured Home Dwelling (A B C & D)
Number
Average Value
Number
Average Value
Number
Average Value
Number
Average Value
Number
Average Value
Number
Average Value
LOANS ORIGINATED
6
$136,460
61
$146,753
65
$136,821
15
$40,558
17
$89,954
11
$87,905
APPLICATIONS APPROVED, NOT ACCEPTED
1
$96,390
5
$117,838
12
$133,739
3
$62,010
1
$174,120
3
$75,657
APPLICATIONS DENIED
2
$111,670
9
$165,997
66
$149,257
19
$52,993
2
$166,340
4
$91,592
APPLICATIONS WITHDRAWN
1
$80,840
5
$122,606
29
$148,027
4
$39,512
1
$244,590
3
$129,723
FILES CLOSED FOR INCOMPLETENESS
0
$0
2
$74,620
7
$164,787
0
$0
0
$0
0
$0
Aggregated Statistics For Year 2006 (Based on 2 partial tracts)
A) FHA, FSA/RHS & VA Home Purchase Loans
B) Conventional Home Purchase Loans
C) Refinancings
D) Home Improvement Loans
F) Non-occupant Loans on < 5 Family Dwellings (A B C & D)
G) Loans On Manufactured Home Dwelling (A B C & D)
Number
Average Value
Number
Average Value
Number
Average Value
Number
Average Value
Number
Average Value
Number
Average Value
LOANS ORIGINATED
7
$133,103
59
$129,418
91
$112,324
25
$30,885
20
$108,537
9
$79,803
APPLICATIONS APPROVED, NOT ACCEPTED
1
$52,340
5
$118,876
8
$119,121
1
$22,800
1
$138,880
1
$57,000
APPLICATIONS DENIED
3
$96,040
11
$124,085
65
$126,808
11
$49,795
3
$144,407
7
$109,119
APPLICATIONS WITHDRAWN
0
$0
8
$109,016
25
$135,478
1
$31,090
1
$170,490
2
$47,675
FILES CLOSED FOR INCOMPLETENESS
1
$100,010
2
$47,675
10
$145,407
2
$53,635
0
$0
0
$0
Aggregated Statistics For Year 2005 (Based on 2 partial tracts)
A) FHA, FSA/RHS & VA Home Purchase Loans
B) Conventional Home Purchase Loans
C) Refinancings
D) Home Improvement Loans
F) Non-occupant Loans on < 5 Family Dwellings (A B C & D)
G) Loans On Manufactured Home Dwelling (A B C & D)
Number
Average Value
Number
Average Value
Number
Average Value
Number
Average Value
Number
Average Value
Number
Average Value
LOANS ORIGINATED
4
$106,878
65
$135,418
105
$126,100
11
$49,229
15
$112,553
11
$79,379
APPLICATIONS APPROVED, NOT ACCEPTED
1
$17,100
4
$120,352
16
$151,994
4
$32,518
2
$87,575
2
$53,895
APPLICATIONS DENIED
5
$89,026
12
$93,060
72
$130,586
10
$30,885
2
$92,760
14
$78,766
APPLICATIONS WITHDRAWN
0
$0
5
$164,270
23
$133,065
5
$60,112
1
$140,950
3
$81,013
FILES CLOSED FOR INCOMPLETENESS
0
$0
1
$129,030
8
$176,706
1
$42,490
0
$0
1
$69,960
Aggregated Statistics For Year 2004 (Based on 2 partial tracts)
A) FHA, FSA/RHS & VA Home Purchase Loans
B) Conventional Home Purchase Loans
C) Refinancings
D) Home Improvement Loans
F) Non-occupant Loans on < 5 Family Dwellings (A B C & D)
G) Loans On Manufactured Home Dwelling (A B C & D)
Detailed PMIC statistics for the following Tracts:0401.00
2002 - 2018 National Fire Incident Reporting System (NFIRS) incidents
Based on the data from the years 2002 - 2018 the average number of fire incidents per year is 14. The highest number of reported fires - 22 took place in 2009, and the least - 6 in 2012. The data has a rising trend.
When looking into fire subcategories, the most reports belonged to: Structure Fires (43.5%), and Outside Fires (36.2%).
Fire incident types reported to NFIRS in Zip Code 40003

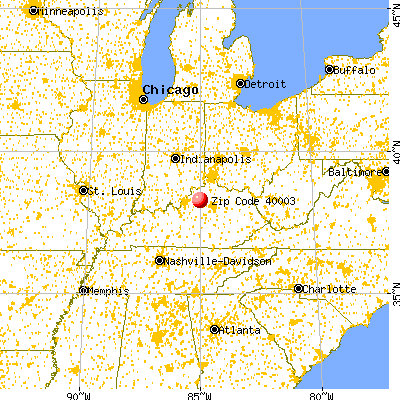


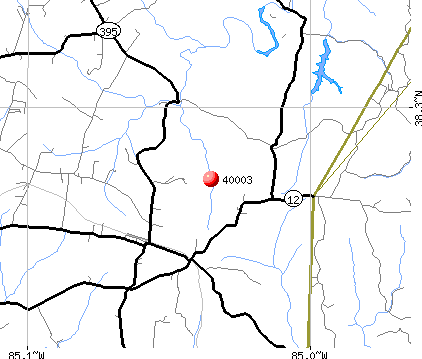 Nearest zip codes: 40057, 40036, 40019, 40076, 40065, 40601.


 Based on the data from the years 2002 - 2018 the average number of fire incidents per year is 14. The highest number of reported fires - 22 took place in 2009, and the least - 6 in 2012. The data has a rising trend.
 When looking into fire subcategories, the most reports belonged to: Structure Fires (43.5%), and Outside Fires (36.2%).