Estimated zip code population in 2022: 3,970 Zip code population in 2010: 3,789 Zip code population in 2000: 3,492
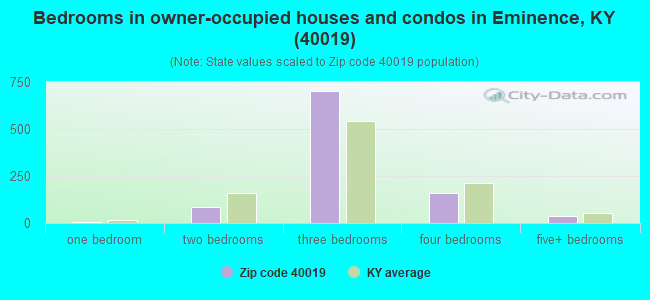
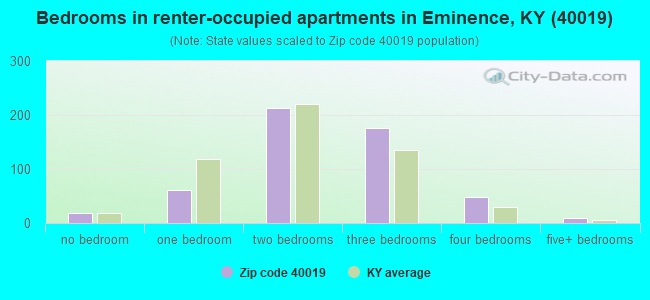
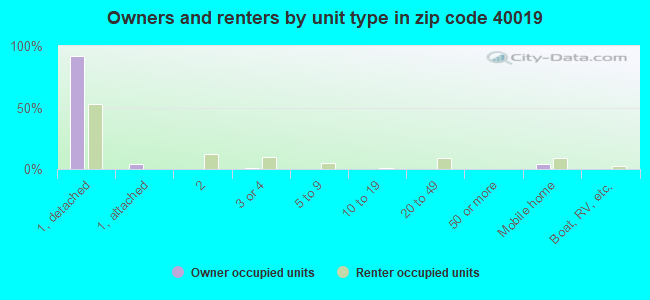
Houses and condos: 1,633 Renter-occupied apartments: 536
% of renters here:
35%
State:
31%
March 2022 cost of living index in zip code 40019: 82.3 (low, U.S. average is 100)
Land area: 37.5 sq. mi. Water area: 1.0 sq. mi.
Population density: 106 people per square mile
(very low).
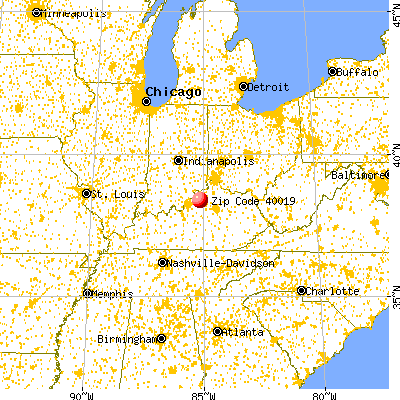
OSM Map
General Map
Google Map
MSN Map
OSM Map
General Map
Google Map
MSN Map
OSM Map
General Map
Google Map
MSN Map
OSM Map
General Map
Google Map
MSN Map
Please wait while loading the map...
Real estate property taxes paid for housing units in 2022:
This zip code:
0.9% ($1,683)
Kentucky:
0.7% ($1,456)
Median real estate property taxes paid for housing units with mortgages in 2022: $1,995 (0.9%) Median real estate property taxes paid for housing units with no mortgage in 2022: $1,399 (0.8%)
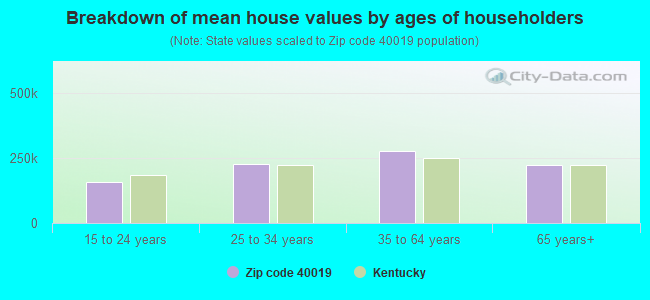
Estimated median house/condo value in 2022: $193,971
40019:
$193,971
Kentucky:
$196,300
According to our research of Kentucky and other state lists, there were 8 registered sex offenders living in 40019 zip code as of May 28, 2024. The ratio of all residents to sex offenders in zip code 40019 is 474 to 1. The ratio of registered sex offenders to all residents in this zip code is near the state average.
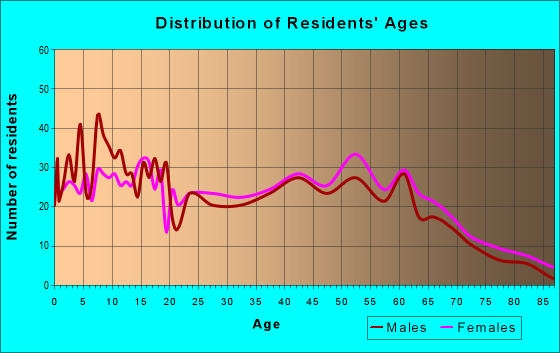
Median resident age:
This zip code:
35.8 years
Kentucky median age:
39.4 years
Average household size:
This zip code:
2.6 people
Kentucky:
2.4 people
Averages for the 2020 tax year for zip code 40019, filed in 2021:
Average Adjusted Gross Income (AGI) in 2020: $50,428 (Individual Income Tax Returns)
Here:
$50,428
State:
$61,342
Salary/wage: $43,093 (reported on 83.5% of returns)
Here:
$43,093
State:
$50,827
(% of AGI for various income ranges: 1113.4% for AGIs below $25k, 3540.5% for AGIs $25k-50k, 6053.8% for AGIs $50k-75k, 9278.2% for AGIs $75k-100k, 16673.6% for AGIs $100k-200k)
Taxable interest for individuals: $1,300 (reported on 20.9% of returns)
This zip code:
$1,300
Kentucky:
$1,441
(% of AGI for various income ranges: 14.2% for AGIs below $25k, 16.6% for AGIs $25k-50k, 16.2% for AGIs $50k-75k, 12.7% for AGIs $75k-100k, 91.8% for AGIs $100k-200k)
Ordinary dividends: $6,106 (reported on 8.8% of returns)
Here:
$6,106
State:
$7,388
(% of AGI for various income ranges: 6.4% for AGIs below $25k, 13.9% for AGIs $25k-50k, 21.9% for AGIs $50k-75k, 765.5% for AGIs $100k-200k)
Net capital gain/loss in AGI: +$21,547 (reported on 8.2% of returns)
Here:
+$21,547
State:
+$19,475
(% of AGI for various income ranges: 8.4% for AGIs below $25k, 37.1% for AGIs $25k-50k, 154.8% for AGIs $50k-75k, 2466.4% for AGIs $100k-200k)
Profit/loss from business: +$7,400 (reported on 13.7% of returns)
Here:
+$7,400
State:
+$11,386
(% of AGI for various income ranges: 104.6% for AGIs below $25k, 68.3% for AGIs $25k-50k, 57.1% for AGIs $50k-75k, 296.4% for AGIs $75k-100k, 546.4% for AGIs $100k-200k)
Taxable individual retirement arrangement distribution: $14,650 (reported on 5.5% of returns)
40019:
$14,650
Kentucky:
$18,941
(% of AGI for various income ranges: 31.0% for AGIs below $25k, 41.2% for AGIs $25k-50k, 140.0% for AGIs $50k-75k, 770.0% for AGIs $75k-100k)
Total itemized deductions: $31,100 (reported on 3.3% of returns)
Here:
$31,100
State:
$32,473
(% of AGI for various income ranges: 333.3% for AGIs $50k-75k, 1060.0% for AGIs $100k-200k)
Charity contributions: $10,517 (reported on 3.3% of returns)
Here:
$10,517
State:
$13,472
(% of AGI for various income ranges: 32.9% for AGIs $25k-50k, 450.9% for AGIs $100k-200k)
Taxes paid: $7,867 (reported on 3.3% of returns)
40019:
$7,867
State:
$7,830
(% of AGI for various income ranges: 84.8% for AGIs $50k-75k, 267.3% for AGIs $100k-200k)
Earned income credit: $2,311 (reported on 19.2% of returns)
Here:
$2,311
State:
$2,336
(% of AGI for various income ranges: 104.8% for AGIs below $25k, 69.5% for AGIs $25k-50k)
Percentage of individuals using paid preparers for their 2020 taxes: 96.2%
Here:
96%
State:
94%
(% for various income ranges: 95.6% for AGIs below $25k, 98.0% for AGIs $25k-50k, 96.3% for AGIs $50k-75k, 100.0% for AGIs $75k-100k, 94.7% for AGIs $100k-200k, 66.7% for AGIs over 200k)
Averages for the 2012 tax year for zip code 40019, filed in 2013:
Average Adjusted Gross Income (AGI) in 2012: $41,557 (Individual Income Tax Returns)
Here:
$41,557
State:
$50,814
Salary/wage: $36,132 (reported on 83.4% of returns)
Here:
$36,132
State:
$42,723
(% of AGI for various income ranges: 73.4% for AGIs below $25k, 78.0% for AGIs $25k-50k, 80.9% for AGIs $50k-75k, 80.1% for AGIs $75k-100k, 57.2% for AGIs $100k-200k)
Taxable interest for individuals: $1,300 (reported on 21.5% of returns)
This zip code:
$1,300
Kentucky:
$1,381
(% of AGI for various income ranges: 1.5% for AGIs below $25k, 0.7% for AGIs $25k-50k, 0.3% for AGIs $50k-75k, 0.3% for AGIs $75k-100k, 0.8% for AGIs $100k-200k)
Ordinary dividends: $1,477 (reported on 8.0% of returns)
Here:
$1,477
State:
$6,239
(% of AGI for various income ranges: 0.3% for AGIs below $25k, 0.3% for AGIs $25k-50k, 0.3% for AGIs $50k-75k, 0.5% for AGIs $100k-200k)
Net capital gain/loss in AGI: +$5,315 (reported on 8.0% of returns)
Here:
+$5,315
State:
+$11,336
(% of AGI for various income ranges: 0.6% for AGIs below $25k, 0.5% for AGIs $25k-50k, 1.4% for AGIs $50k-75k, 1.9% for AGIs $100k-200k)
Profit/loss from business: +$7,796 (reported on 14.1% of returns)
Here:
+$7,796
State:
+$10,862
(% of AGI for various income ranges: 7.5% for AGIs below $25k, 3.2% for AGIs $25k-50k, 0.6% for AGIs $50k-75k, 2.7% for AGIs $100k-200k)
Taxable individual retirement arrangement distribution: $6,450 (reported on 4.9% of returns)
40019:
$6,450
Kentucky:
$14,296
(% of AGI for various income ranges: 1.4% for AGIs below $25k, 1.1% for AGIs $25k-50k, 1.5% for AGIs $50k-75k)
Total itemized deductions: $18,421 (22% of AGI, reported on 23.3% of returns)
Here:
$18,421
State:
$21,160
Here:
21.8% of AGI
State:
20.0% of AGI
(% of AGI for various income ranges: 6.2% for AGIs below $25k, 6.9% for AGIs $25k-50k, 12.0% for AGIs $50k-75k, 12.5% for AGIs $75k-100k, 12.9% for AGIs $100k-200k)
Charity contributions: $3,813 (reported on 18.4% of returns)
Here:
$3,813
State:
$4,303
(% of AGI for various income ranges: 0.6% for AGIs below $25k, 0.9% for AGIs $25k-50k, 1.5% for AGIs $50k-75k, 1.5% for AGIs $75k-100k, 3.1% for AGIs $100k-200k)
Taxes paid: $6,303 (reported on 23.3% of returns)
40019:
$6,303
State:
$8,496
(% of AGI for various income ranges: 1.0% for AGIs below $25k, 1.8% for AGIs $25k-50k, 3.6% for AGIs $50k-75k, 5.0% for AGIs $75k-100k, 5.5% for AGIs $100k-200k)
Earned income credit: $2,295 (reported on 25.2% of returns)
Here:
$2,295
State:
$2,273
(% of AGI for various income ranges: 8.0% for AGIs below $25k, 1.3% for AGIs $25k-50k)
Percentage of individuals using paid preparers for their 2012 taxes: 65.6%
Here:
66%
State:
60%
(% for various income ranges: 62.5% for AGIs below $25k, 67.4% for AGIs $25k-50k, 65.2% for AGIs $50k-75k, 72.7% for AGIs $75k-100k, 72.7% for AGIs $100k-200k)
Averages for the 2004 tax year for zip code 40019, filed in 2005:
Average Adjusted Gross Income (AGI) in 2004: $34,545 (Individual Income Tax Returns)
Here:
$34,545
State:
$41,540
Salary/wage: $31,691 (reported on 86.8% of returns)
Here:
$31,691
State:
$36,432
(% of AGI for various income ranges: 119.6% for AGIs below $10k, 80.0% for AGIs $10k-25k, 82.5% for AGIs $25k-50k, 86.2% for AGIs $50k-75k, 79.4% for AGIs $75k-100k, 59.8% for AGIs over 100k)
Taxable interest for individuals: $1,294 (reported on 35.1% of returns)
This zip code:
$1,294
Kentucky:
$1,571
(% of AGI for various income ranges: 6.7% for AGIs below $10k, 2.1% for AGIs $10k-25k, 1.3% for AGIs $25k-50k, 0.3% for AGIs $50k-75k, 1.2% for AGIs $75k-100k, 1.5% for AGIs over 100k)
Taxable dividends: $1,255 (reported on 10.7% of returns)
Here:
$1,255
State:
$3,453
(% of AGI for various income ranges: 1.6% for AGIs below $10k, 0.3% for AGIs $10k-25k, 0.2% for AGIs $25k-50k, 0.1% for AGIs $50k-75k, 0.4% for AGIs $75k-100k, 1.1% for AGIs over 100k)
Net capital gain/loss: +$7,704 (reported on 10.5% of returns)
Here:
+$7,704
State:
+$9,663
(% of AGI for various income ranges: 2.1% for AGIs below $10k, 0.8% for AGIs $10k-25k, 1.1% for AGIs $25k-50k, 0.3% for AGIs $50k-75k, 2.1% for AGIs $75k-100k, 9.0% for AGIs over 100k)
Profit/loss from business: +$4,870 (reported on 14.3% of returns)
Here:
+$4,870
State:
+$9,233
(% of AGI for various income ranges: 2.9% for AGIs below $10k, 4.3% for AGIs $10k-25k, 1.3% for AGIs $25k-50k, 0.7% for AGIs $50k-75k, 4.2% for AGIs $75k-100k, 1.4% for AGIs over 100k)
IRA payment deduction: $1,800 (reported on 0.7% of returns)
40019:
$1,800
Kentucky:
$2,955
Total itemized deductions: $14,788 (24% of AGI, reported on 29.4% of returns)
Here:
$14,788
State:
$17,474
Here:
23.8% of AGI
State:
21.0% of AGI
(% of AGI for various income ranges: 8.8% for AGIs below $10k, 7.0% for AGIs $10k-25k, 11.9% for AGIs $25k-50k, 14.0% for AGIs $50k-75k, 13.6% for AGIs $75k-100k, 15.7% for AGIs over 100k)
Charity contributions deductions: $3,124 (5% of AGI, reported on 24.0% of returns)
Here:
$3,124
State:
$3,494
Here:
4.8% of AGI
State:
4.0% of AGI
(% of AGI for various income ranges: 1.0% for AGIs $10k-25k, 1.8% for AGIs $25k-50k, 1.6% for AGIs $50k-75k, 2.6% for AGIs $75k-100k, 4.5% for AGIs over 100k)
Total tax: $4,195 (reported on 70.2% of returns)
40019:
$4,195
State:
$6,162
(% of AGI for various income ranges: 4.5% for AGIs below $10k, 3.5% for AGIs $10k-25k, 6.5% for AGIs $25k-50k, 8.1% for AGIs $50k-75k, 10.2% for AGIs $75k-100k, 15.6% for AGIs over 100k)
Earned income credit: $1,820 (reported on 20.9% of returns)
Here:
$1,820
State:
$1,723
Percentage of individuals using paid preparers for their 2004 taxes: 74.0%
Here:
74%
State:
66%
(% for various income ranges: 64.7% for AGIs below $10k, 78.5% for AGIs $10k-25k, 75.1% for AGIs $25k-50k, 76.5% for AGIs $50k-75k, 79.1% for AGIs $75k-100k, 71.9% for AGIs over 100k)
Household received Food Stamps/SNAP in the past 12 months: 269 Household did not receive Food Stamps/SNAP in the past 12 months: 1,262
Women who had a birth in the past 12 months: 14 (14 now married, 0 unmarried) Women who did not have a birth in the past 12 months: 869 (543 now married, 329 unmarried)
Housing units in zip code 40019 with a mortgage: 626 (53 second mortgage, 53 both second mortgage and home equity loan) Houses without a mortgage: 9
Median monthly owner costs for units with a mortgage: $1,245 Median monthly owner costs for units without a mortgage: $493
Residents with income below the poverty level in 2022:
This zip code:
20.1%
Whole state:
16.5%
Residents with income below 50% of the poverty level in 2022:
This zip code:
14.7%
Whole state:
9.0%
Median number of rooms in houses and condos:
Here:
6.1
State:
6.4
Median number of rooms in apartments:
Here:
5.0
State:
4.4
Notable locations in this zip code not listed on our city pages
Notable locations in zip code 40019: Pleasureville Fire Department (A), Eminence Fire Department (B), Henry County Emergency Medical Services (C). Display/hide their locations on the map
Size of family households: 424 2-persons, 233 3-persons, 195 4-persons, 123 5-persons, 38 6-persons, 46 7-or-more-persons
Size of nonfamily households: 363 1-person, 88 2-persons, 20 6-persons
784 married couples with children.
211 single-parent households (13 men, 198 women).
93.9% of residents of 40019 zip code speak English at home.
5.0% of residents speak Spanish at home (62% very well, 26% well, 12% not well).
0.9% of residents speak other Indo-European language at home (100% very well).
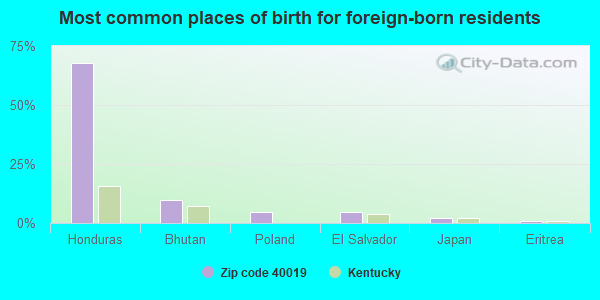
Foreign born population: 155 (3.9%) (81.1% of them are naturalized citizens)
This zip code:
3.9%
Whole state:
4.0%
68%Honduras
10%Bhutan
4%Poland
4%El Salvador
2%Japan
1%Eritrea
19%Irish
17%English
13%American
9%German
2%British
1%Dutch
1%Scandinavian
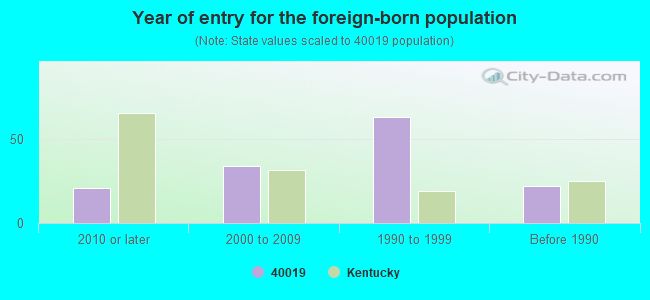
Year of entry for the foreign-born population
212010 or later
342000 to 2009
631990 to 1999
22Before 1990
Facilities with environmental interests located in this zip code:
BROWNING PONTIAC, CHEVROLET, GMC INC. (157 SOUTH PENN AVE. in EMINENCE, KY)
BRUNSWICK BOWLING & BILLIARDS (ROUTE 22 in EMINENCE, KY)
(Resource Conservation and Recovery Act (tracking hazardous waste)) Organizations: CITY OF EMINENCE (CONTACT/OWNER)
BRUNSWICK BOWLING AND BILLIARDS (HWY 22 P O BOX 166 in EMINENCE, KY)
COMPLIANCE ACTIVITY (Tracking inspections of insecticide, fungicide, and rodenticide, and toxic substances)
Housing units lacking complete plumbing facilities: 3.4% Housing units lacking complete kitchen facilities: 5.2%
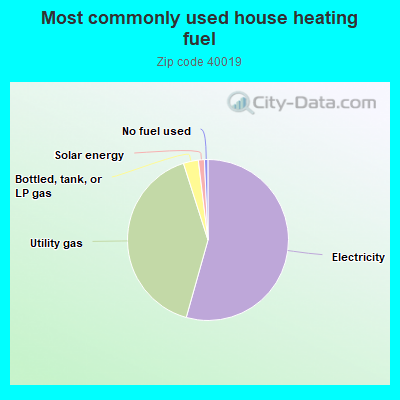
54.1%Electricity
40.5%Utility gas
3.0%Bottled, tank, or LP gas
1.2%Solar energy
0.7%No fuel used
Population in 1990: 2,493. Population change in the 1990s: +999 (+40.1%).
Place of birth for U.S.-born residents:
This state: 3,149
Northeast: 36
Midwest: 272
South: 290
West: 44
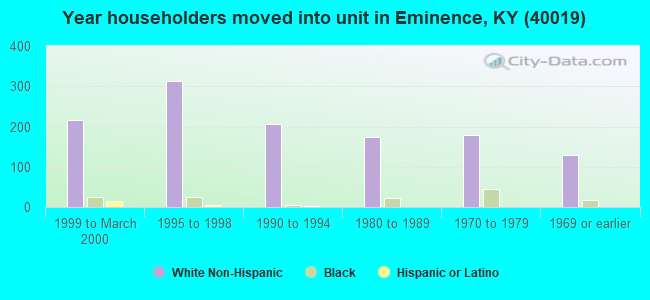
56% of the 40019 zip code residents lived in the same house 5 years ago. Out of people who lived in different houses, 58% lived in this county. Out of people who lived in different counties, 50% lived in Kentucky.
90% of the 40019 zip code residents lived in the same house 1 year ago. Out of people who lived in different houses, 48% moved from this county. Out of people who lived in different houses, 39% moved from different county within same state. Out of people who lived in different houses, 9% moved from different state. Out of people who lived in different houses, 3% moved from abroad.
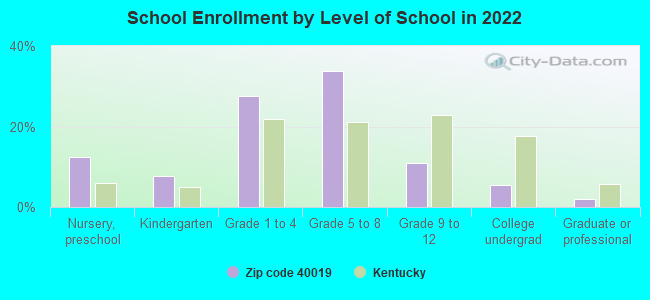
Private vs. public school enrollment:
Students in private schools in grades 1 to 8 (elementary and middle school): 66
Here:
10.4%
Kentucky:
17.2%
Students in private schools in grades 9 to 12 (high school):
Here:
0.0%
Kentucky:
15.2%
Students in private undergraduate colleges: 9
Here:
16.0%
Kentucky:
19.6%
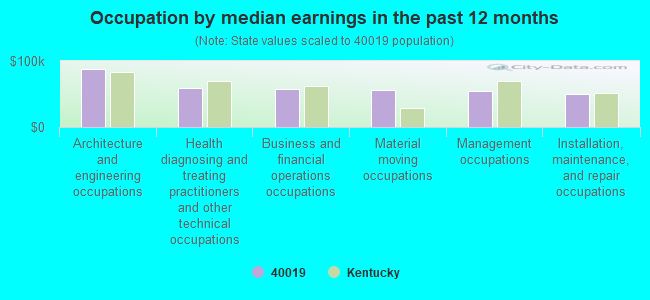
Occupation by median earnings in the past 12 months ($)
88,581Architecture and engineering occupations
58,637Health diagnosing and treating practitioners and other technical occupations
57,014Business and financial operations occupations
55,898Material moving occupations
54,298Management occupations
49,548Installation, maintenance, and repair occupations
Top industries in this zip code by the number of employees in 2005:
Educational Services: Elementary and Secondary Schools (100-249 employees: 1 establishment)
Wholesale Trade: Metal Service Centers and Other Metal Merchant Wholesalers (100-249: 1)
Finance and Insurance: Commercial Banking (20-49: 1, 1-4: 2)
Fatal accident statistics in 2014:
Fatal accident count: 2
Vehicles involved in fatal accidents: 3
Fatal accidents caused by drunken drivers: 0
Fatalities: 2
Persons involved in fatal accidents: 6
Pedestrians involved in fatal accidents: 0
2003 - 2018 National Fire Incident Reporting System (NFIRS) incidents
Based on the data from the years 2003 - 2018 the average number of fire incidents per year is 10. The highest number of reported fire incidents - 24 took place in 2010, and the least - 0 in 2004. The data has a rising trend.
When looking into fire subcategories, the most incidents belonged to: Structure Fires (59.7%), and Outside Fires (21.4%).
Fire incident types reported to NFIRS in Zip Code 40019


 Nearest zip codes: 40058, 40050, 40068, 40070, 40057, 40011.


 Based on the data from the years 2003 - 2018 the average number of fire incidents per year is 10. The highest number of reported fire incidents - 24 took place in 2010, and the least - 0 in 2004. The data has a rising trend.
 When looking into fire subcategories, the most incidents belonged to: Structure Fires (59.7%), and Outside Fires (21.4%).