Estimated median house/condo value in 2022: $497,404
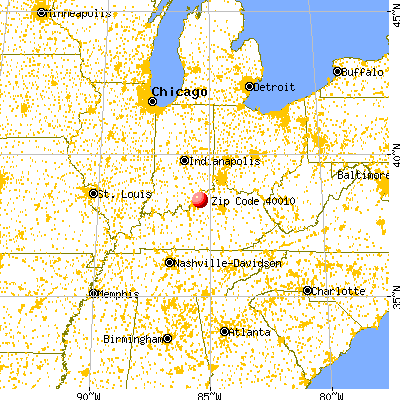
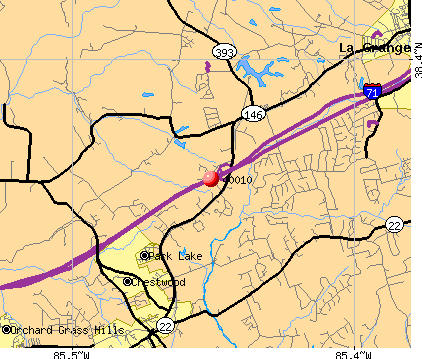
40010:
$497,404
Kentucky:
$196,300
Median resident age:
This zip code:
35.8 years
Kentucky median age:
39.4 years
Average household size:
This zip code:
3.2 people
Kentucky:
2.4 people
Averages for the 2020 tax year for zip code 40010, filed in 2021:
Average Adjusted Gross Income (AGI) in 2020: $99,474 (Individual Income Tax Returns)
Here:
$99,474
State:
$61,342
Salary/wage: $84,838 (reported on 82.9% of returns)
Here:
$84,838
State:
$50,827
(% of AGI for various income ranges: 1247.1% for AGIs below $25k, 3102.0% for AGIs $25k-50k, 6635.0% for AGIs $50k-75k, 8670.0% for AGIs $75k-100k, 13152.9% for AGIs $100k-200k)
Taxable interest for individuals: $1,558 (reported on 34.3% of returns)
This zip code:
$1,558
Kentucky:
$1,441
(% of AGI for various income ranges: 7.1% for AGIs below $25k, 35.0% for AGIs $50k-75k, 44.3% for AGIs $100k-200k)
Ordinary dividends: $3,800 (reported on 28.6% of returns)
Here:
$3,800
State:
$7,388
(% of AGI for various income ranges: 84.0% for AGIs $25k-50k, 127.1% for AGIs $100k-200k)
Net capital gain/loss in AGI: +$1,700 (reported on 20.0% of returns)
Here:
+$1,700
State:
+$19,475
(% of AGI for various income ranges: 54.0% for AGIs $25k-50k, 131.4% for AGIs $100k-200k)
Profit/loss from business: +$6,060 (reported on 14.3% of returns)
Here:
+$6,060
State:
+$11,386
(% of AGI for various income ranges: 432.9% for AGIs $100k-200k)
Taxable individual retirement arrangement distribution: $19,433 (reported on 8.6% of returns)
40010:
$19,433
Kentucky:
$18,941
(% of AGI for various income ranges: 2915.0% for AGIs $50k-75k)
Total itemized deductions: $32,920 (reported on 14.3% of returns)
Here:
$32,920
State:
$32,473
(% of AGI for various income ranges: 3335.0% for AGIs $75k-100k)
Charity contributions: $9,700 (reported on 11.4% of returns)
Here:
$9,700
State:
$13,472
(% of AGI for various income ranges: )
Taxes paid: $8,780 (reported on 14.3% of returns)
40010:
$8,780
State:
$7,830
(% of AGI for various income ranges: 1000.0% for AGIs $75k-100k)
Earned income credit: $3,450 (reported on 5.7% of returns)
Here:
$3,450
State:
$2,336
(% of AGI for various income ranges: 98.6% for AGIs below $25k)
Percentage of individuals using paid preparers for their 2020 taxes: 94.3%
Here:
94%
State:
94%
(% for various income ranges: 90.0% for AGIs below $25k, 100.0% for AGIs $25k-50k, 75.0% for AGIs $50k-75k, 100.0% for AGIs $75k-100k, 100.0% for AGIs $100k-200k, 100.0% for AGIs over 200k)
Averages for the 2012 tax year for zip code 40010, filed in 2013:
Average Adjusted Gross Income (AGI) in 2012: $82,838 (Individual Income Tax Returns)
Here:
$82,838
State:
$50,814
Salary/wage: $73,261 (reported on 87.5% of returns)
Here:
$73,261
State:
$42,723
(% of AGI for various income ranges: 80.6% for AGIs below $25k, 70.3% for AGIs $25k-50k, 76.6% for AGIs $50k-75k, 68.4% for AGIs $75k-100k, 79.6% for AGIs $100k-200k)
Taxable interest for individuals: $1,045 (reported on 34.4% of returns)
This zip code:
$1,045
Kentucky:
$1,381
(% of AGI for various income ranges: 1.2% for AGIs $25k-50k, 0.5% for AGIs $75k-100k, 0.4% for AGIs $100k-200k)
Ordinary dividends: $2,400 (reported on 25.0% of returns)
Here:
$2,400
State:
$6,239
Net capital gain/loss in AGI: +$233 (reported on 18.8% of returns)
Here:
+$233
State:
+$11,336
Profit/loss from business: +$9,500 (reported on 12.5% of returns)
Here:
+$9,500
State:
+$10,862
Taxable individual retirement arrangement distribution: $7,750 (reported on 6.2% of returns)
40010:
$7,750
Kentucky:
$14,296
Total itemized deductions: $25,550 (18% of AGI, reported on 50.0% of returns)
Here:
$25,550
State:
$21,160
Here:
18.2% of AGI
State:
20.0% of AGI
(% of AGI for various income ranges: 26.3% for AGIs $25k-50k, 16.7% for AGIs $75k-100k, 16.2% for AGIs $100k-200k)
Charity contributions: $3,106 (reported on 50.0% of returns)
Here:
$3,106
State:
$4,303
(% of AGI for various income ranges: 2.7% for AGIs $25k-50k, 1.9% for AGIs $75k-100k, 2.0% for AGIs $100k-200k)
Taxes paid: $11,662 (reported on 50.0% of returns)
40010:
$11,662
State:
$8,496
(% of AGI for various income ranges: 7.3% for AGIs $25k-50k, 6.9% for AGIs $75k-100k, 8.0% for AGIs $100k-200k)
Earned income credit: $2,100 (reported on 9.4% of returns)
Here:
$2,100
State:
$2,273
(% of AGI for various income ranges: 5.9% for AGIs below $25k)
Percentage of individuals using paid preparers for their 2012 taxes: 53.1%
Here:
53%
State:
60%
(% for various income ranges: 50.0% for AGIs below $25k, 50.0% for AGIs $25k-50k, 150.0% for AGIs $50k-75k, 60.0% for AGIs $100k-200k)
Averages for the 2004 tax year for zip code 40010, filed in 2005:
Average Adjusted Gross Income (AGI) in 2004: $66,489 (Individual Income Tax Returns)
Here:
$66,489
State:
$41,540
Salary/wage: $63,530 (reported on 92.3% of returns)
Here:
$63,530
State:
$36,432
(% of AGI for various income ranges: 97.4% for AGIs below $10k, 77.0% for AGIs $10k-25k, 86.5% for AGIs $25k-50k, 84.1% for AGIs $50k-75k, 89.7% for AGIs $75k-100k, 89.7% for AGIs over 100k)
Taxable interest for individuals: $338 (reported on 54.0% of returns)
This zip code:
$338
Kentucky:
$1,571
(% of AGI for various income ranges: 2.0% for AGIs below $10k, 0.2% for AGIs $10k-25k, 0.1% for AGIs $25k-50k, 0.2% for AGIs $50k-75k, 0.2% for AGIs $75k-100k, 0.3% for AGIs over 100k)
Taxable dividends: $1,167 (reported on 30.7% of returns)
Here:
$1,167
State:
$3,453
(% of AGI for various income ranges: 0.7% for AGIs below $10k, 0.2% for AGIs $50k-75k, 0.2% for AGIs $75k-100k, 0.9% for AGIs over 100k)
Profit/loss from business: +$5,222 (reported on 16.4% of returns)
Here:
+$5,222
State:
+$9,233
Total itemized deductions: $22,253 (22% of AGI, reported on 54.7% of returns)
Here:
$22,253
State:
$17,474
Here:
21.7% of AGI
State:
21.0% of AGI
(% of AGI for various income ranges: 9.6% for AGIs $25k-50k, 23.1% for AGIs $50k-75k, 22.0% for AGIs $75k-100k, 18.9% for AGIs over 100k)
Charity contributions deductions: $2,949 (3% of AGI, reported on 50.4% of returns)
Here:
$2,949
State:
$3,494
Here:
2.8% of AGI
State:
4.0% of AGI
(% of AGI for various income ranges: 3.3% for AGIs $50k-75k, 3.2% for AGIs $75k-100k, 2.2% for AGIs over 100k)
Total tax: $8,438 (reported on 85.0% of returns)
40010:
$8,438
State:
$6,162
(% of AGI for various income ranges: 2.0% for AGIs below $10k, 4.1% for AGIs $10k-25k, 7.8% for AGIs $25k-50k, 7.9% for AGIs $50k-75k, 7.6% for AGIs $75k-100k, 14.0% for AGIs over 100k)
Earned income credit: $1,682 (reported on 8.0% of returns)
Here:
$1,682
State:
$1,723
Percentage of individuals using paid preparers for their 2004 taxes: 53.6%
Here:
54%
State:
66%
(% for various income ranges: 38.9% for AGIs below $10k, 52.2% for AGIs $10k-25k, 63.6% for AGIs $25k-50k, 66.7% for AGIs $50k-75k, 44.4% for AGIs $75k-100k, 55.2% for AGIs over 100k)
Household received Food Stamps/SNAP in the past 12 months: 0 Household did not receive Food Stamps/SNAP in the past 12 months: 162
Women who had a birth in the past 12 months: 8 (0 now married, 8 unmarried) Women who did not have a birth in the past 12 months: 122 (50 now married, 72 unmarried)
Housing units in zip code 40010 with a mortgage: 88 (9 second mortgage, 9 both second mortgage and home equity loan) Median monthly owner costs for units with a mortgage: $2,366 Median monthly owner costs for units without a mortgage: $780
Median number of rooms in houses and condos:
Here:
10.0
State:
6.4
Notable locations in this zip code not listed on our city pages
Size of family households: 10 2-persons, 82 3-persons, 43 4-persons, 15 5-persons
Size of nonfamily households: 11 1-person
96 married couples with children.
66 single-parent households (27 men, 39 women).
99.4% of residents of 40010 zip code speak English at home.
Foreign born population: 0 (0.0%)
:
0.0%
Whole state:
4.0%
43%English
16%French
16%Irish
11%Italian
6%German
5%American
Year of entry for the foreign-born population
02010 or later
02000 to 2009
01990 to 1999
22Before 1990
Major facilities with environmental interests located in this zip code:
PEARCE BROTHERS READY MIX CONCRETE & SUPPLY (4614 OLD LAGRANGE RD in BUCKNER, KY)
AIR MINOR (AIRS/AFS) (Integrated Compliance Information System) - ICIS-04-2000-0213, FORMAL ENFORCEMENT ACTION COMPLIANCE ACTIVITY (Tracking inspections of insecticide, fungicide, and rodenticide, and toxic substances) CRITERIA AND HAZARDOUS AIR POLLUTANT INVENTORY (Inventory of air pollution sources) National Pollutant Discharge Elimination System NON-MAJOR (Tracking pollutant discharge elimination systems) - permit Business SIC classification: READY-MIXED CONCRETE Organizations: PEARCE BROS READY MIX CONCRETE (CONTACT/OWNER)
Alternative names: PEARCE BROS READY MIX, PEARCE BROS READY MIX CONCRETE
BUCKNER ELEMENTARY SCHOOL (1240 COLONELS DR in BUCKNER, KY)
(National Center for Education Statistics) - STATE ID-093465007 Organizations: OLDHAM COUNTY (SCHOOL DISTRICT)
OLDHAM COUNTY ALTERNATIVE ELEM SCHOOL (1350 N HWY 393 in BUCKNER, KY)
(National Center for Education Statistics) - STATE ID-093465075
OLDHAM COUNTY ALTERNATIVE SCHOOL (1350 N HWY 393 in BUCKNER, KY)
(National Center for Education Statistics) - STATE ID-093465080
OLDHAM COUNTY AREA TECHNOLOGY CENTER (HWY 393 in BUCKNER, KY)
(National Center for Education Statistics) - STATE ID-093465905
OLDHAM COUNTY HIGH SCHOOL (1150 N HWY 393 in BUCKNER, KY)
(National Center for Education Statistics) - STATE ID-093465060
OLDHAM COUNTY MIDDLE SCHOOL (4305 BROWN BLVD in BUCKNER, KY)
(National Center for Education Statistics) - STATE ID-093465070
OLDHAM COUNTY PRESCHOOL (1242 COLONELS DR in BUCKNER, KY)
(National Center for Education Statistics) - STATE ID-093465100
CATALYST TECHNOLOGY MIDWEST (4414 OLD LAGRANGE ROAD in BUCKNER, KY)
National Pollutant Discharge Elimination System NON-MAJOR (Tracking pollutant discharge elimination systems) - permit Conditionally Exempt Small Quantity Generators, less than 100 kg/month of hazardous waste (Resource Conservation and Recovery Act (tracking hazardous waste)) - notification Business SIC classification: ENGINEERING SERVICES Alternative names: CATALYST TECHNOLOGY, INC.
CLAYTON AND LAMBERT MANUFACTURING COMPANY (3813 WEST HIGHWAY 146 in BUCKNER, KY)
COMPLIANCE ACTIVITY (Tracking inspections of insecticide, fungicide, and rodenticide, and toxic substances) CRITERIA AND HAZARDOUS AIR POLLUTANT INVENTORY (Inventory of air pollution sources) (Resource Conservation and Recovery Act (tracking hazardous waste)) Business SIC classification: FABRICATED STRUCTURAL METAL Business NAICS classification: PLATE WORK MANUFACTURING. Organizations: CLAYTON & LAMBERT MFG COMPANY (CONTACT/OWNER)
AGGRESSIVE TOOL & DIE, INC. (4740 OLD LAGRANGE ROAD in BUCKNER, KY)
(Resource Conservation and Recovery Act (tracking hazardous waste)) Business NAICS classification: SPECIAL DIE AND TOOL, DIE SET, JIG, AND FIXTURE MANUFACTURING. Organizations: ROGER E. GEARY (CONTACT/OWNER)
BUCKNER STP (3517 MATTINGLY RD in BUCKNER, KY)
National Pollutant Discharge Elimination System NON-MAJOR (Tracking pollutant discharge elimination systems) - permit Business SIC classification: SEWERAGE SYSTEMS
NEW GOSHEN ELEM SCHOOL (1215 RIDGEMOOR DR in BUCKNER, KY)
National Pollutant Discharge Elimination System NON-MAJOR (Tracking pollutant discharge elimination systems) - permit Business SIC classification: MANAGEMENT SERVICES
51.0%Electricity
49.8%Utility gas
Population in 1990: 34. Population change in the 1990s: +257 (+755.9%).
Place of birth for U.S.-born residents:
This state: 384
Northeast: 24
Midwest: 55
South: 31
66% of the 40010 zip code residents lived in the same house 5 years ago. Out of people who lived in different houses, 26% lived in this county. Out of people who lived in different counties, 50% lived in Kentucky.
100% of the 40010 zip code residents lived in the same house 1 year ago.
Private vs. public school enrollment:
Students in private schools in grades 1 to 8 (elementary and middle school): 16
Here:
19.3%
Kentucky:
17.2%
Students in private schools in grades 9 to 12 (high school):
Here:
0.0%
Kentucky:
15.2%
Students in private undergraduate colleges: 16
Here:
34.0%
Kentucky:
19.6%
Occupation by median earnings in the past 12 months ($)
171,937Management occupations
61,827Education, training, and library occupations
41,763Business and financial operations occupations
2,357Food preparation and serving related occupations
Companies with federal contracts located in this zip code:
CLEM'S SEAFOOD & SPECIALTIES, (4505 MATTINGLY CT in BUCKNER, KY; small business) : $238,112 in 11 contractsfrom 2004 to 2006
Contracts for Food Items For Resale, Non-Food Items For Resale by Defense Commissary Agency Signed by year:2000: $0; 2001: $0; 2002: $0; 2003: $0; 2004: $64,329; 2005: $122,247; 2006: $51,536.
Biggest contracts:
$58,673 with Defense Commissary Agency for Food Items For Resale. Signed on 2004-10-01. Completion date: 2005-02-28.
$51,536 with Defense Commissary Agency for Non-Food Items For Resale. Signed on 2006-01-01. Completion date: 2006-03-31.
$40,398 with Defense Commissary Agency for Food Items For Resale. Signed on 2005-04-01. Completion date: 2005-08-31.
$28,751 with Defense Commissary Agency for Non-Food Items For Resale. Signed on 2005-10-01. Completion date: 2005-12-31.
PRESENTATION SOLUTIONS, INC (4809 FOX RUN RD in BUCKNER, KY; small business) : $63,515 in 9 contractsfrom 2002 to 2005
Contracts for Radio and Television Communication Equipment, Except Airborne, ADP Support Equipment, ADP Supplies, Photographic Projection Equipment, and moreby Army, U.S. Army Corps of Engineers - civil program financing only Signed by year:2000: $0; 2001: $0; 2002: $25,728; 2003: $26,094; 2004: $3,725; 2005: $7,968; 2006: $0.
Biggest contracts:
$14,624 with Army for Radio and Television Communication Equipment, Except Airborne. Signed on 2003-06-11. Completion date: 2003-07-09.
$11,470, same as above.Signed on 2003-09-10. Completion date: 2003-09-29.
$8,094 with Army for ADP Support Equipment. Signed on 2005-04-04. Completion date: 2005-04-11.
$7,845 with U.S. Army Corps of Engineers - civil program financing only for ADP Supplies. Signed on 2002-08-16. Completion date: 2002-12-02.
TRI-COUNTY FORD-MERCURY, INC (5101 W HWY 146 in BUCKNER, KY) : $3,872 in 2 contractsin 2006
$2,564 with Internal Revenue Service for . Signed on 2006-04-03. Completion date: 2006-04-21.
$1,308, same as above.Signed on 2006-05-11. Effective on 2006-05-03. Completion date: 2006-05-12.
Top industries in this zip code by the number of employees in 2005:
Other Services (except Public Administration): Civic and Social Organizations (100-249 employees: 1 establishment)
Wholesale Trade: Medical, Dental, and Hospital Equipment and Supplies Merchant Wholesalers (100-249: 1)
Construction: Poured Concrete Foundation and Structure Contractors (20-49: 1, 10-19: 1, 1-4: 1)
Other Services (except Public Administration): Commercial and Industrial Machinery and Equipment (except Automotive and Electronic) Repair and Maintenance (20-49: 1)
Wholesale Trade: Other Professional Equipment and Supplies Merchant Wholesalers (20-49: 1)
Home Mortgage Disclosure Act Aggregated Statistics For Year 2009 (Based on 2 partial tracts)
A) FHA, FSA/RHS & VA Home Purchase Loans
B) Conventional Home Purchase Loans
C) Refinancings
D) Home Improvement Loans
F) Non-occupant Loans on < 5 Family Dwellings (A B C & D)
Number
Average Value
Number
Average Value
Number
Average Value
Number
Average Value
Number
Average Value
LOANS ORIGINATED
1
$205,320
7
$256,750
38
$262,898
1
$268,470
1
$162,850
APPLICATIONS APPROVED, NOT ACCEPTED
0
$0
1
$232,000
3
$245,447
0
$0
0
$0
APPLICATIONS DENIED
1
$139,600
1
$261,950
8
$240,411
1
$86,830
0
$0
APPLICATIONS WITHDRAWN
0
$0
1
$261,690
6
$277,448
0
$0
0
$0
FILES CLOSED FOR INCOMPLETENESS
0
$0
0
$0
2
$321,365
0
$0
0
$0
Aggregated Statistics For Year 2008 (Based on 2 partial tracts)
A) FHA, FSA/RHS & VA Home Purchase Loans
B) Conventional Home Purchase Loans
C) Refinancings
D) Home Improvement Loans
F) Non-occupant Loans on < 5 Family Dwellings (A B C & D)
Number
Average Value
Number
Average Value
Number
Average Value
Number
Average Value
Number
Average Value
LOANS ORIGINATED
1
$226,600
8
$269,080
14
$260,182
1
$176,150
1
$281,850
APPLICATIONS APPROVED, NOT ACCEPTED
0
$0
0
$0
2
$231,145
0
$0
0
$0
APPLICATIONS DENIED
0
$0
1
$174,520
5
$196,258
1
$12,360
0
$0
APPLICATIONS WITHDRAWN
0
$0
1
$413,300
4
$220,935
0
$0
0
$0
FILES CLOSED FOR INCOMPLETENESS
0
$0
0
$0
0
$0
0
$0
0
$0
Aggregated Statistics For Year 2007 (Based on 2 partial tracts)
A) FHA, FSA/RHS & VA Home Purchase Loans
B) Conventional Home Purchase Loans
C) Refinancings
D) Home Improvement Loans
F) Non-occupant Loans on < 5 Family Dwellings (A B C & D)
Number
Average Value
Number
Average Value
Number
Average Value
Number
Average Value
Number
Average Value
LOANS ORIGINATED
1
$134,450
14
$255,616
11
$252,635
1
$102,530
1
$362,850
APPLICATIONS APPROVED, NOT ACCEPTED
0
$0
1
$337,280
2
$252,765
0
$0
0
$0
APPLICATIONS DENIED
0
$0
2
$287,815
4
$281,488
0
$0
0
$0
APPLICATIONS WITHDRAWN
0
$0
2
$182,540
2
$385,885
0
$0
0
$0
FILES CLOSED FOR INCOMPLETENESS
0
$0
0
$0
1
$260,750
0
$0
0
$0
Aggregated Statistics For Year 2006 (Based on 2 partial tracts)
B) Conventional Home Purchase Loans
C) Refinancings
D) Home Improvement Loans
F) Non-occupant Loans on < 5 Family Dwellings (A B C & D)
Number
Average Value
Number
Average Value
Number
Average Value
Number
Average Value
LOANS ORIGINATED
16
$247,029
13
$223,324
1
$165,770
1
$338,310
APPLICATIONS APPROVED, NOT ACCEPTED
2
$293,950
2
$284,470
0
$0
0
$0
APPLICATIONS DENIED
2
$224,970
5
$188,914
1
$33,030
0
$0
APPLICATIONS WITHDRAWN
1
$294,120
3
$271,843
0
$0
0
$0
FILES CLOSED FOR INCOMPLETENESS
0
$0
1
$265,720
0
$0
0
$0
Aggregated Statistics For Year 2005 (Based on 2 partial tracts)
B) Conventional Home Purchase Loans
C) Refinancings
D) Home Improvement Loans
F) Non-occupant Loans on < 5 Family Dwellings (A B C & D)
Number
Average Value
Number
Average Value
Number
Average Value
Number
Average Value
LOANS ORIGINATED
15
$263,275
13
$295,132
2
$101,715
1
$216,900
APPLICATIONS APPROVED, NOT ACCEPTED
2
$260,960
2
$309,950
0
$0
0
$0
APPLICATIONS DENIED
1
$266,750
5
$321,476
1
$10,900
0
$0
APPLICATIONS WITHDRAWN
1
$289,400
3
$275,333
0
$0
0
$0
FILES CLOSED FOR INCOMPLETENESS
0
$0
1
$487,430
0
$0
0
$0
Aggregated Statistics For Year 2004 (Based on 2 partial tracts)
B) Conventional Home Purchase Loans
C) Refinancings
D) Home Improvement Loans
F) Non-occupant Loans on < 5 Family Dwellings (A B C & D)
Number
Average Value
Number
Average Value
Number
Average Value
Number
Average Value
LOANS ORIGINATED
16
$266,489
18
$247,304
1
$57,230
1
$115,140
APPLICATIONS APPROVED, NOT ACCEPTED
1
$409,270
1
$482,800
0
$0
0
$0
APPLICATIONS DENIED
1
$315,490
5
$276,534
1
$41,610
0
$0
APPLICATIONS WITHDRAWN
1
$465,720
4
$278,570
0
$0
0
$0
FILES CLOSED FOR INCOMPLETENESS
0
$0
1
$181,980
0
$0
0
$0
Aggregated Statistics For Year 2003 (Based on 2 partial tracts)
B) Conventional Home Purchase Loans
C) Refinancings
D) Home Improvement Loans
F) Non-occupant Loans on < 5 Family Dwellings (A B C & D)
Number
Average Value
Number
Average Value
Number
Average Value
Number
Average Value
LOANS ORIGINATED
14
$249,972
53
$222,340
2
$55,125
1
$311,110
APPLICATIONS APPROVED, NOT ACCEPTED
1
$197,680
4
$220,420
0
$0
0
$0
APPLICATIONS DENIED
1
$129,560
6
$163,507
1
$66,840
0
$0
APPLICATIONS WITHDRAWN
1
$378,460
5
$234,766
0
$0
0
$0
FILES CLOSED FOR INCOMPLETENESS
0
$0
2
$231,745
0
$0
0
$0
Aggregated Statistics For Year 2002 (Based on 2 partial tracts)
A) FHA, FSA/RHS & VA Home Purchase Loans
B) Conventional Home Purchase Loans
C) Refinancings
D) Home Improvement Loans
F) Non-occupant Loans on < 5 Family Dwellings (A B C & D)
Number
Average Value
Number
Average Value
Number
Average Value
Number
Average Value
Number
Average Value
LOANS ORIGINATED
1
$79,790
13
$211,702
42
$235,407
1
$39,900
1
$211,580
APPLICATIONS APPROVED, NOT ACCEPTED
0
$0
0
$0
3
$206,633
0
$0
0
$0
APPLICATIONS DENIED
0
$0
1
$117,720
4
$216,668
0
$0
0
$0
APPLICATIONS WITHDRAWN
0
$0
1
$168,170
4
$213,385
0
$0
0
$0
FILES CLOSED FOR INCOMPLETENESS
0
$0
0
$0
1
$252,250
0
$0
0
$0
Aggregated Statistics For Year 2001 (Based on 2 partial tracts)
B) Conventional Home Purchase Loans
C) Refinancings
D) Home Improvement Loans
F) Non-occupant Loans on < 5 Family Dwellings (A B C & D)
Number
Average Value
Number
Average Value
Number
Average Value
Number
Average Value
LOANS ORIGINATED
11
$227,596
24
$211,179
3
$46,903
1
$185,590
APPLICATIONS APPROVED, NOT ACCEPTED
1
$238,100
2
$197,685
0
$0
0
$0
APPLICATIONS DENIED
1
$176,830
3
$160,933
0
$0
0
$0
APPLICATIONS WITHDRAWN
1
$88,200
3
$218,590
0
$0
0
$0
FILES CLOSED FOR INCOMPLETENESS
0
$0
1
$108,970
0
$0
0
$0
Aggregated Statistics For Year 2000 (Based on 2 partial tracts)
A) FHA, FSA/RHS & VA Home Purchase Loans
B) Conventional Home Purchase Loans
C) Refinancings
D) Home Improvement Loans
F) Non-occupant Loans on < 5 Family Dwellings (A B C & D)
Number
Average Value
Number
Average Value
Number
Average Value
Number
Average Value
Number
Average Value
LOANS ORIGINATED
1
$79,710
10
$219,880
6
$135,350
3
$34,777
1
$138,480
APPLICATIONS APPROVED, NOT ACCEPTED
0
$0
1
$302,190
1
$147,830
0
$0
0
$0
APPLICATIONS DENIED
0
$0
1
$107,940
2
$90,345
1
$16,730
0
$0
APPLICATIONS WITHDRAWN
0
$0
1
$126,730
1
$98,930
0
$0
0
$0
FILES CLOSED FOR INCOMPLETENESS
0
$0
0
$0
0
$0
0
$0
0
$0
Aggregated Statistics For Year 1999 (Based on 1 partial tract)


 Nearest zip codes: 40014, 40056, 40031, 40026, 40245, 40077.


