Estimated zip code population in 2022: 3,413 Zip code population in 2010: 3,263 Zip code population in 2000: 3,257
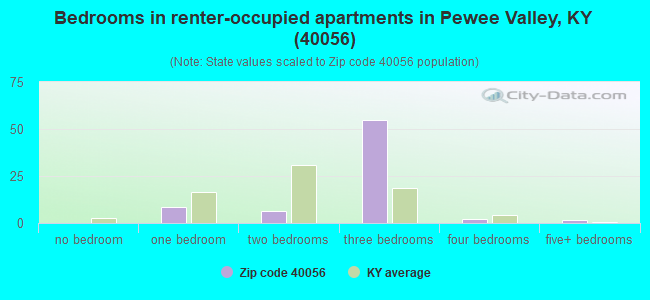
Houses and condos: 1,308 Renter-occupied apartments: 77
% of renters here:
6%
State:
31%
March 2022 cost of living index in zip code 40056: 88.8 (less than average, U.S. average is 100)
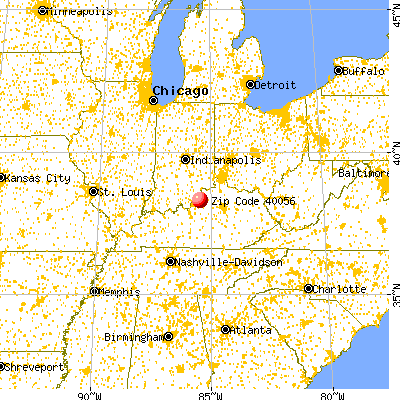
Land area: 2.8 sq. mi. Water area: 0.0 sq. mi.
Population density: 1,199 people per square mile
(low).
OSM Map
General Map
Google Map
MSN Map
OSM Map
General Map
Google Map
MSN Map
OSM Map
General Map
Google Map
MSN Map
OSM Map
General Map
Google Map
MSN Map
Please wait while loading the map...
Real estate property taxes paid for housing units in 2022:
This zip code:
0.9% ($2,822)
Kentucky:
0.7% ($1,456)
Median real estate property taxes paid for housing units with mortgages in 2022: $2,880 (1.0%) Median real estate property taxes paid for housing units with no mortgage in 2022: $2,681 (0.7%)
Business Search- 14 Million verified businesses
Males: 1,715
(50.3%)
Females: 1,697
(49.7%)
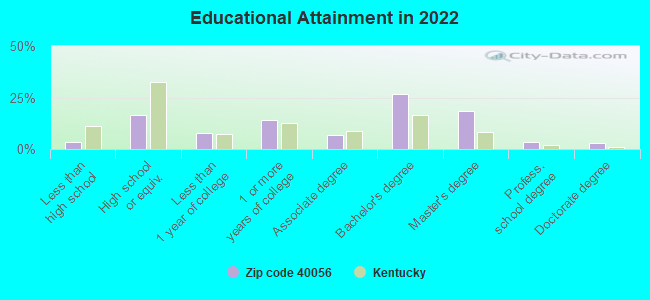
For population 25 years and over in 40056:
High school or higher: 98.5%
Bachelor's degree or higher: 52.3%
Graduate or professional degree: 25.2%
Unemployed: 2.9%
Mean travel time to work (commute): 24.5 minutes
For population 15 years and over in 40056:
Never married: 18.8%
Now married: 66.3%
Separated: 0.1%
Widowed: 5.2%
Divorced: 9.6%
Zip code 40056 compared to state average:
Median household income above state average.
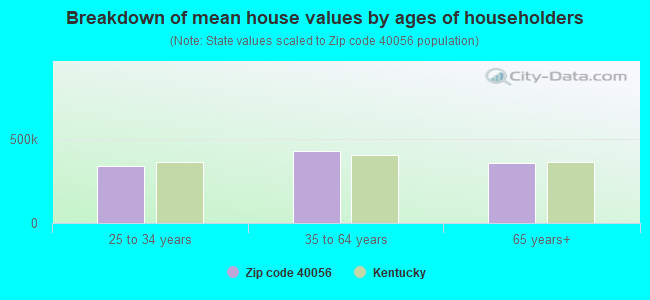
Median house value above state average.
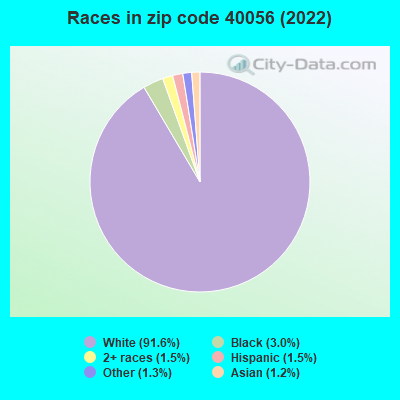
Black race population percentage below state average.
Hispanic race population percentage below state average.
Renting percentage significantly below state average.
Length of stay since moving in significantly above state average.
Percentage of population with a bachelor's degree or higher above state average.
Averages for the 2020 tax year for zip code 40056, filed in 2021:
Average Adjusted Gross Income (AGI) in 2020: $97,325 (Individual Income Tax Returns)
Here:
$97,325
State:
$61,342
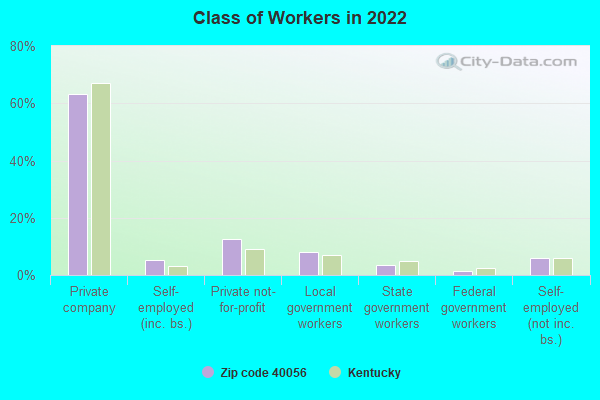
Salary/wage: $75,949 (reported on 82.2% of returns)
Here:
$75,949
State:
$50,827
(% of AGI for various income ranges: 1164.1% for AGIs below $25k, 3880.5% for AGIs $25k-50k, 7408.7% for AGIs $50k-75k, 9112.3% for AGIs $75k-100k, 18730.5% for AGIs $100k-200k, 75596.0% for AGIs over 200k)
Taxable interest for individuals: $1,380 (reported on 35.1% of returns)
This zip code:
$1,380
Kentucky:
$1,441
(% of AGI for various income ranges: 18.8% for AGIs below $25k, 15.9% for AGIs $25k-50k, 31.3% for AGIs $50k-75k, 42.3% for AGIs $75k-100k, 89.5% for AGIs $100k-200k, 950.0% for AGIs over 200k)
Ordinary dividends: $8,243 (reported on 27.0% of returns)
Here:
$8,243
State:
$7,388
(% of AGI for various income ranges: 42.8% for AGIs below $25k, 52.3% for AGIs $25k-50k, 141.3% for AGIs $50k-75k, 130.8% for AGIs $75k-100k, 635.8% for AGIs $100k-200k, 4064.0% for AGIs over 200k)
Net capital gain/loss in AGI: +$30,929 (reported on 24.1% of returns)
Here:
+$30,929
State:
+$19,475
(% of AGI for various income ranges: 13.1% for AGIs below $25k, 26.4% for AGIs $25k-50k, 128.7% for AGIs $50k-75k, 164.6% for AGIs $75k-100k, 746.3% for AGIs $100k-200k, 22130.0% for AGIs over 200k)
Profit/loss from business: +$16,258 (reported on 17.8% of returns)
Here:
+$16,258
State:
+$11,386
(% of AGI for various income ranges: 142.8% for AGIs below $25k, 289.5% for AGIs $25k-50k, 240.0% for AGIs $50k-75k, 267.7% for AGIs $75k-100k, 484.2% for AGIs $100k-200k, 4636.0% for AGIs over 200k)
Taxable individual retirement arrangement distribution: $22,755 (reported on 12.6% of returns)
40056:
$22,755
Kentucky:
$18,941
(% of AGI for various income ranges: 82.5% for AGIs below $25k, 165.5% for AGIs $25k-50k, 321.3% for AGIs $50k-75k, 595.4% for AGIs $75k-100k, 670.5% for AGIs $100k-200k, 3696.0% for AGIs over 200k)
Total itemized deductions: $37,886 (reported on 12.1% of returns)
Here:
$37,886
State:
$32,473
(% of AGI for various income ranges: 1015.3% for AGIs $50k-75k, 1134.2% for AGIs $100k-200k, 8556.0% for AGIs over 200k)
Charity contributions: $15,917 (reported on 10.3% of returns)
Here:
$15,917
State:
$13,472
(% of AGI for various income ranges: 138.7% for AGIs $50k-75k, 399.5% for AGIs $100k-200k, 3796.0% for AGIs over 200k)
Taxes paid: $8,695 (reported on 12.1% of returns)
40056:
$8,695
State:
$7,830
(% of AGI for various income ranges: 250.0% for AGIs $50k-75k, 341.1% for AGIs $100k-200k, 1606.0% for AGIs over 200k)
Earned income credit: $1,981 (reported on 9.2% of returns)
Here:
$1,981
State:
$2,336
(% of AGI for various income ranges: 54.7% for AGIs below $25k, 64.5% for AGIs $25k-50k)
Percentage of individuals using paid preparers for their 2020 taxes: 92.5%
Here:
93%
State:
94%
(% for various income ranges: 89.6% for AGIs below $25k, 90.6% for AGIs $25k-50k, 91.7% for AGIs $50k-75k, 94.7% for AGIs $75k-100k, 94.1% for AGIs $100k-200k, 100.0% for AGIs over 200k)
Averages for the 2012 tax year for zip code 40056, filed in 2013:
Average Adjusted Gross Income (AGI) in 2012: $73,487 (Individual Income Tax Returns)
Here:
$73,487
State:
$50,814
Salary/wage: $62,479 (reported on 84.3% of returns)
Here:
$62,479
State:
$42,723
(% of AGI for various income ranges: 70.8% for AGIs below $25k, 73.3% for AGIs $25k-50k, 71.9% for AGIs $50k-75k, 82.0% for AGIs $75k-100k, 74.6% for AGIs $100k-200k, 65.1% for AGIs over 200k)
Taxable interest for individuals: $1,647 (reported on 36.1% of returns)
This zip code:
$1,647
Kentucky:
$1,381
(% of AGI for various income ranges: 1.3% for AGIs below $25k, 0.3% for AGIs $25k-50k, 0.6% for AGIs $50k-75k, 0.2% for AGIs $75k-100k, 0.9% for AGIs $100k-200k, 1.1% for AGIs over 200k)
Ordinary dividends: $6,821 (reported on 28.3% of returns)
Here:
$6,821
State:
$6,239
(% of AGI for various income ranges: 3.2% for AGIs below $25k, 1.1% for AGIs $25k-50k, 2.5% for AGIs $50k-75k, 0.3% for AGIs $75k-100k, 2.9% for AGIs $100k-200k, 3.7% for AGIs over 200k)
Net capital gain/loss in AGI: +$6,615 (reported on 19.9% of returns)
Here:
+$6,615
State:
+$11,336
(% of AGI for various income ranges: 2.4% for AGIs $100k-200k, 3.5% for AGIs over 200k)
Profit/loss from business: +$16,217 (reported on 17.5% of returns)
Here:
+$16,217
State:
+$10,862
(% of AGI for various income ranges: 8.4% for AGIs below $25k, 4.1% for AGIs $25k-50k, 3.0% for AGIs $50k-75k, 2.4% for AGIs $75k-100k, 3.9% for AGIs $100k-200k, 3.9% for AGIs over 200k)
Taxable individual retirement arrangement distribution: $13,868 (reported on 13.3% of returns)
40056:
$13,868
Kentucky:
$14,296
(% of AGI for various income ranges: 4.2% for AGIs below $25k, 2.5% for AGIs $25k-50k, 3.2% for AGIs $50k-75k, 2.7% for AGIs $75k-100k, 4.8% for AGIs $100k-200k)
Total itemized deductions: $23,684 (20% of AGI, reported on 47.6% of returns)
Here:
$23,684
State:
$21,160
Here:
19.5% of AGI
State:
20.0% of AGI
(% of AGI for various income ranges: 12.6% for AGIs below $25k, 13.7% for AGIs $25k-50k, 16.6% for AGIs $50k-75k, 15.3% for AGIs $75k-100k, 16.8% for AGIs $100k-200k, 14.6% for AGIs over 200k)
Charity contributions: $4,859 (reported on 41.0% of returns)
Here:
$4,859
State:
$4,303
(% of AGI for various income ranges: 1.3% for AGIs below $25k, 1.8% for AGIs $25k-50k, 2.3% for AGIs $50k-75k, 2.1% for AGIs $75k-100k, 2.4% for AGIs $100k-200k, 3.8% for AGIs over 200k)
Taxes paid: $10,252 (reported on 47.6% of returns)
40056:
$10,252
State:
$8,496
(% of AGI for various income ranges: 2.5% for AGIs below $25k, 3.9% for AGIs $25k-50k, 5.6% for AGIs $50k-75k, 6.6% for AGIs $75k-100k, 7.7% for AGIs $100k-200k, 7.7% for AGIs over 200k)
Earned income credit: $2,160 (reported on 12.0% of returns)
Here:
$2,160
State:
$2,273
(% of AGI for various income ranges: 4.8% for AGIs below $25k, 1.0% for AGIs $25k-50k)
Percentage of individuals using paid preparers for their 2012 taxes: 54.8%
Here:
55%
State:
60%
(% for various income ranges: 50.9% for AGIs below $25k, 52.9% for AGIs $25k-50k, 54.2% for AGIs $50k-75k, 52.9% for AGIs $75k-100k, 60.0% for AGIs $100k-200k, 72.7% for AGIs over 200k)
Averages for the 2004 tax year for zip code 40056, filed in 2005:
Average Adjusted Gross Income (AGI) in 2004: $59,863 (Individual Income Tax Returns)
Here:
$59,863
State:
$41,540
Salary/wage: $52,902 (reported on 85.8% of returns)
Here:
$52,902
State:
$36,432
(% of AGI for various income ranges: 86.9% for AGIs below $10k, 77.6% for AGIs $10k-25k, 79.1% for AGIs $25k-50k, 79.9% for AGIs $50k-75k, 81.5% for AGIs $75k-100k, 71.5% for AGIs over 100k)
Taxable interest for individuals: $1,593 (reported on 46.5% of returns)
This zip code:
$1,593
Kentucky:
$1,571
(% of AGI for various income ranges: 3.5% for AGIs below $10k, 2.3% for AGIs $10k-25k, 0.6% for AGIs $25k-50k, 1.3% for AGIs $50k-75k, 1.1% for AGIs $75k-100k, 1.2% for AGIs over 100k)
Taxable dividends: $4,113 (reported on 29.7% of returns)
Here:
$4,113
State:
$3,453
(% of AGI for various income ranges: 2.3% for AGIs below $10k, 2.5% for AGIs $10k-25k, 1.4% for AGIs $25k-50k, 1.1% for AGIs $50k-75k, 1.7% for AGIs $75k-100k, 2.6% for AGIs over 100k)
Net capital gain/loss: +$4,273 (reported on 24.0% of returns)
Here:
+$4,273
State:
+$9,663
(% of AGI for various income ranges: -3.3% for AGIs below $10k, -0.3% for AGIs $10k-25k, -0.1% for AGIs $25k-50k, 1.9% for AGIs $50k-75k, 2.8% for AGIs $75k-100k, 2.2% for AGIs over 100k)
Profit/loss from business: +$15,039 (reported on 17.2% of returns)
Here:
+$15,039
State:
+$9,233
(% of AGI for various income ranges: 6.2% for AGIs below $10k, 5.1% for AGIs $10k-25k, 4.1% for AGIs $25k-50k, 3.3% for AGIs $50k-75k, 3.6% for AGIs $75k-100k, 4.8% for AGIs over 100k)
IRA payment deduction: $3,244 (reported on 2.5% of returns)
40056:
$3,244
Kentucky:
$2,955
Self-employed pension: $14,941 (reported on 1.0% of returns)
Here:
$14,941
Kentucky:
$14,996
Total itemized deductions: $20,335 (21% of AGI, reported on 50.3% of returns)
Here:
$20,335
State:
$17,474
Here:
20.8% of AGI
State:
21.0% of AGI
(% of AGI for various income ranges: 22.2% for AGIs below $10k, 13.9% for AGIs $10k-25k, 15.6% for AGIs $25k-50k, 18.8% for AGIs $50k-75k, 19.9% for AGIs $75k-100k, 16.3% for AGIs over 100k)
Charity contributions deductions: $4,056 (4% of AGI, reported on 46.0% of returns)
Here:
$4,056
State:
$3,494
Here:
4.0% of AGI
State:
4.0% of AGI
(% of AGI for various income ranges: 1.5% for AGIs below $10k, 1.4% for AGIs $10k-25k, 1.8% for AGIs $25k-50k, 2.4% for AGIs $50k-75k, 3.2% for AGIs $75k-100k, 3.9% for AGIs over 100k)
Total tax: $10,196 (reported on 79.0% of returns)
40056:
$10,196
State:
$6,162
(% of AGI for various income ranges: 2.3% for AGIs below $10k, 4.4% for AGIs $10k-25k, 7.0% for AGIs $25k-50k, 8.4% for AGIs $50k-75k, 9.8% for AGIs $75k-100k, 19.3% for AGIs over 100k)
Earned income credit: $1,536 (reported on 10.3% of returns)
Here:
$1,536
State:
$1,723
Percentage of individuals using paid preparers for their 2004 taxes: 57.3%
Here:
57%
State:
66%
(% for various income ranges: 43.3% for AGIs below $10k, 60.5% for AGIs $10k-25k, 55.9% for AGIs $25k-50k, 56.6% for AGIs $50k-75k, 63.4% for AGIs $75k-100k, 70.3% for AGIs over 100k)
Likely homosexual households (counted as self-reported same-sex unmarried-partner households)
Lesbian couples: 0.3% of all households
Gay men: 0.0% of all households
Household received Food Stamps/SNAP in the past 12 months: 9 Household did not receive Food Stamps/SNAP in the past 12 months: 1,238
Women who had a birth in the past 12 months: 35 (23 now married, 11 unmarried) Women who did not have a birth in the past 12 months: 606 (416 now married, 194 unmarried)
Housing units in zip code 40056 with a mortgage: 844 (125 second mortgage, 110 both second mortgage and home equity loan) Houses without a mortgage: 6
Median monthly owner costs for units with a mortgage: $1,565 Median monthly owner costs for units without a mortgage: $556
Residents with income below the poverty level in 2022:
This zip code:
1.0%
Whole state:
16.5%
Residents with income below 50% of the poverty level in 2022:
This zip code:
0.5%
Whole state:
9.0%
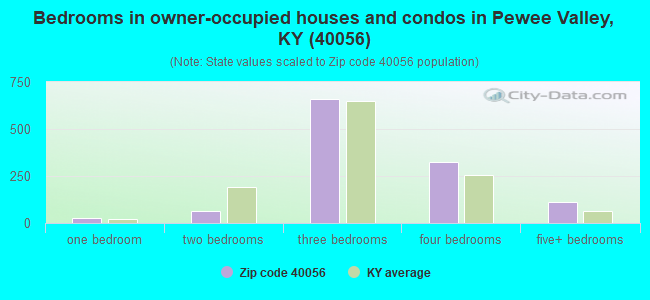
Median number of rooms in houses and condos:
Here:
7.0
State:
6.4
Median number of rooms in apartments:
Here:
5.5
State:
4.4
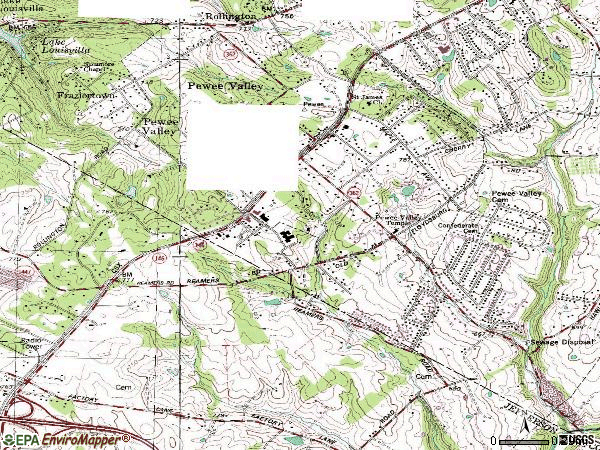
Notable locations in this zip code not listed on our city pages
Churches in zip code 40056 include: Pewee Valley Temple (A), Sycamore Chapel Methodist Church (B), Saint James Episcopal Church (C). Display/hide their locations on the map
In group quarters: 123 (-1 institutionalized population)
Size of family households: 435 2-persons, 213 3-persons, 145 4-persons, 131 5-persons, 24 6-persons, 2 7-or-more-persons
Size of nonfamily households: 288 1-person, 8 2-persons
743 married couples with children.
61 single-parent households (27 men, 34 women).
97.2% of residents of 40056 zip code speak English at home.
1.4% of residents speak other Indo-European language at home (82% very well, 18% well).
1.1% of residents speak Asian or Pacific Island language at home (100% well).
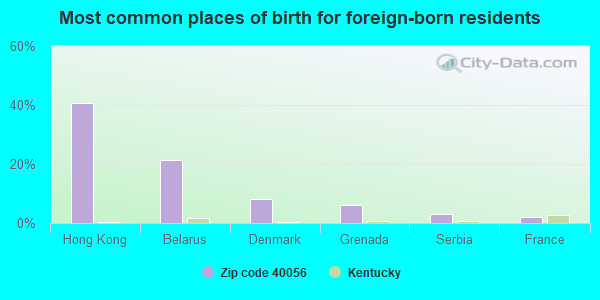
Foreign born population: 98 (2.9%) (78.8% of them are naturalized citizens)
This zip code:
2.9%
Whole state:
4.0%
41%Hong Kong
21%Belarus
8%Denmark
6%Grenada
3%Serbia
2%France
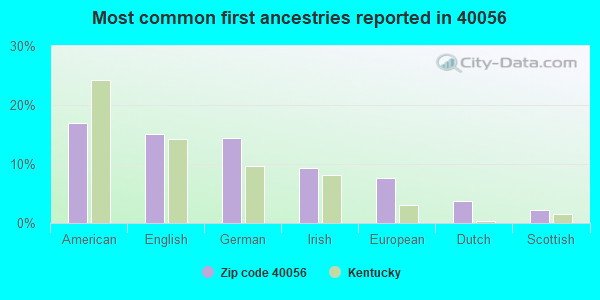
17%American
15%English
14%German
9%Irish
8%European
4%Dutch
2%Scottish
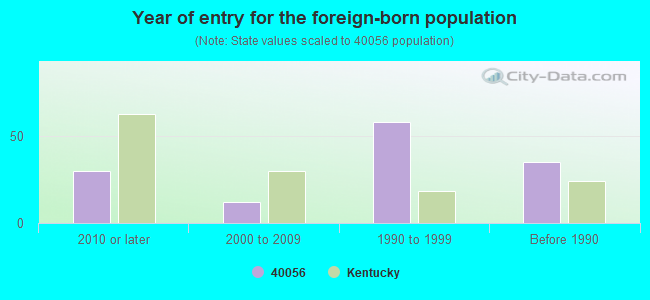
Year of entry for the foreign-born population
302010 or later
122000 to 2009
581990 to 1999
35Before 1990
Facilities with environmental interests located in this zip code:
ASH AVENUE STP (9222 HAWLEY GIBSON RD in PEWEE VALLEY, KY)
National Pollutant Discharge Elimination System NON-MAJOR (Tracking pollutant discharge elimination systems) - permit Business SIC classification: LAND SUBDIVIDERS AND DEVELOPERS, EXCEPT CEMETERIES Alternative names: ASH AVENUE SANITARY SEWER CO, ASH AVENUE SEWER PLANT
BEARD'S GROCERY (309 LAGRANGE RD in PEWEE VALLEY, KY)
(Resource Conservation and Recovery Act (tracking hazardous waste)) Business NAICS classification: OTHER FUEL DEALERS. Organizations: CARL BEARD (CONTACT/OWNER)
FRIENDSHIP MANOR NURSING HOME (7400 W HWY 146 in PEWEE VALLEY, KY)
National Pollutant Discharge Elimination System NON-MAJOR (Tracking pollutant discharge elimination systems) - permit Business SIC classification: SKILLED NURSING CARE FACILITIES
KJC INSTITUTE FOR WOMEN (3000 ASH AVE in PEWEE VALLEY, KY)
National Pollutant Discharge Elimination System NON-MAJOR (Tracking pollutant discharge elimination systems) - permit Business SIC classification: CORRECTIONAL INSTITUTIONS
PEWEE VALLEY VOCATIONAL SCHOOL (HWY 362 in PEWEE VALLEY, KY)
Conditionally Exempt Small Quantity Generators, less than 100 kg/month of hazardous waste (Resource Conservation and Recovery Act (tracking hazardous waste)) - notification Business NAICS classification: OTHER TECHNICAL AND TRADE SCHOOLS. Organizations: COMMONWEALTH OF KENTUCKY (CONTACT/OWNER)
PEEWEE VALLEY VOCATIONAL SCHOOL (PO BOX 297 in PEEWEE VALLEY, KY)
COMPLIANCE ACTIVITY (Tracking inspections of insecticide, fungicide, and rodenticide, and toxic substances)
Housing units lacking complete plumbing facilities: 1.2% Housing units lacking complete kitchen facilities: 2.6%
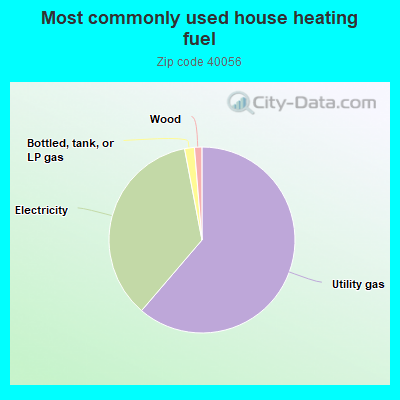
61.4%Utility gas
35.8%Electricity
1.7%Bottled, tank, or LP gas
1.3%Wood
Population in 1990: 2,622. Population change in the 1990s: +635 (+24.2%).
Place of birth for U.S.-born residents:
This state: 1,976
Northeast: 98
Midwest: 515
South: 534
West: 168
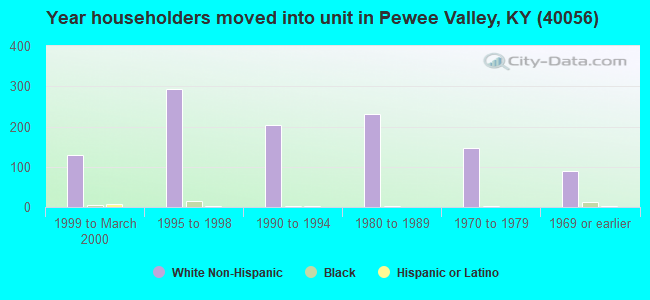
63% of the 40056 zip code residents lived in the same house 5 years ago. Out of people who lived in different houses, 32% lived in this county. Out of people who lived in different counties, 50% lived in Kentucky.
94% of the 40056 zip code residents lived in the same house 1 year ago. Out of people who lived in different houses, 54% moved from this county. Out of people who lived in different houses, 29% moved from different county within same state. Out of people who lived in different houses, 9% moved from different state. Out of people who lived in different houses, 10% moved from abroad.
Private vs. public school enrollment:
Students in private schools in grades 1 to 8 (elementary and middle school): 46
Here:
11.1%
Kentucky:
17.2%
Students in private schools in grades 9 to 12 (high school): 56
Here:
35.8%
Kentucky:
15.2%
Students in private undergraduate colleges: 91
Here:
77.1%
Kentucky:
19.6%
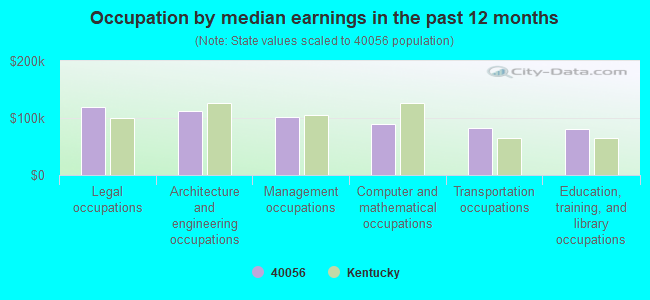
Occupation by median earnings in the past 12 months ($)
120,169Legal occupations
112,667Architecture and engineering occupations
102,424Management occupations
89,605Computer and mathematical occupations
82,726Transportation occupations
80,036Education, training, and library occupations
Top industries in this zip code by the number of employees in 2005:
Health Care and Social Assistance: Nursing Care Facilities (100-249 employees: 1 establishment)
Educational Services: Elementary and Secondary Schools (50-99: 1)
Other Services (except Public Administration): Religious Organizations (20-49: 1, 1-4: 3)
Other Services (except Public Administration): Car Washes (20-49: 1)
Professional, Scientific, and Technical Services: Veterinary Services (20-49: 1)
Other Services (except Public Administration): Labor Unions and Similar Labor Organizations (20-49: 1)
Information: Internet Publishing and Broadcasting (20-49: 1)
Health Care and Social Assistance: Child Day Care Services (10-19: 1, 1-4: 1)
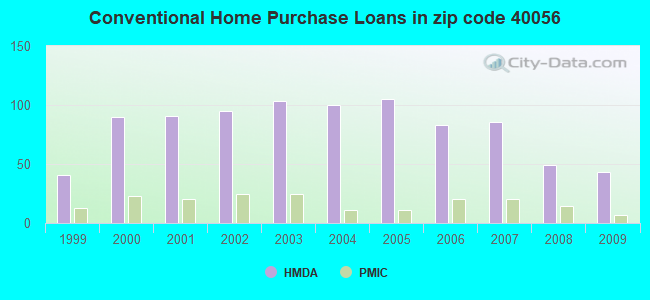
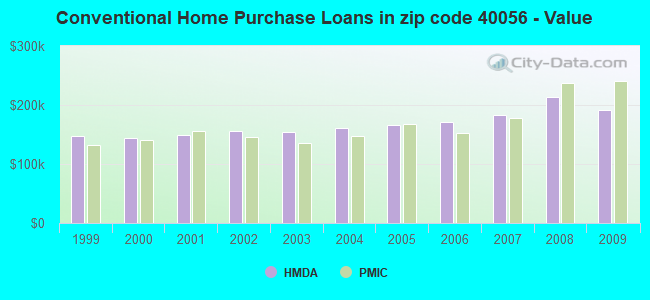
Detailed PMIC statistics for the following Tracts:0305.01
, 0306.01
2002 - 2018 National Fire Incident Reporting System (NFIRS) incidents
Based on the data from the years 2002 - 2018 the average number of fires per year is 6. The highest number of reported fire incidents - 23 took place in 2017, and the least - 0 in 2005. The data has a declining trend.
When looking into fire subcategories, the most incidents belonged to: Outside Fires (57.5%), and Structure Fires (28.3%).
Fire incident types reported to NFIRS in Zip Code 40056


 Nearest zip codes: 40245, 40223, 40014, 40010, 40243, 40241.


 Based on the data from the years 2002 - 2018 the average number of fires per year is 6. The highest number of reported fire incidents - 23 took place in 2017, and the least - 0 in 2005. The data has a declining trend.
 When looking into fire subcategories, the most incidents belonged to: Outside Fires (57.5%), and Structure Fires (28.3%).