Estimated zip code population in 2022: 2,925 Zip code population in 2010: 2,838 Zip code population in 2000: 2,688
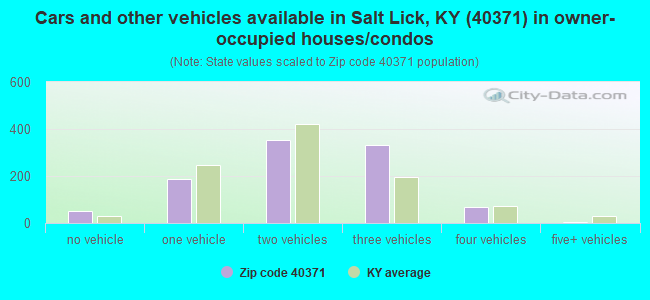
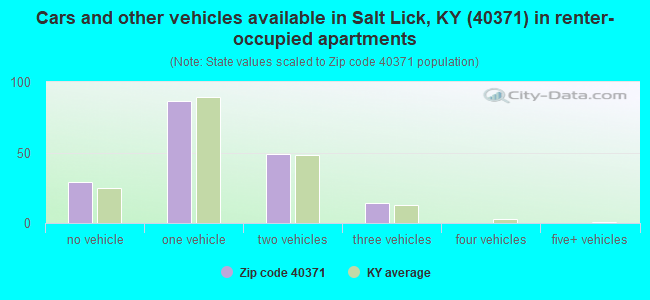
Houses and condos: 1,329 Renter-occupied apartments: 179
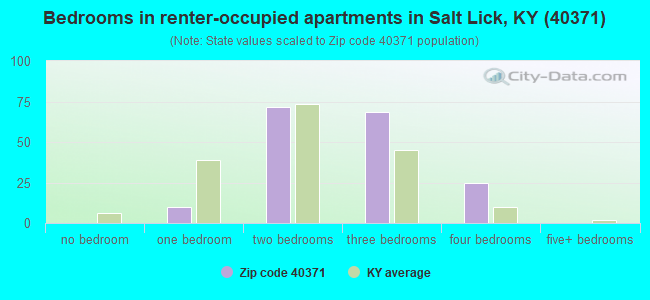
% of renters here:
15%
State:
31%
March 2022 cost of living index in zip code 40371: 80.6 (low, U.S. average is 100)
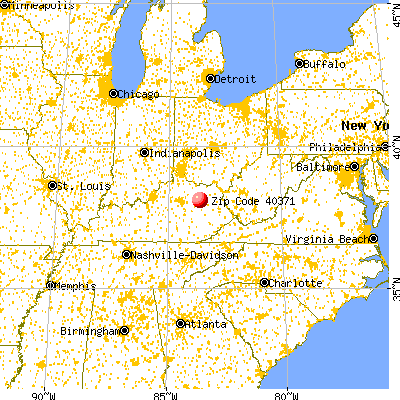
Land area: 74.3 sq. mi. Water area: 5.0 sq. mi.
Population density: 39 people per square mile
(very low).
OSM Map
General Map
Google Map
MSN Map
OSM Map
General Map
Google Map
MSN Map
OSM Map
General Map
Google Map
MSN Map
OSM Map
General Map
Google Map
MSN Map
Please wait while loading the map...
Real estate property taxes paid for housing units in 2022:
This zip code:
1.0% ($909)
Kentucky:
0.7% ($1,456)
Median real estate property taxes paid for housing units with mortgages in 2022: $1,065 (0.6%) Median real estate property taxes paid for housing units with no mortgage in 2022: $663 (0.9%)
Business Search- 14 Million verified businesses
Males: 1,490
(51.0%)
Females: 1,434
(49.0%)
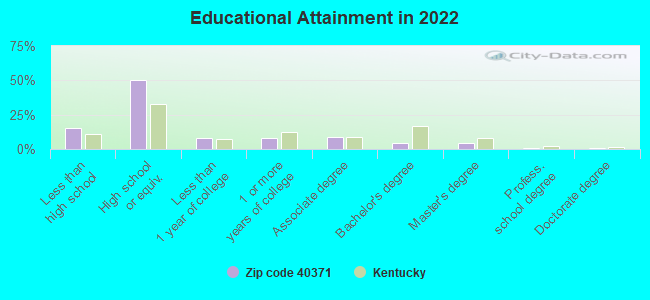
For population 25 years and over in 40371:
High school or higher: 83.4%
Bachelor's degree or higher: 9.9%
Graduate or professional degree: 5.7%
Unemployed: 1.9%
Mean travel time to work (commute): 39.3 minutes
For population 15 years and over in 40371:
Never married: 23.4%
Now married: 55.8%
Separated: 1.0%
Widowed: 5.6%
Divorced: 14.3%
Zip code 40371 compared to state average:
Median house value below state average.
Unemployed percentage below state average.
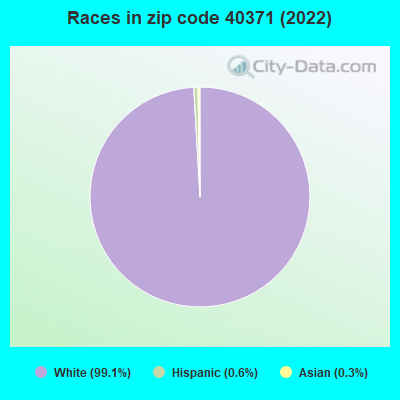
Black race population percentage significantly below state average.
Hispanic race population percentage significantly below state average.
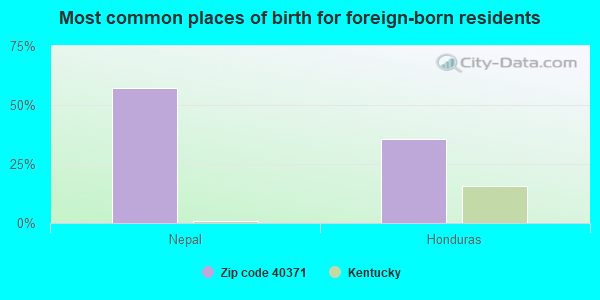
Foreign-born population percentage significantly below state average.
Renting percentage below state average.
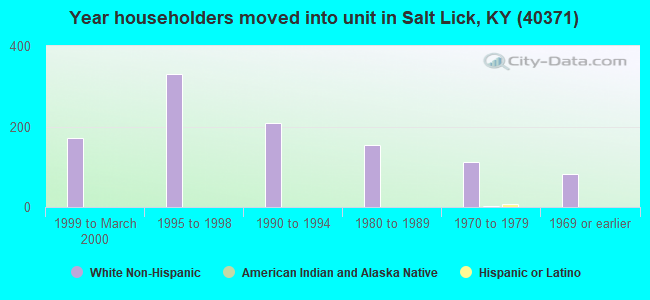
Length of stay since moving in significantly above state average.
House age below state average.
Number of college students below state average.
Percentage of population with a bachelor's degree or higher significantly below state average.
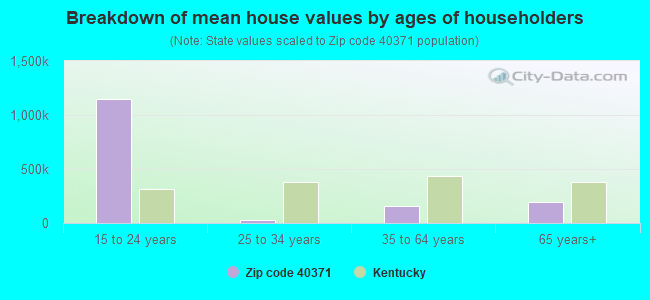
Estimated median house/condo value in 2022: $95,156
40371:
$95,156
Kentucky:
$196,300
According to our research of Kentucky and other state lists, there were 7 registered sex offenders living in 40371 zip code as of May 28, 2024. The ratio of all residents to sex offenders in zip code 40371 is 467 to 1. The ratio of registered sex offenders to all residents in this zip code is near the state average.
Median resident age:
This zip code:
38.4 years
Kentucky median age:
39.4 years
Average household size:
This zip code:
2.5 people
Kentucky:
2.4 people
Averages for the 2020 tax year for zip code 40371, filed in 2021:
Average Adjusted Gross Income (AGI) in 2020: $40,857 (Individual Income Tax Returns)
Here:
$40,857
State:
$61,342
Salary/wage: $37,893 (reported on 82.4% of returns)
Here:
$37,893
State:
$50,827
(% of AGI for various income ranges: 1116.1% for AGIs below $25k, 3331.5% for AGIs $25k-50k, 6244.6% for AGIs $50k-75k, 10188.3% for AGIs $75k-100k, 17872.5% for AGIs $100k-200k)
Taxable interest for individuals: $733 (reported on 19.4% of returns)
This zip code:
$733
Kentucky:
$1,441
(% of AGI for various income ranges: 6.7% for AGIs below $25k, 21.2% for AGIs $25k-50k, 43.8% for AGIs $50k-75k, 10.0% for AGIs $75k-100k, 35.0% for AGIs $100k-200k)
Ordinary dividends: $1,150 (reported on 3.7% of returns)
Here:
$1,150
State:
$7,388
(% of AGI for various income ranges: 35.4% for AGIs $50k-75k)
Net capital gain/loss in AGI: +$4,980 (reported on 4.6% of returns)
Here:
+$4,980
State:
+$19,475
(% of AGI for various income ranges: 35.8% for AGIs below $25k, 218.3% for AGIs $75k-100k)
Profit/loss from business: +$2,781 (reported on 14.8% of returns)
Here:
+$2,781
State:
+$11,386
(% of AGI for various income ranges: 103.6% for AGIs below $25k, 15.8% for AGIs $25k-50k, 36.2% for AGIs $50k-75k, 25.0% for AGIs $75k-100k)
Taxable individual retirement arrangement distribution: $9,280 (reported on 4.6% of returns)
40371:
$9,280
Kentucky:
$18,941
(% of AGI for various income ranges: 65.8% for AGIs below $25k, 190.0% for AGIs $50k-75k)
Earned income credit: $2,441 (reported on 26.9% of returns)
Here:
$2,441
State:
$2,336
(% of AGI for various income ranges: 143.9% for AGIs below $25k, 89.6% for AGIs $25k-50k)
Percentage of individuals using paid preparers for their 2020 taxes: 99.1%
Here:
99%
State:
94%
(% for various income ranges: 97.7% for AGIs below $25k, 100.0% for AGIs $25k-50k, 100.0% for AGIs $50k-75k, 100.0% for AGIs $75k-100k, 100.0% for AGIs $100k-200k)
Averages for the 2012 tax year for zip code 40371, filed in 2013:
Average Adjusted Gross Income (AGI) in 2012: $36,017 (Individual Income Tax Returns)
Here:
$36,017
State:
$50,814
Salary/wage: $33,216 (reported on 84.2% of returns)
Here:
$33,216
State:
$42,723
(% of AGI for various income ranges: 74.0% for AGIs below $25k, 85.0% for AGIs $25k-50k, 75.8% for AGIs $50k-75k, 79.7% for AGIs $75k-100k, 69.6% for AGIs $100k-200k)
Taxable interest for individuals: $716 (reported on 18.8% of returns)
This zip code:
$716
Kentucky:
$1,381
(% of AGI for various income ranges: 0.3% for AGIs below $25k, 0.7% for AGIs $25k-50k, 0.4% for AGIs $50k-75k, 0.3% for AGIs $100k-200k)
Ordinary dividends: $1,275 (reported on 4.0% of returns)
Here:
$1,275
State:
$6,239
Net capital gain/loss in AGI: +$2,000 (reported on 6.9% of returns)
Here:
+$2,000
State:
+$11,336
Profit/loss from business: +$4,294 (reported on 16.8% of returns)
Here:
+$4,294
State:
+$10,862
(% of AGI for various income ranges: 10.4% for AGIs below $25k, 1.1% for AGIs $25k-50k)
Taxable individual retirement arrangement distribution: $8,933 (reported on 3.0% of returns)
40371:
$8,933
Kentucky:
$14,296
Total itemized deductions: $16,744 (23% of AGI, reported on 17.8% of returns)
Here:
$16,744
State:
$21,160
Here:
23.1% of AGI
State:
20.0% of AGI
(% of AGI for various income ranges: 7.6% for AGIs $25k-50k, 8.6% for AGIs $50k-75k, 11.5% for AGIs $75k-100k, 13.9% for AGIs $100k-200k)
Charity contributions: $3,200 (reported on 10.9% of returns)
Here:
$3,200
State:
$4,303
(% of AGI for various income ranges: 0.5% for AGIs $25k-50k, 1.0% for AGIs $50k-75k, 1.3% for AGIs $75k-100k, 2.3% for AGIs $100k-200k)
Taxes paid: $5,317 (reported on 17.8% of returns)
40371:
$5,317
State:
$8,496
(% of AGI for various income ranges: 1.6% for AGIs $25k-50k, 2.4% for AGIs $50k-75k, 3.9% for AGIs $75k-100k, 5.9% for AGIs $100k-200k)
Earned income credit: $2,591 (reported on 31.7% of returns)
Here:
$2,591
State:
$2,273
(% of AGI for various income ranges: 10.5% for AGIs below $25k, 1.9% for AGIs $25k-50k)
Percentage of individuals using paid preparers for their 2012 taxes: 77.2%
Here:
77%
State:
60%
(% for various income ranges: 75.0% for AGIs below $25k, 77.8% for AGIs $25k-50k, 84.6% for AGIs $50k-75k, 75.0% for AGIs $75k-100k, 80.0% for AGIs $100k-200k)
Averages for the 2004 tax year for zip code 40371, filed in 2005:
Average Adjusted Gross Income (AGI) in 2004: $29,724 (Individual Income Tax Returns)
Here:
$29,724
State:
$41,540
Salary/wage: $27,836 (reported on 87.3% of returns)
Here:
$27,836
State:
$36,432
(% of AGI for various income ranges: 88.9% for AGIs below $10k, 79.0% for AGIs $10k-25k, 83.7% for AGIs $25k-50k, 89.1% for AGIs $50k-75k, 83.2% for AGIs $75k-100k, 48.2% for AGIs over 100k)
Taxable interest for individuals: $772 (reported on 29.8% of returns)
This zip code:
$772
Kentucky:
$1,571
(% of AGI for various income ranges: 3.6% for AGIs below $10k, 1.0% for AGIs $10k-25k, 0.7% for AGIs $25k-50k, 0.5% for AGIs $50k-75k, 0.4% for AGIs $75k-100k, 0.9% for AGIs over 100k)
Taxable dividends: $171 (reported on 3.5% of returns)
Here:
$171
State:
$3,453
Net capital gain/loss: +$4,700 (reported on 6.0% of returns)
Here:
+$4,700
State:
+$9,663
(% of AGI for various income ranges: -0.2% for AGIs $10k-25k, 1.4% for AGIs $25k-50k, 0.1% for AGIs $50k-75k, 3.9% for AGIs $75k-100k)
Profit/loss from business: +$4,762 (reported on 18.5% of returns)
Here:
+$4,762
State:
+$9,233
(% of AGI for various income ranges: 5.2% for AGIs below $10k, 6.6% for AGIs $10k-25k, 4.5% for AGIs $25k-50k, 0.2% for AGIs $50k-75k, 0.7% for AGIs $75k-100k)
Total itemized deductions: $13,449 (24% of AGI, reported on 17.6% of returns)
Here:
$13,449
State:
$17,474
Here:
24.0% of AGI
State:
21.0% of AGI
(% of AGI for various income ranges: 4.2% for AGIs $10k-25k, 7.1% for AGIs $25k-50k, 9.6% for AGIs $50k-75k, 12.7% for AGIs $75k-100k, 10.2% for AGIs over 100k)
Charity contributions deductions: $2,035 (3% of AGI, reported on 11.5% of returns)
Here:
$2,035
State:
$3,494
Here:
3.2% of AGI
State:
4.0% of AGI
Total tax: $3,192 (reported on 68.4% of returns)
40371:
$3,192
State:
$6,162
(% of AGI for various income ranges: 3.3% for AGIs below $10k, 4.1% for AGIs $10k-25k, 5.8% for AGIs $25k-50k, 8.7% for AGIs $50k-75k, 9.5% for AGIs $75k-100k, 15.4% for AGIs over 100k)
Earned income credit: $1,594 (reported on 26.6% of returns)
Here:
$1,594
State:
$1,723
Percentage of individuals using paid preparers for their 2004 taxes: 82.9%
Here:
83%
State:
66%
(% for various income ranges: 82.6% for AGIs below $10k, 82.6% for AGIs $10k-25k, 84.4% for AGIs $25k-50k, 81.7% for AGIs $50k-75k, 78.7% for AGIs $75k-100k, 88.2% for AGIs over 100k)
Likely homosexual households (counted as self-reported same-sex unmarried-partner households)
Lesbian couples: 0.3% of all households
Gay men: 0.0% of all households
Household received Food Stamps/SNAP in the past 12 months: 246 Household did not receive Food Stamps/SNAP in the past 12 months: 927
Women who had a birth in the past 12 months: 19 (0 now married, 20 unmarried) Women who did not have a birth in the past 12 months: 540 (323 now married, 218 unmarried)
Housing units in zip code 40371 with a mortgage: 533 (43 second mortgage, 2 home equity loan, 41 both second mortgage and home equity loan) Median monthly owner costs for units with a mortgage: $1,103 Median monthly owner costs for units without a mortgage: $338
Residents with income below the poverty level in 2022:
This zip code:
24.2%
Whole state:
16.5%
Residents with income below 50% of the poverty level in 2022:
This zip code:
14.5%
Whole state:
9.0%
Median number of rooms in houses and condos:
Here:
6.2
State:
6.4
Median number of rooms in apartments:
Here:
4.8
State:
4.4
Notable locations in this zip code not listed on our city pages
Notable locations in zip code 40371: Mud Lick Youth Camp (A), Tailwater Picnic Area and Boat Launch (B), Clear Creek Furnace Picnic Area (C), Moores Ferry (D), Salt Lick Fire Department (E). Display/hide their locations on the map
Churches in zip code 40371 include: Polksville Church of God (A), Polksville Christian Church (B), Midland Church of God (C), Mud Lick Church (D), Hedrick Church (E), Upper Salt Lick Christian Church (F). Display/hide their locations on the map
Cemeteries: Ingram-Stevens Cemetery (1), Jones Cemetery (2), Polksville Cemetery (3), Slaty Point Cemetery (4), Dickerson Cemetery (5). Display/hide their locations on the map
Streams, rivers, and creeks: Caney Creek (A), Carrington Branch (B), Chalybeate Branch (C), Clark Fork (D), Claylick Branch (E), Clear Creek (F), Cow Creek (G), Crooked Run (H), Graveyard Branch (I). Display/hide their locations on the map
(Resource Conservation and Recovery Act (tracking hazardous waste)) Organizations: JOHN W MCCLAIN (CONTACT/OWNER)
Housing units lacking complete plumbing facilities: 6.2% Housing units lacking complete kitchen facilities: 5.6%
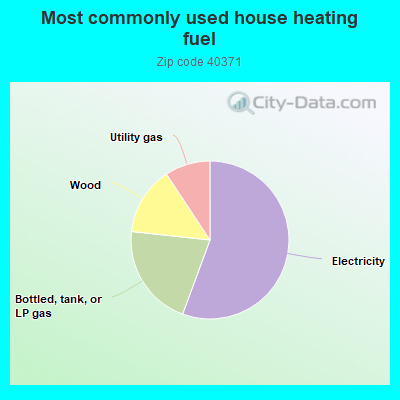
55.7%Electricity
21.1%Bottled, tank, or LP gas
14.0%Wood
9.3%Utility gas
Population in 1990: 2,687. Population change in the 1990s: +1 (+0.0%).
Place of birth for U.S.-born residents:
This state: 2,410
Northeast: 13
Midwest: 412
South: 42
West: 9
64% of the 40371 zip code residents lived in the same house 5 years ago. Out of people who lived in different houses, 47% lived in this county. Out of people who lived in different counties, 50% lived in Kentucky.
94% of the 40371 zip code residents lived in the same house 1 year ago. Out of people who lived in different houses, 11% moved from this county. Out of people who lived in different houses, 89% moved from different county within same state. Out of people who lived in different houses, 3% moved from different state.
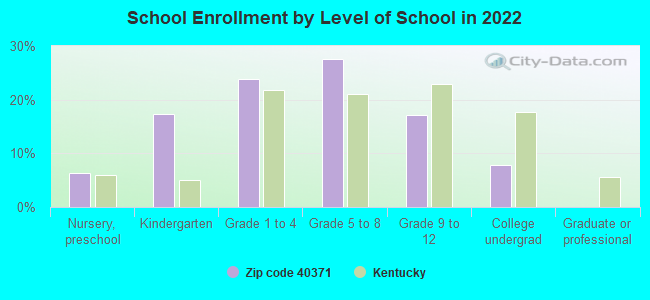
Private vs. public school enrollment:
Students in private schools in grades 1 to 8 (elementary and middle school): 65
Here:
18.2%
Kentucky:
17.2%
Students in private schools in grades 9 to 12 (high school): 59
Here:
45.9%
Kentucky:
15.2%
Students in private undergraduate colleges:
Here:
0.0%
Kentucky:
19.6%
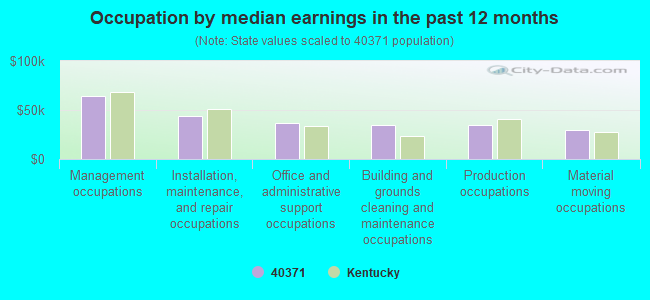
Occupation by median earnings in the past 12 months ($)
64,400Management occupations
43,936Installation, maintenance, and repair occupations
36,932Office and administrative support occupations
35,056Building and grounds cleaning and maintenance occupations
34,350Production occupations
29,720Material moving occupations
Top industries in this zip code by the number of employees in 2005:
Accommodation and Food Services: Snack and Nonalcoholic Beverage Bars (10-19: 1)
Finance and Insurance: Commercial Banking (10-19: 1)
Construction: Water and Sewer Line and Related Structures Construction (10-19: 1)
Real Estate and Rental and Leasing: Residential Property Managers (5-9: 1)
Fatal accident statistics in 2012:
Fatal accident count: 1
Vehicles involved in fatal accidents: 1
Fatal accidents caused by drunken drivers: 0
Fatalities: 1
Persons involved in fatal accidents: 1
Pedestrians involved in fatal accidents: 0
Fatal accident statistics in 2011:
Fatal accident count: 1
Vehicles involved in fatal accidents: 1
Fatal accidents caused by drunken drivers: 1
Fatalities: 1
Persons involved in fatal accidents: 2
Pedestrians involved in fatal accidents: 0
2002 - 2018 National Fire Incident Reporting System (NFIRS) incidents
Based on the data from the years 2002 - 2018 the average number of fires per year is 16. The highest number of reported fire incidents - 32 took place in 2014, and the least - 0 in 2003. The data has a growing trend.
When looking into fire subcategories, the most reports belonged to: Structure Fires (42.1%), and Outside Fires (36.4%).
Fire incident types reported to NFIRS in Zip Code 40371


 Nearest zip codes: 40358, 40316, 40322, 41049, 40387, 40351.
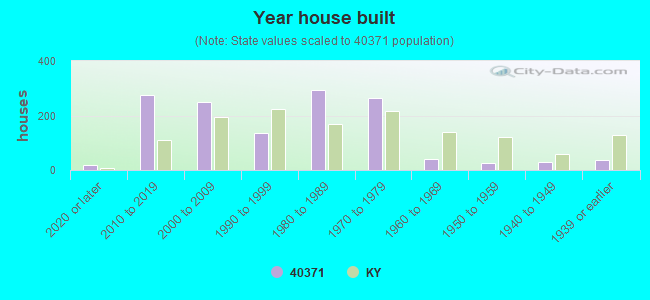


 Based on the data from the years 2002 - 2018 the average number of fires per year is 16. The highest number of reported fire incidents - 32 took place in 2014, and the least - 0 in 2003. The data has a growing trend.
 When looking into fire subcategories, the most reports belonged to: Structure Fires (42.1%), and Outside Fires (36.4%).