Estimated zip code population in 2022: 1,844 Zip code population in 2010: 2,046 Zip code population in 2000: 1,837
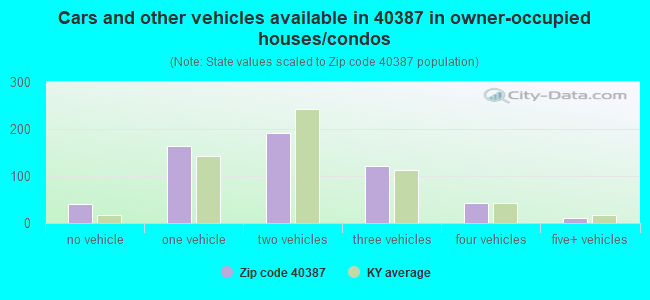
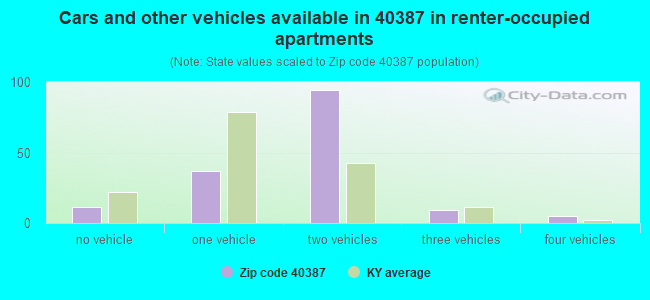
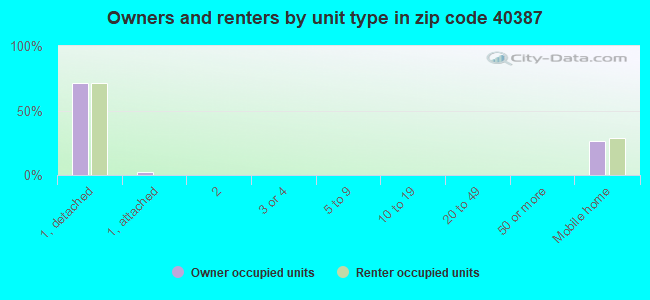
Houses and condos: 1,478 Renter-occupied apartments: 160
% of renters here:
22%
State:
31%
March 2022 cost of living index in zip code 40387: 80.7 (low, U.S. average is 100)
Land area: 72.3 sq. mi. Water area: 1.6 sq. mi.
Population density: 25 people per square mile
(very low).
OSM Map
General Map
Google Map
MSN Map
OSM Map
General Map
Google Map
MSN Map
OSM Map
General Map
Google Map
MSN Map
OSM Map
General Map
Google Map
MSN Map
Please wait while loading the map...
Real estate property taxes paid for housing units in 2022:
This zip code:
0.6% ($671)
Kentucky:
0.7% ($1,456)
Median real estate property taxes paid for housing units with mortgages in 2022: $817 (0.7%) Median real estate property taxes paid for housing units with no mortgage in 2022: $581 (0.6%)
Business Search- 14 Million verified businesses
Males: 1,087
(59.0%)
Females: 756
(41.0%)
For population 25 years and over in 40387:
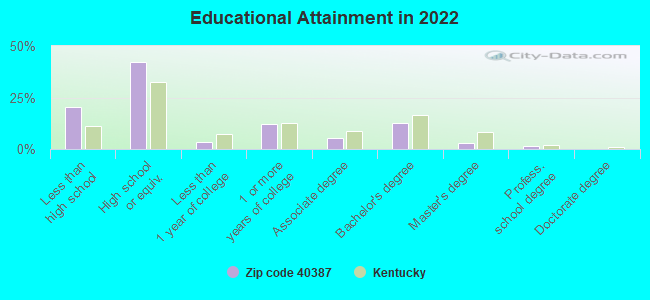
High school or higher: 77.9%
Bachelor's degree or higher: 16.2%
Graduate or professional degree: 4.0%
Unemployed: 2.3%
Mean travel time to work (commute): 44.1 minutes
For population 15 years and over in 40387:
Never married: 27.2%
Now married: 52.8%
Separated: 0.0%
Widowed: 5.2%
Divorced: 14.9%
Zip code 40387 compared to state average:
Median household income below state average.
Median house value below state average.
Unemployed percentage below state average.
Black race population percentage significantly below state average.
Median age above state average.
Foreign-born population percentage significantly below state average.
Length of stay since moving in significantly above state average.
Averages for the 2020 tax year for zip code 40387, filed in 2021:
Average Adjusted Gross Income (AGI) in 2020: $37,271 (Individual Income Tax Returns)
Here:
$37,271
State:
$61,342
Salary/wage: $36,380 (reported on 74.0% of returns)
Here:
$36,380
State:
$50,827
(% of AGI for various income ranges: 959.6% for AGIs below $25k, 3362.0% for AGIs $25k-50k, 6938.3% for AGIs $50k-75k, 5170.0% for AGIs $75k-100k)
Taxable interest for individuals: $344 (reported on 21.9% of returns)
This zip code:
$344
Kentucky:
$1,441
(% of AGI for various income ranges: 8.8% for AGIs below $25k, 5.0% for AGIs $25k-50k, 5.0% for AGIs $50k-75k, 33.3% for AGIs $75k-100k)
Ordinary dividends: $1,467 (reported on 4.1% of returns)
Here:
$1,467
State:
$7,388
(% of AGI for various income ranges: 22.0% for AGIs $25k-50k)
Net capital gain/loss in AGI: +$4,133 (reported on 4.1% of returns)
Here:
+$4,133
State:
+$19,475
(% of AGI for various income ranges: 206.7% for AGIs $50k-75k)
Profit/loss from business: +$5,209 (reported on 15.1% of returns)
Here:
+$5,209
State:
+$11,386
(% of AGI for various income ranges: 188.4% for AGIs below $25k, 51.0% for AGIs $25k-50k)
Taxable individual retirement arrangement distribution: $7,067 (reported on 4.1% of returns)
40387:
$7,067
Kentucky:
$18,941
(% of AGI for various income ranges: 84.8% for AGIs below $25k)
Earned income credit: $2,681 (reported on 28.8% of returns)
Here:
$2,681
State:
$2,336
(% of AGI for various income ranges: 149.6% for AGIs below $25k, 94.5% for AGIs $25k-50k)
Percentage of individuals using paid preparers for their 2020 taxes: 95.9%
Here:
96%
State:
94%
(% for various income ranges: 97.0% for AGIs below $25k, 95.7% for AGIs $25k-50k, 100.0% for AGIs $50k-75k, 100.0% for AGIs $75k-100k, 75.0% for AGIs $100k-200k)
Averages for the 2012 tax year for zip code 40387, filed in 2013:
Average Adjusted Gross Income (AGI) in 2012: $30,851 (Individual Income Tax Returns)
Here:
$30,851
State:
$50,814
Salary/wage: $30,277 (reported on 80.0% of returns)
Here:
$30,277
State:
$42,723
(% of AGI for various income ranges: 71.4% for AGIs below $25k, 81.9% for AGIs $25k-50k, 82.1% for AGIs $50k-75k, 76.5% for AGIs $75k-100k)
Taxable interest for individuals: $406 (reported on 26.2% of returns)
This zip code:
$406
Kentucky:
$1,381
(% of AGI for various income ranges: 0.7% for AGIs below $25k, 0.4% for AGIs $25k-50k, 0.3% for AGIs $50k-75k)
Ordinary dividends: $167 (reported on 4.6% of returns)
Here:
$167
State:
$6,239
Net capital gain/loss in AGI: +$3,871 (reported on 10.8% of returns)
Here:
+$3,871
State:
+$11,336
Profit/loss from business: +$4,627 (reported on 16.9% of returns)
Here:
+$4,627
State:
+$10,862
Taxable individual retirement arrangement distribution: $7,575 (reported on 6.2% of returns)
40387:
$7,575
Kentucky:
$14,296
Total itemized deductions: $17,930 (31% of AGI, reported on 15.4% of returns)
Here:
$17,930
State:
$21,160
Here:
31.1% of AGI
State:
20.0% of AGI
(% of AGI for various income ranges: 12.9% for AGIs $25k-50k, 9.8% for AGIs $50k-75k, 10.2% for AGIs $75k-100k)
Charity contributions: $1,267 (reported on 9.2% of returns)
Here:
$1,267
State:
$4,303
Taxes paid: $4,260 (reported on 15.4% of returns)
40387:
$4,260
State:
$8,496
(% of AGI for various income ranges: 2.0% for AGIs $25k-50k, 2.6% for AGIs $50k-75k, 3.6% for AGIs $75k-100k)
Earned income credit: $2,427 (reported on 33.8% of returns)
Here:
$2,427
State:
$2,273
(% of AGI for various income ranges: 10.3% for AGIs below $25k, 1.7% for AGIs $25k-50k)
Percentage of individuals using paid preparers for their 2012 taxes: 80.0%
Here:
80%
State:
60%
(% for various income ranges: 79.4% for AGIs below $25k, 78.9% for AGIs $25k-50k, 85.7% for AGIs $50k-75k, 80.0% for AGIs $75k-100k)
Averages for the 2004 tax year for zip code 40387, filed in 2005:
Average Adjusted Gross Income (AGI) in 2004: $24,407 (Individual Income Tax Returns)
Here:
$24,407
State:
$41,540
Salary/wage: $24,857 (reported on 78.3% of returns)
Here:
$24,857
State:
$36,432
(% of AGI for various income ranges: 75.3% for AGIs below $10k, 72.6% for AGIs $10k-25k, 84.1% for AGIs $25k-50k, 101.7% for AGIs $50k-75k)
Taxable interest for individuals: $870 (reported on 29.3% of returns)
This zip code:
$870
Kentucky:
$1,571
(% of AGI for various income ranges: 3.8% for AGIs below $10k, 2.3% for AGIs $10k-25k, 0.6% for AGIs $25k-50k, 0.3% for AGIs $50k-75k)
Taxable dividends: $480 (reported on 7.6% of returns)
Here:
$480
State:
$3,453
Net capital gain/loss: +$3,854 (reported on 6.2% of returns)
Here:
+$3,854
State:
+$9,663
Profit/loss from business: +$3,007 (reported on 20.6% of returns)
Here:
+$3,007
State:
+$9,233
Total itemized deductions: $13,138 (27% of AGI, reported on 13.2% of returns)
Here:
$13,138
State:
$17,474
Here:
27.4% of AGI
State:
21.0% of AGI
Charity contributions deductions: $1,727 (3% of AGI, reported on 8.3% of returns)
Here:
$1,727
State:
$3,494
Here:
3.3% of AGI
State:
4.0% of AGI
Total tax: $2,243 (reported on 66.9% of returns)
40387:
$2,243
State:
$6,162
(% of AGI for various income ranges: 4.4% for AGIs below $10k, 3.8% for AGIs $10k-25k, 5.5% for AGIs $25k-50k, 8.2% for AGIs $50k-75k, 11.1% for AGIs $75k-100k)
Earned income credit: $1,688 (reported on 29.1% of returns)
Here:
$1,688
State:
$1,723
Percentage of individuals using paid preparers for their 2004 taxes: 81.9%
Here:
82%
State:
66%
(% for various income ranges: 84.8% for AGIs below $10k, 83.5% for AGIs $10k-25k, 76.2% for AGIs $25k-50k, 95.8% for AGIs $50k-75k)
Household received Food Stamps/SNAP in the past 12 months: 135 Household did not receive Food Stamps/SNAP in the past 12 months: 596
Women who did not have a birth in the past 12 months: 281 (191 now married, 92 unmarried)
Housing units in zip code 40387 with a mortgage: 251 (14 second mortgage) Median monthly owner costs for units with a mortgage: $842 Median monthly owner costs for units without a mortgage: $344
Residents with income below the poverty level in 2022:
This zip code:
21.9%
Whole state:
16.5%
Residents with income below 50% of the poverty level in 2022:
This zip code:
16.6%
Whole state:
9.0%
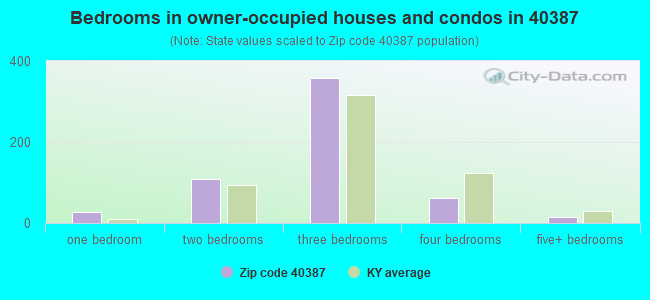
Median number of rooms in houses and condos:
Here:
5.7
State:
6.4
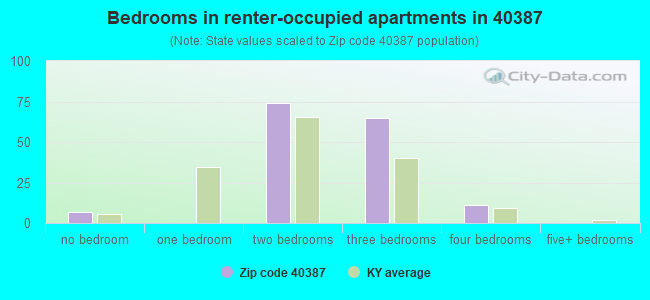
Median number of rooms in apartments:
Here:
4.8
State:
4.4
Notable locations in this zip code not listed on our city pages
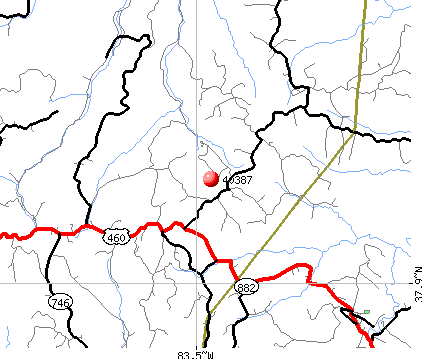
Notable locations in zip code 40387: Camp Judy Layne (A), Botts Ford (B), Gladie Creek Gorge (C), Big Woods Fire Department (D). Display/hide their locations on the map
Churches in zip code 40387 include: Flat Rock Church (A), Pomeroyton Union Church (B), Korea Church of God (C), Dan Ridge Church (D), Pine Branch Baptist Church (E). Display/hide their locations on the map
Cemeteries: Bryant Cemetery (1), Mann Cemetery (2), Lyons Cemetery (3), Lovelace Cemetery (4), Johnson Cemetery (5), Higgins Cemetery (6), Goad Cemetery (7). Display/hide their locations on the map
Streams, rivers, and creeks: Cane Branch (A), Carpenter Branch (B), Cave Branch (C), Cold Cave Creek (D), Copperas Creek (E), Devil Creek (F), Dry Fork (G), Elm Log Branch (H), Flaxseed Branch (I). Display/hide their locations on the map
Size of family households: 240 2-persons, 107 3-persons, 82 4-persons, 14 5-persons
Size of nonfamily households: 253 1-person, 36 2-persons
206 married couples with children.
6 single-parent households (6 men).
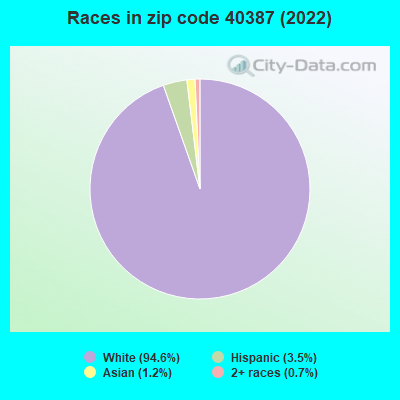
96.5% of residents of 40387 zip code speak English at home.
3.5% of residents speak Spanish at home (100% very well).
Foreign born population: 0 (0.0%)
:
0.0%
Whole state:
4.0%
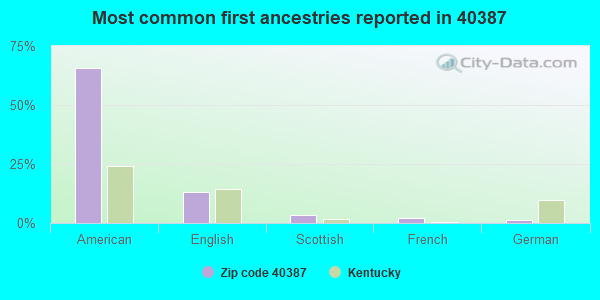
65%American
13%English
3%Scottish
2%French
1%German
Facilities with environmental interests located in this zip code:
CAVE RUN WTP (7533 HWY 1693 in WELLINGTON, KY)
National Pollutant Discharge Elimination System NON-MAJOR (Tracking pollutant discharge elimination systems) - permit Business SIC classification: WATER SUPPLY Alternative names: CAVE RUN WATER COMMISSION WTP
POMEROYTON-D. BOONE NATIONAL FOREST DRUM (HIGHWAY 746 SOUTH in POMEROYTON, KY)
Housing units lacking complete plumbing facilities: 1.7% Housing units lacking complete kitchen facilities: 2.0%
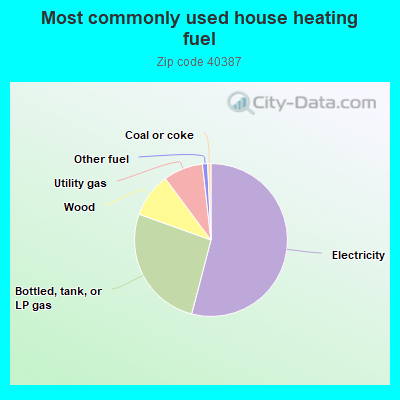
54.3%Electricity
26.5%Bottled, tank, or LP gas
9.4%Wood
8.4%Utility gas
1.1%Other fuel
0.7%Coal or coke
Population in 1990: 501. Population change in the 1990s: +1,336 (+266.7%).
Place of birth for U.S.-born residents:
This state: 1,403
Northeast: 16
Midwest: 246
South: 156
West: 13
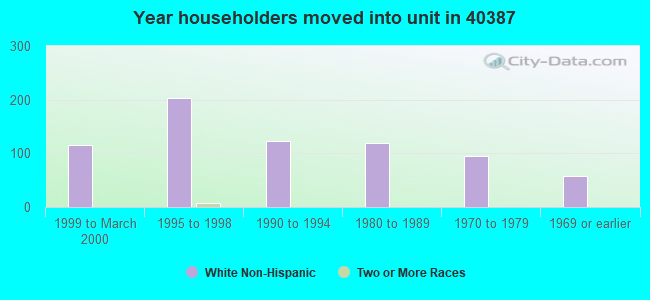
58% of the 40387 zip code residents lived in the same house 5 years ago. Out of people who lived in different houses, 36% lived in this county. Out of people who lived in different counties, 50% lived in Kentucky.
96% of the 40387 zip code residents lived in the same house 1 year ago. Out of people who lived in different houses, 60% moved from this county. Out of people who lived in different houses, 21% moved from different county within same state. Out of people who lived in different houses, 21% moved from different state.
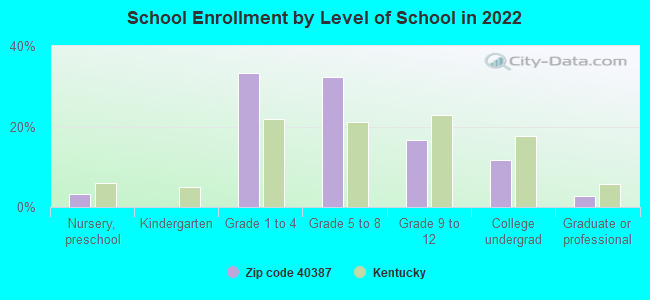
Private vs. public school enrollment:
Students in private schools in grades 1 to 8 (elementary and middle school):
Here:
0.0%
Kentucky:
17.2%
Students in private schools in grades 9 to 12 (high school): 2
Here:
5.5%
Kentucky:
15.2%
Students in private undergraduate colleges:
Here:
0.0%
Kentucky:
19.6%
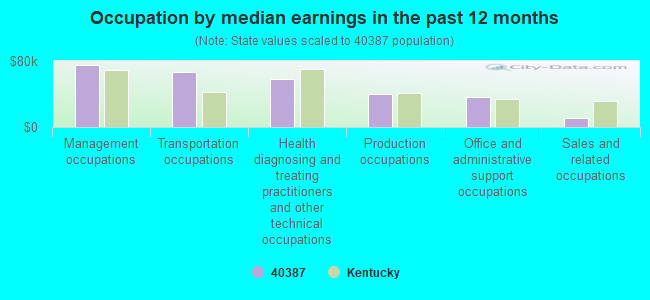
Occupation by median earnings in the past 12 months ($)
75,513Management occupations
66,322Transportation occupations
58,273Health diagnosing and treating practitioners and other technical occupations
39,429Production occupations
36,822Office and administrative support occupations
10,935Sales and related occupations
Companies with federal contracts located in this zip code:
A-1 LAWN SERVICE INC (HC 75 BOX 3925 in WELLINGTON, KY; small business) : $369,479 in 21 contractsfrom 2002 to 2006
Contracts for Landscaping/Groundskeeping Services by Army, U.S. Army Corps of Engineers - civil program financing only Signed by year:2000: $0; 2001: $0; 2002: $38,649; 2003: $193,984; 2004: $96,454; 2005: -$1,458; 2006: $41,850.
Biggest contracts:
$49,065 with Army for Landscaping/Groundskeeping Services. Signed on 2003-12-11. Completion date: 2002-12-31.
$49,065 with U.S. Army Corps of Engineers - civil program financing only for Landscaping/Groundskeeping Services. Signed on 2003-12-11. Completion date: 2002-12-31.
$41,850 with Army for Landscaping/Groundskeeping Services. Signed on 2006-01-13. Completion date: 2006-12-31.
$41,125, same as above.Signed on 2004-12-28. Completion date: 2002-09-17.
Top industries in this zip code by the number of employees in 2005:
Professional, Scientific, and Technical Services: Other Accounting Services (5-9 employees: 1 establishment)
Administrative and Support and Waste Management and Remediation Services: Landscaping Services (1-4: 2)
Construction: New Single-Family Housing Construction (except Operative Builders) (1-4: 1)
Other Services (except Public Administration): Civic and Social Organizations (1-4: 1)
Construction: Masonry Contractors (1-4: 1)
People in group quarters in 2010:
6 people in correctional facilities intended for juveniles
Fatal accident statistics in 2010:
Fatal accident count: 1
Vehicles involved in fatal accidents: 1
Fatal accidents caused by drunken drivers: 0
Fatalities: 1
Persons involved in fatal accidents: 3
Pedestrians involved in fatal accidents: 0
2009 - 2018 National Fire Incident Reporting System (NFIRS) incidents
Based on the data from the years 2009 - 2018 the average number of fire incidents per year is 14. The highest number of reported fire incidents - 25 took place in 2009, and the least - 7 in 2018. The data has a decreasing trend.
When looking into fire subcategories, the most incidents belonged to: Structure Fires (42.4%), and Outside Fires (36.7%).
Fire incident types reported to NFIRS in Zip Code 40387

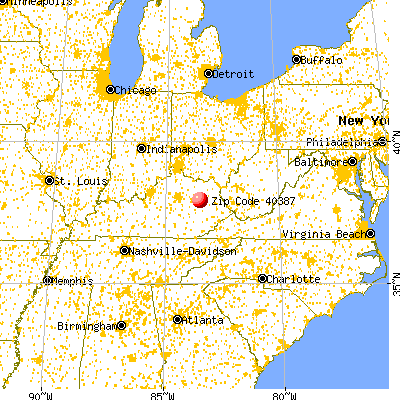


 Nearest zip codes: 40316, 41425, 40322, 41332, 41360, 40371.
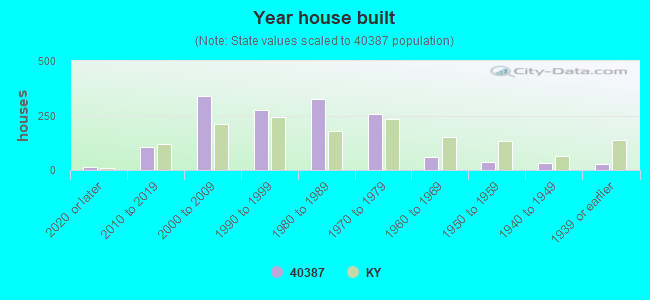


 Based on the data from the years 2009 - 2018 the average number of fire incidents per year is 14. The highest number of reported fire incidents - 25 took place in 2009, and the least - 7 in 2018. The data has a decreasing trend.
 When looking into fire subcategories, the most incidents belonged to: Structure Fires (42.4%), and Outside Fires (36.7%).