Estimated zip code population in 2022: 2,353 Zip code population in 2010: 2,092 Zip code population in 2000: 2,066
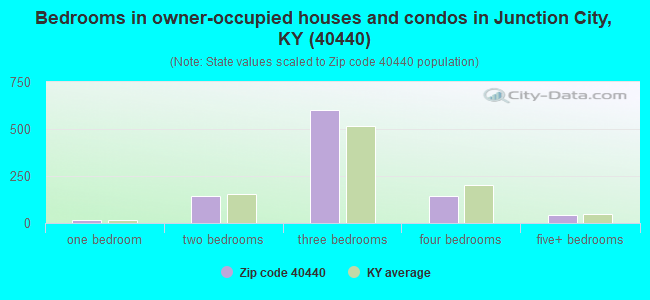
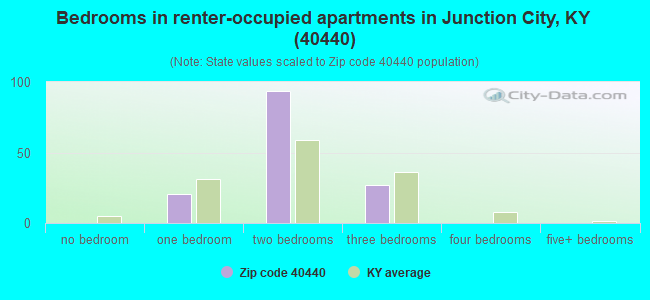
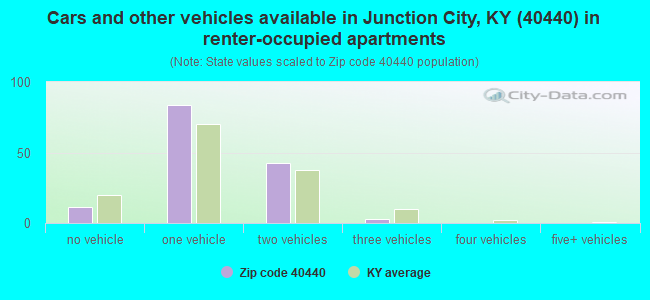
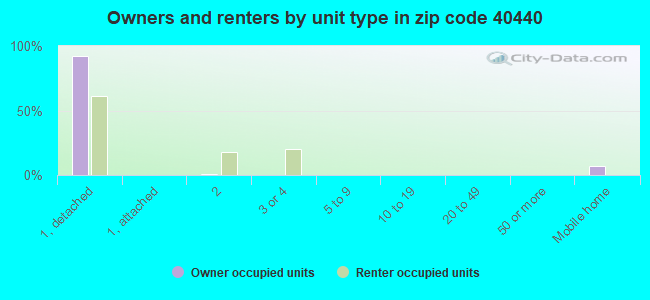
Houses and condos: 1,194 Renter-occupied apartments: 139
% of renters here:
13%
State:
31%
March 2022 cost of living index in zip code 40440: 79.3 (low, U.S. average is 100)
Land area: 9.2 sq. mi. Water area: 0.0 sq. mi.
Population density: 254 people per square mile
(very low).
OSM Map
General Map
Google Map
MSN Map
OSM Map
General Map
Google Map
MSN Map
OSM Map
General Map
Google Map
MSN Map
OSM Map
General Map
Google Map
MSN Map
Please wait while loading the map...
Real estate property taxes paid for housing units in 2022:
This zip code:
0.9% ($1,169)
Kentucky:
0.7% ($1,456)
Median real estate property taxes paid for housing units with mortgages in 2022: $1,162 (0.8%) Median real estate property taxes paid for housing units with no mortgage in 2022: $1,172 (0.9%)
Business Search- 14 Million verified businesses
Males: 1,120
(47.6%)
Females: 1,233
(52.4%)
For population 25 years and over in 40440:
High school or higher: 93.7%
Bachelor's degree or higher: 18.7%
Graduate or professional degree: 4.3%
Unemployed: 6.5%
Mean travel time to work (commute): 33.9 minutes
For population 15 years and over in 40440:
Never married: 20.2%
Now married: 56.2%
Separated: 0.2%
Widowed: 9.9%
Divorced: 13.4%
Zip code 40440 compared to state average:
Black race population percentage significantly below state average.
Median age above state average.
Renting percentage significantly below state average.
Length of stay since moving in below state average.
Estimated median house/condo value in 2022: $136,745
40440:
$136,745
Kentucky:
$196,300
According to our research of Kentucky and other state lists, there were 3 registered sex offenders living in 40440 zip code as of May 28, 2024. The ratio of all residents to sex offenders in zip code 40440 is 728 to 1. The ratio of registered sex offenders to all residents in this zip code is lower than the state average.
Median resident age:
This zip code:
44.4 years
Kentucky median age:
39.4 years
Average household size:
This zip code:
2.2 people
Kentucky:
2.4 people
Averages for the 2020 tax year for zip code 40440, filed in 2021:
Average Adjusted Gross Income (AGI) in 2020: $41,850 (Individual Income Tax Returns)
Here:
$41,850
State:
$61,342
Salary/wage: $37,158 (reported on 83.2% of returns)
Here:
$37,158
State:
$50,827
(% of AGI for various income ranges: 1124.3% for AGIs below $25k, 3454.3% for AGIs $25k-50k, 5868.5% for AGIs $50k-75k, 9096.7% for AGIs $75k-100k, 17020.0% for AGIs $100k-200k)
Taxable interest for individuals: $269 (reported on 12.9% of returns)
This zip code:
$269
Kentucky:
$1,441
(% of AGI for various income ranges: 2.7% for AGIs below $25k, 7.0% for AGIs $25k-50k, 18.3% for AGIs $75k-100k)
Ordinary dividends: $814 (reported on 6.9% of returns)
Here:
$814
State:
$7,388
(% of AGI for various income ranges: 17.8% for AGIs $25k-50k, 26.7% for AGIs $75k-100k)
Net capital gain/loss in AGI: +$2,450 (reported on 5.9% of returns)
Here:
+$2,450
State:
+$19,475
(% of AGI for various income ranges: 29.6% for AGIs $25k-50k, 131.7% for AGIs $75k-100k)
Profit/loss from business: +$7,321 (reported on 13.9% of returns)
Here:
+$7,321
State:
+$11,386
(% of AGI for various income ranges: 130.3% for AGIs below $25k, 148.3% for AGIs $25k-50k, 62.3% for AGIs $50k-75k, 353.3% for AGIs $75k-100k)
Taxable individual retirement arrangement distribution: $15,217 (reported on 5.9% of returns)
40440:
$15,217
Kentucky:
$18,941
(% of AGI for various income ranges: 82.0% for AGIs below $25k, 513.1% for AGIs $50k-75k)
Earned income credit: $2,256 (reported on 24.8% of returns)
Here:
$2,256
State:
$2,336
(% of AGI for various income ranges: 125.7% for AGIs below $25k, 81.3% for AGIs $25k-50k)
Percentage of individuals using paid preparers for their 2020 taxes: 95.0%
Here:
95%
State:
94%
(% for various income ranges: 92.5% for AGIs below $25k, 100.0% for AGIs $25k-50k, 94.1% for AGIs $50k-75k, 100.0% for AGIs $75k-100k, 87.5% for AGIs $100k-200k)
Averages for the 2012 tax year for zip code 40440, filed in 2013:
Average Adjusted Gross Income (AGI) in 2012: $33,657 (Individual Income Tax Returns)
Here:
$33,657
State:
$50,814
Salary/wage: $31,765 (reported on 86.6% of returns)
Here:
$31,765
State:
$42,723
(% of AGI for various income ranges: 74.3% for AGIs below $25k, 84.5% for AGIs $25k-50k, 87.8% for AGIs $50k-75k, 78.5% for AGIs $75k-100k, 78.7% for AGIs $100k-200k)
Taxable interest for individuals: $456 (reported on 16.5% of returns)
This zip code:
$456
Kentucky:
$1,381
(% of AGI for various income ranges: 0.7% for AGIs below $25k, 0.1% for AGIs $25k-50k, 0.2% for AGIs $50k-75k, 0.1% for AGIs $75k-100k)
Ordinary dividends: $833 (reported on 6.2% of returns)
Here:
$833
State:
$6,239
(% of AGI for various income ranges: 0.5% for AGIs below $25k, 0.2% for AGIs $50k-75k)
Net capital gain/loss in AGI: +$1,200 (reported on 7.2% of returns)
Here:
+$1,200
State:
+$11,336
(% of AGI for various income ranges: 0.4% for AGIs below $25k, 0.2% for AGIs $25k-50k, 0.5% for AGIs $50k-75k)
Profit/loss from business: +$5,412 (reported on 16.5% of returns)
Here:
+$5,412
State:
+$10,862
(% of AGI for various income ranges: 7.9% for AGIs below $25k, 2.4% for AGIs $25k-50k, 1.7% for AGIs $50k-75k)
Taxable individual retirement arrangement distribution: $8,817 (reported on 6.2% of returns)
40440:
$8,817
Kentucky:
$14,296
(% of AGI for various income ranges: 1.7% for AGIs below $25k, 1.1% for AGIs $25k-50k, 3.9% for AGIs $50k-75k)
Total itemized deductions: $14,719 (24% of AGI, reported on 16.5% of returns)
Here:
$14,719
State:
$21,160
Here:
24.1% of AGI
State:
20.0% of AGI
(% of AGI for various income ranges: 8.9% for AGIs $25k-50k, 6.9% for AGIs $50k-75k, 9.2% for AGIs $75k-100k, 13.5% for AGIs $100k-200k)
Charity contributions: $2,380 (reported on 10.3% of returns)
Here:
$2,380
State:
$4,303
(% of AGI for various income ranges: 1.3% for AGIs $25k-50k, 2.1% for AGIs $75k-100k)
Taxes paid: $4,900 (reported on 16.5% of returns)
40440:
$4,900
State:
$8,496
(% of AGI for various income ranges: 2.2% for AGIs $25k-50k, 2.1% for AGIs $50k-75k, 3.9% for AGIs $75k-100k, 5.6% for AGIs $100k-200k)
Earned income credit: $2,311 (reported on 28.9% of returns)
Here:
$2,311
State:
$2,273
(% of AGI for various income ranges: 7.8% for AGIs below $25k, 1.6% for AGIs $25k-50k)
Percentage of individuals using paid preparers for their 2012 taxes: 70.1%
Here:
70%
State:
60%
(% for various income ranges: 68.8% for AGIs below $25k, 70.4% for AGIs $25k-50k, 76.9% for AGIs $50k-75k, 66.7% for AGIs $75k-100k, 66.7% for AGIs $100k-200k)
Averages for the 2004 tax year for zip code 40440, filed in 2005:
Average Adjusted Gross Income (AGI) in 2004: $25,989 (Individual Income Tax Returns)
Here:
$25,989
State:
$41,540
Salary/wage: $25,581 (reported on 87.9% of returns)
Here:
$25,581
State:
$36,432
(% of AGI for various income ranges: 121.6% for AGIs below $10k, 80.4% for AGIs $10k-25k, 87.6% for AGIs $25k-50k, 87.9% for AGIs $50k-75k, 81.8% for AGIs $75k-100k)
Taxable interest for individuals: $723 (reported on 24.9% of returns)
This zip code:
$723
Kentucky:
$1,571
(% of AGI for various income ranges: 2.9% for AGIs below $10k, 0.9% for AGIs $10k-25k, 0.8% for AGIs $25k-50k, 0.4% for AGIs $50k-75k, 0.2% for AGIs $75k-100k)
Taxable dividends: $768 (reported on 6.3% of returns)
Here:
$768
State:
$3,453
Net capital gain/loss: +$698 (reported on 5.8% of returns)
Here:
+$698
State:
+$9,663
Profit/loss from business: +$4,395 (reported on 14.9% of returns)
Here:
+$4,395
State:
+$9,233
(% of AGI for various income ranges: 12.9% for AGIs below $10k, 5.4% for AGIs $10k-25k, 2.1% for AGIs $25k-50k, 0.8% for AGIs $50k-75k)
Total itemized deductions: $11,990 (25% of AGI, reported on 17.8% of returns)
Here:
$11,990
State:
$17,474
Here:
24.7% of AGI
State:
21.0% of AGI
(% of AGI for various income ranges: 4.1% for AGIs $10k-25k, 6.7% for AGIs $25k-50k, 12.1% for AGIs $50k-75k, 14.3% for AGIs $75k-100k)
Charity contributions deductions: $1,817 (3% of AGI, reported on 10.6% of returns)
Here:
$1,817
State:
$3,494
Here:
3.5% of AGI
State:
4.0% of AGI
(% of AGI for various income ranges: 0.3% for AGIs $10k-25k, 0.4% for AGIs $25k-50k, 1.2% for AGIs $50k-75k, 1.8% for AGIs $75k-100k)
Total tax: $2,399 (reported on 69.7% of returns)
40440:
$2,399
State:
$6,162
(% of AGI for various income ranges: 4.5% for AGIs below $10k, 4.1% for AGIs $10k-25k, 5.5% for AGIs $25k-50k, 8.0% for AGIs $50k-75k, 11.1% for AGIs $75k-100k)
Earned income credit: $1,652 (reported on 28.7% of returns)
Here:
$1,652
State:
$1,723
Percentage of individuals using paid preparers for their 2004 taxes: 81.3%
Here:
81%
State:
66%
(% for various income ranges: 78.8% for AGIs below $10k, 80.4% for AGIs $10k-25k, 84.9% for AGIs $25k-50k, 81.4% for AGIs $50k-75k, 75.8% for AGIs $75k-100k)
Household received Food Stamps/SNAP in the past 12 months: 222 Household did not receive Food Stamps/SNAP in the past 12 months: 855
Women who had a birth in the past 12 months: 34 (26 now married, 7 unmarried) Women who did not have a birth in the past 12 months: 524 (320 now married, 205 unmarried)
Housing units in zip code 40440 with a mortgage: 564 (36 second mortgage, 17 both second mortgage and home equity loan) Houses without a mortgage: 20
Median monthly owner costs for units with a mortgage: $1,048 Median monthly owner costs for units without a mortgage: $382
Residents with income below the poverty level in 2022:
This zip code:
23.0%
Whole state:
16.5%
Residents with income below 50% of the poverty level in 2022:
This zip code:
11.3%
Whole state:
9.0%
Median number of rooms in houses and condos:
Here:
5.8
State:
6.4
Median number of rooms in apartments:
Here:
4.5
State:
4.4
Notable locations in this zip code not listed on our city pages
Notable locations in zip code 40440: Knob Lick (A), Persimmon Grove (B), Junction City Volunteer Fire Department (C). Display/hide their locations on the map
In group quarters: 11 (-1 institutionalized population)
Size of family households: 242 2-persons, 282 3-persons, 101 4-persons, 70 5-persons, 7 6-persons
Size of nonfamily households: 348 1-person, 24 2-persons, 3 3-persons
294 married couples with children.
74 single-parent households (12 men, 62 women).
94.6% of residents of 40440 zip code speak English at home.
4.3% of residents speak Spanish at home (70% very well, 30% well).
0.2% of residents speak other Indo-European language at home (100% very well).
0.8% of residents speak other language at home (100% very well).
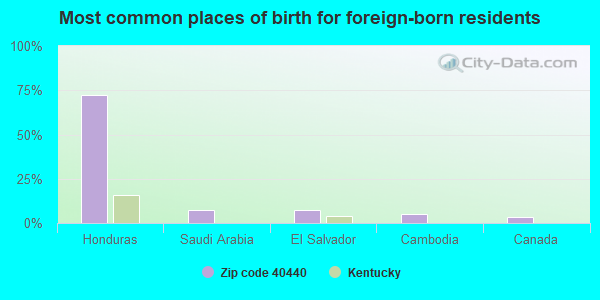
Foreign born population: 95 (4.1%) (93.1% of them are naturalized citizens)
This zip code:
4.1%
Whole state:
4.0%
72%Honduras
7%Saudi Arabia
7%El Salvador
5%Cambodia
3%Canada
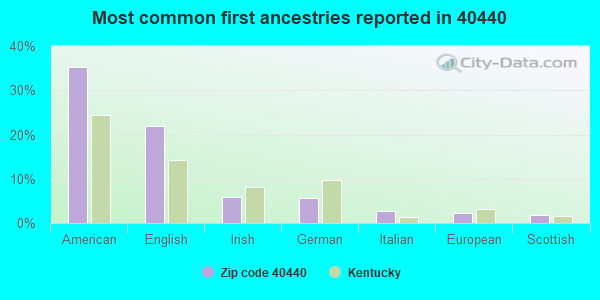
35%American
22%English
6%Irish
6%German
3%Italian
2%European
2%Scottish
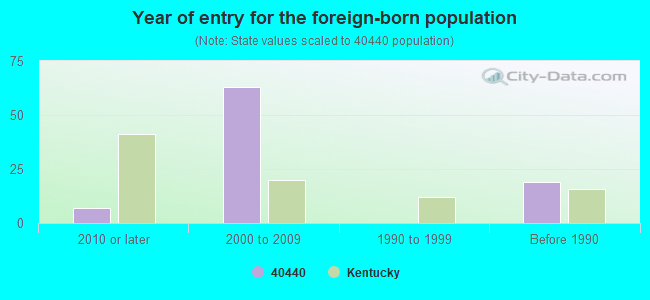
Year of entry for the foreign-born population
72010 or later
632000 to 2009
01990 to 1999
19Before 1990
Facilities with environmental interests located in this zip code:
AIR SYSTEM COMPONENTS LP (ROUTE 300 AND BELL LANE in JUNCTION CITY, KY)
HAZARDOUS WASTE BIENNIAL REPORTER (Resource Conservation and Recovery Act (tracking hazardous waste)) (Resource Conservation and Recovery Act (tracking hazardous waste)) Business NAICS classification: INDUSTRIAL AND COMMERCIAL FAN AND BLOWER MANUFACTURING. Alternative names: AIR SYSTEM COMPONENTS, L.P., PENN VENTILATION INC
ASHLAND BRANDED MARKETING, INC. 211-102 (HIGHWAY 127 & AIRPORT ROAD in JUNCTION CITY, KY)
(Resource Conservation and Recovery Act (tracking hazardous waste)) Organizations: ASHLAND BRANDED MARKETING INC. (CONTACT/OWNER)
BUCKINGHAM UST SITE #8706-011 (5015 WHITE OAK RD in JUNCTION CITY, KY)
PONDEROSA SPEEDWAY (OFF ST RT 37 1 MI S in JUNCTION CITY, KY)
(Resource Conservation and Recovery Act (tracking hazardous waste)) Organizations: SAM BELCHER (CONTACT/OWNER)
KY ARMY NATIONAL GUARD (INTERS OF US 127 & SR 300 in JUNCTION CITY, KY)
National Pollutant Discharge Elimination System NON-MAJOR (Tracking pollutant discharge elimination systems) - permit Business SIC classification: WATER SUPPLY
BURKE STREET LEAD (271 JONES LANE in JUNCTION CITY, KY)
SUPERFUND (Superfund database)
Housing units lacking complete plumbing facilities: 4.2% Housing units lacking complete kitchen facilities: 4.2%
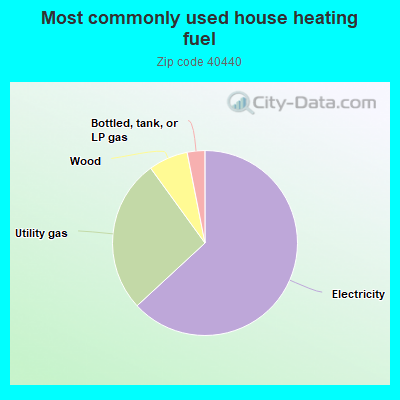
63.2%Electricity
26.9%Utility gas
6.9%Wood
3.1%Bottled, tank, or LP gas
Population in 1990: 3,582.
Place of birth for U.S.-born residents:
This state: 1,817
Northeast: 11
Midwest: 180
South: 137
West: 96
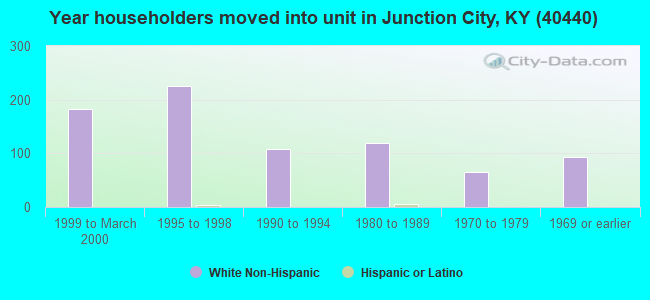
47% of the 40440 zip code residents lived in the same house 5 years ago. Out of people who lived in different houses, 53% lived in this county. Out of people who lived in different counties, 50% lived in Kentucky.
94% of the 40440 zip code residents lived in the same house 1 year ago. Out of people who lived in different houses, 50% moved from this county. Out of people who lived in different houses, 49% moved from different county within same state.
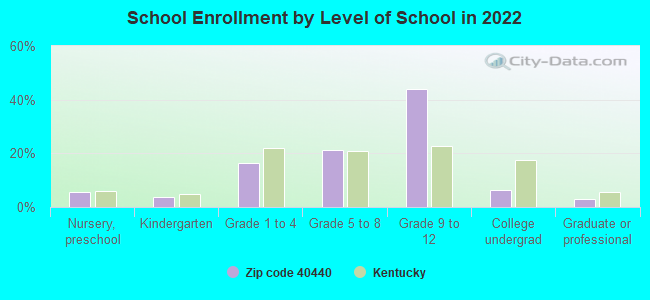
Private vs. public school enrollment:
Students in private schools in grades 1 to 8 (elementary and middle school): 20
Here:
11.9%
Kentucky:
17.2%
Students in private schools in grades 9 to 12 (high school): 20
Here:
10.1%
Kentucky:
15.2%
Students in private undergraduate colleges: 8
Here:
27.4%
Kentucky:
19.6%
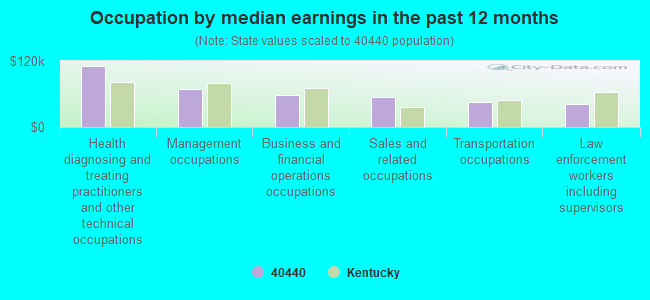
Occupation by median earnings in the past 12 months ($)
111,670Health diagnosing and treating practitioners and other technical occupations
68,388Management occupations
58,044Business and financial operations occupations
54,973Sales and related occupations
46,171Transportation occupations
41,641Law enforcement workers including supervisors
Top industries in this zip code by the number of employees in 2005:
Other Services (except Public Administration): Religious Organizations (10-19 employees: 1 establishment, 1-4 employees: 1 establishment)
Health Care and Social Assistance: Child Day Care Services (5-9: 1)
Construction: Power and Communication Line and Related Structures Construction (5-9: 1)
Professional, Scientific, and Technical Services: Veterinary Services (5-9: 1)
Professional, Scientific, and Technical Services: Other Accounting Services (1-4: 1)
Wholesale Trade: Wholesale Trade Agents and Brokers (1-4: 1)
Finance and Insurance: Commercial Banking (1-4: 1)
Professional, Scientific, and Technical Services: Photography Studios, Portrait (1-4: 1)
People in group quarters in 2010:
3 people in group homes intended for adults
People in group quarters in 2000:
2 people in other noninstitutional group quarters
Fatal accident statistics in 2014:
Fatal accident count: 1
Vehicles involved in fatal accidents: 1
Fatal accidents caused by drunken drivers: 0
Fatalities: 1
Persons involved in fatal accidents: 1
Pedestrians involved in fatal accidents: 0
Fatal accident statistics in 2011:
Fatal accident count: 1
Vehicles involved in fatal accidents: 2
Fatal accidents caused by drunken drivers: 0
Fatalities: 3
Persons involved in fatal accidents: 5
Pedestrians involved in fatal accidents: 0
2007 - 2018 National Fire Incident Reporting System (NFIRS) incidents
Based on the data from the years 2007 - 2018 the average number of fires per year is 13. The highest number of reported fire incidents - 31 took place in 2013, and the least - 0 in 2008. The data has a growing trend.
When looking into fire subcategories, the most incidents belonged to: Structure Fires (46.9%), and Outside Fires (34.4%).
Fire incident types reported to NFIRS in Zip Code 40440


 Nearest zip codes: 40422, 40464, 40448, 40437, 40484, 40468.


 Based on the data from the years 2007 - 2018 the average number of fires per year is 13. The highest number of reported fire incidents - 31 took place in 2013, and the least - 0 in 2008. The data has a growing trend.
 When looking into fire subcategories, the most incidents belonged to: Structure Fires (46.9%), and Outside Fires (34.4%).