Estimated zip code population in 2022: 972 Zip code population in 2010: 1,114 Zip code population in 2000: 1,025
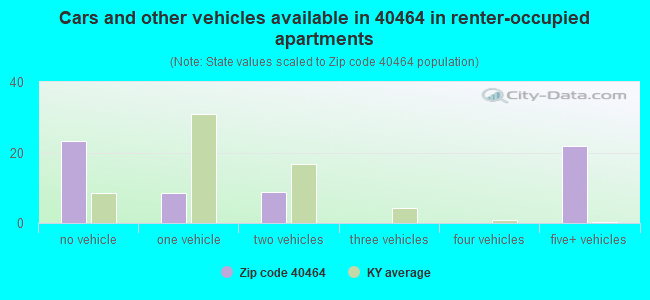
Houses and condos: 497 Renter-occupied apartments: 62
% of renters here:
14%
State:
31%
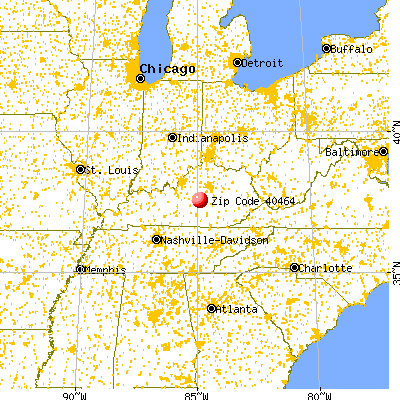
March 2022 cost of living index in zip code 40464: 78.5 (low, U.S. average is 100)
Land area: 33.6 sq. mi. Water area: 0.1 sq. mi.
Population density: 29 people per square mile
(very low).
OSM Map
General Map
Google Map
MSN Map
OSM Map
General Map
Google Map
MSN Map
OSM Map
General Map
Google Map
MSN Map
OSM Map
General Map
Google Map
MSN Map
Please wait while loading the map...
Real estate property taxes paid for housing units in 2022:
This zip code:
0.8% ($982)
Kentucky:
0.7% ($1,456)
Median real estate property taxes paid for housing units with mortgages in 2022: $978 (0.7%) Median real estate property taxes paid for housing units with no mortgage in 2022: $982 (1.1%)
Business Search- 14 Million verified businesses
Males: 450
(46.4%)
Females: 521
(53.6%)
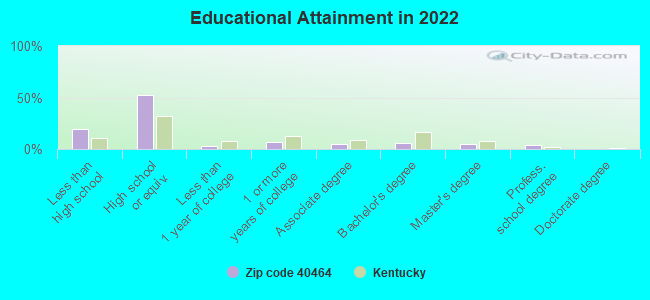
For population 25 years and over in 40464:
High school or higher: 80.0%
Bachelor's degree or higher: 13.8%
Graduate or professional degree: 8.3%
Unemployed: 3.6%
Mean travel time to work (commute): 28.9 minutes
For population 15 years and over in 40464:
Never married: 16.4%
Now married: 63.0%
Separated: 3.3%
Widowed: 9.1%
Divorced: 8.2%
Zip code 40464 compared to state average:
Median house value below state average.
Black race population percentage significantly below state average.
Hispanic race population percentage significantly below state average.
Median age significantly above state average.
Foreign-born population percentage significantly below state average.
Renting percentage below state average.
Length of stay since moving in significantly above state average.
Number of college students below state average.
Percentage of population with a bachelor's degree or higher below state average.
Estimated median house/condo value in 2022: $122,105
40464:
$122,105
Kentucky:
$196,300
According to our research of Kentucky and other state lists, there was 1 registered sex offender living in 40464 zip code as of May 28, 2024. The ratio of all residents to sex offenders in zip code 40464 is 1,255 to 1. The ratio of registered sex offenders to all residents in this zip code is much lower than the state average.
Median resident age:
This zip code:
49.5 years
Kentucky median age:
39.4 years
Average household size:
This zip code:
2.2 people
Kentucky:
2.4 people
Averages for the 2020 tax year for zip code 40464, filed in 2021:
Average Adjusted Gross Income (AGI) in 2020: $48,155 (Individual Income Tax Returns)
Here:
$48,155
State:
$61,342
Salary/wage: $41,529 (reported on 85.0% of returns)
Here:
$41,529
State:
$50,827
(% of AGI for various income ranges: 1217.3% for AGIs below $25k, 3071.0% for AGIs $25k-50k, 4695.0% for AGIs $50k-75k, 12880.0% for AGIs $100k-200k)
Taxable interest for individuals: $200 (reported on 15.0% of returns)
This zip code:
$200
Kentucky:
$1,441
(% of AGI for various income ranges: 2.7% for AGIs below $25k, 8.8% for AGIs $50k-75k)
Ordinary dividends: $567 (reported on 7.5% of returns)
Here:
$567
State:
$7,388
(% of AGI for various income ranges: 21.2% for AGIs $50k-75k)
Net capital gain/loss in AGI: +$2,450 (reported on 10.0% of returns)
Here:
+$2,450
State:
+$19,475
(% of AGI for various income ranges: 122.5% for AGIs $50k-75k)
Profit/loss from business: +$4,520 (reported on 12.5% of returns)
Here:
+$4,520
State:
+$11,386
(% of AGI for various income ranges: 226.0% for AGIs $25k-50k)
Taxable individual retirement arrangement distribution: $11,550 (reported on 5.0% of returns)
40464:
$11,550
Kentucky:
$18,941
(% of AGI for various income ranges: 210.0% for AGIs below $25k)
Earned income credit: $2,250 (reported on 20.0% of returns)
Here:
$2,250
State:
$2,336
(% of AGI for various income ranges: 96.4% for AGIs below $25k, 74.0% for AGIs $25k-50k)
Percentage of individuals using paid preparers for their 2020 taxes: 97.5%
Here:
98%
State:
94%
(% for various income ranges: 100.0% for AGIs below $25k, 90.9% for AGIs $25k-50k, 100.0% for AGIs $50k-75k, 100.0% for AGIs $75k-100k, 100.0% for AGIs $100k-200k)
Averages for the 2012 tax year for zip code 40464, filed in 2013:
Average Adjusted Gross Income (AGI) in 2012: $35,523 (Individual Income Tax Returns)
Here:
$35,523
State:
$50,814
Salary/wage: $32,338 (reported on 90.9% of returns)
Here:
$32,338
State:
$42,723
(% of AGI for various income ranges: 86.7% for AGIs below $25k, 81.3% for AGIs $25k-50k, 87.0% for AGIs $50k-75k, 77.9% for AGIs $75k-100k)
Taxable interest for individuals: $200 (reported on 18.2% of returns)
This zip code:
$200
Kentucky:
$1,381
Net capital gain/loss in AGI: +$700 (reported on 6.8% of returns)
Here:
+$700
State:
+$11,336
Profit/loss from business: +$4,683 (reported on 13.6% of returns)
Here:
+$4,683
State:
+$10,862
Taxable individual retirement arrangement distribution: $3,867 (reported on 6.8% of returns)
40464:
$3,867
Kentucky:
$14,296
Total itemized deductions: $15,562 (24% of AGI, reported on 18.2% of returns)
Here:
$15,562
State:
$21,160
Here:
24.2% of AGI
State:
20.0% of AGI
(% of AGI for various income ranges: 14.3% for AGIs below $25k, 7.9% for AGIs $50k-75k, 12.8% for AGIs $75k-100k)
Charity contributions: $2,450 (reported on 13.6% of returns)
Here:
$2,450
State:
$4,303
Taxes paid: $5,200 (reported on 18.2% of returns)
40464:
$5,200
State:
$8,496
(% of AGI for various income ranges: 2.7% for AGIs below $25k, 2.9% for AGIs $50k-75k, 5.2% for AGIs $75k-100k)
Earned income credit: $2,145 (reported on 25.0% of returns)
Here:
$2,145
State:
$2,273
(% of AGI for various income ranges: 7.1% for AGIs below $25k, 1.3% for AGIs $25k-50k)
Percentage of individuals using paid preparers for their 2012 taxes: 75.0%
Here:
75%
State:
60%
(% for various income ranges: 70.0% for AGIs below $25k, 76.9% for AGIs $25k-50k, 85.7% for AGIs $50k-75k, 75.0% for AGIs $75k-100k)
Averages for the 2004 tax year for zip code 40464, filed in 2005:
Average Adjusted Gross Income (AGI) in 2004: $29,517 (Individual Income Tax Returns)
Here:
$29,517
State:
$41,540
Salary/wage: $29,249 (reported on 88.7% of returns)
Here:
$29,249
State:
$36,432
(% of AGI for various income ranges: 87.0% for AGIs below $10k, 79.1% for AGIs $10k-25k, 89.5% for AGIs $25k-50k, 90.2% for AGIs $50k-75k, 89.9% for AGIs $75k-100k)
Taxable interest for individuals: $590 (reported on 28.0% of returns)
This zip code:
$590
Kentucky:
$1,571
(% of AGI for various income ranges: 3.0% for AGIs below $10k, 0.7% for AGIs $10k-25k, 0.4% for AGIs $25k-50k, 0.4% for AGIs $50k-75k, 0.5% for AGIs $75k-100k)
Taxable dividends: $233 (reported on 6.9% of returns)
Here:
$233
State:
$3,453
Net capital gain/loss: +$3,200 (reported on 6.9% of returns)
Here:
+$3,200
State:
+$9,663
Profit/loss from business: +$5,286 (reported on 16.1% of returns)
Here:
+$5,286
State:
+$9,233
(% of AGI for various income ranges: 18.2% for AGIs below $10k, 7.0% for AGIs $10k-25k, 2.5% for AGIs $25k-50k, 0.5% for AGIs $50k-75k)
Total itemized deductions: $12,632 (24% of AGI, reported on 17.5% of returns)
Here:
$12,632
State:
$17,474
Here:
23.6% of AGI
State:
21.0% of AGI
(% of AGI for various income ranges: 5.5% for AGIs $10k-25k, 7.1% for AGIs $25k-50k, 7.2% for AGIs $50k-75k, 12.9% for AGIs $75k-100k)
Charity contributions deductions: $1,862 (4% of AGI, reported on 13.3% of returns)
Here:
$1,862
State:
$3,494
Here:
3.5% of AGI
State:
4.0% of AGI
(% of AGI for various income ranges: 1.2% for AGIs $10k-25k, 0.8% for AGIs $25k-50k, 0.7% for AGIs $50k-75k, 1.1% for AGIs $75k-100k)
Total tax: $2,742 (reported on 71.3% of returns)
40464:
$2,742
State:
$6,162
(% of AGI for various income ranges: 3.5% for AGIs below $10k, 3.7% for AGIs $10k-25k, 5.5% for AGIs $25k-50k, 7.3% for AGIs $50k-75k, 12.1% for AGIs $75k-100k)
Earned income credit: $1,530 (reported on 26.4% of returns)
Here:
$1,530
State:
$1,723
Percentage of individuals using paid preparers for their 2004 taxes: 83.7%
Here:
84%
State:
66%
(% for various income ranges: 76.2% for AGIs below $10k, 81.8% for AGIs $10k-25k, 87.3% for AGIs $25k-50k, 91.4% for AGIs $50k-75k, 85.7% for AGIs $75k-100k)
Household received Food Stamps/SNAP in the past 12 months: 49 Household did not receive Food Stamps/SNAP in the past 12 months: 385
Women who did not have a birth in the past 12 months: 202 (122 now married, 81 unmarried)
Housing units in zip code 40464 with a mortgage: 183 (19 second mortgage, 19 both second mortgage and home equity loan) Median monthly owner costs for units with a mortgage: $1,053 Median monthly owner costs for units without a mortgage: $431
Residents with income below the poverty level in 2022:
This zip code:
10.7%
Whole state:
16.5%
Residents with income below 50% of the poverty level in 2022:
This zip code:
9.5%
Whole state:
9.0%
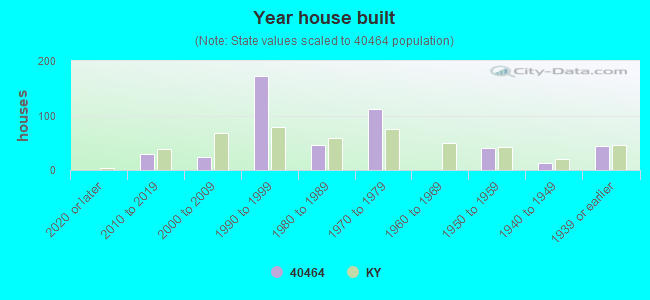
Median number of rooms in houses and condos:
Here:
5.9
State:
6.4
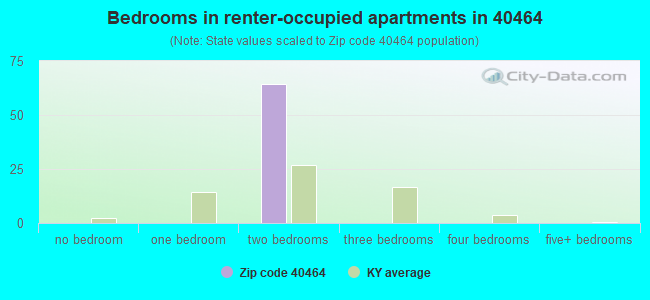
Median number of rooms in apartments:
Here:
4.9
State:
4.4
Notable locations in this zip code not listed on our city pages
Notable locations in zip code 40464: Boyle County Fire Department Engine Company 5 (A), Boyle County Forkland Fire District (B), Forkland Community Center (C), Butchertown Community Center (D). Display/hide their locations on the map
Churches in zip code 40464 include: Faith Chapel (A), Friendship Church (B), Pleasant Valley Church (C), Chestnut Grove Chruch of Christ (D), Valley Grove Church (E). Display/hide their locations on the map
Cemeteries: Mitchell Cemetery (1), Vaught Cemetery (2), Crews Cemetery (3), Minor Cemetery (4), Butchertown Cemetery (5). Display/hide their locations on the map
Streams, rivers, and creeks: Tub Run (A), Carpenter Fork (B), Sulphur Branch (C), Buck Creek (D), Buck Branch (E), Lock Branch (F), Johnson Branch (G), Shelby Branch (H), Frances Branch (I). Display/hide their locations on the map
Size of family households: 193 2-persons, 62 3-persons, 22 4-persons, 10 5-persons, 16 6-persons
Size of nonfamily households: 119 1-person, 12 2-persons
81 married couples with children.
10 single-parent households (10 women).
98.8% of residents of 40464 zip code speak English at home.
0.4% of residents speak Spanish at home (100% well).
0.6% of residents speak other Indo-European language at home (100% very well).
Foreign born population: 0 (0.0%)
:
0.0%
Whole state:
4.0%
53%American
15%English
9%Irish
8%German
5%Scotch-Irish
2%Swedish
1%Pennsylvania German
Facilities with environmental interests located in this zip code:
SINKHORN GROCERY #9272 (8507 LEBANON RD in PARKSVILLE, KY)
Housing units lacking complete plumbing facilities: 6.2% Housing units lacking complete kitchen facilities: 3.7%
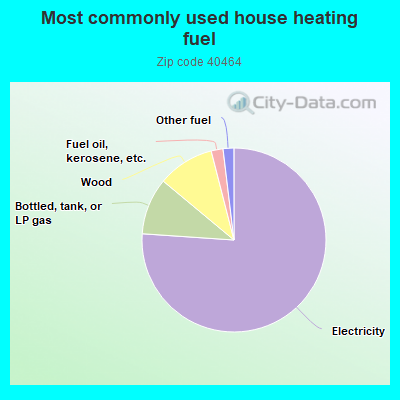
76.4%Electricity
10.0%Bottled, tank, or LP gas
10.0%Wood
2.1%Fuel oil, kerosene, etc.
1.9%Other fuel
Population in 1990: 893. Population change in the 1990s: +132 (+14.8%).
Place of birth for U.S.-born residents:
This state: 697
Northeast: 77
Midwest: 151
South: 28
West: 18
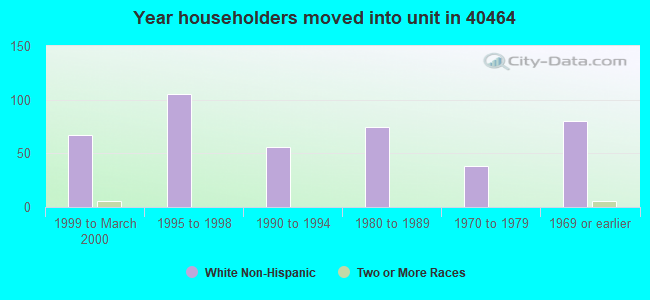
67% of the 40464 zip code residents lived in the same house 5 years ago. Out of people who lived in different houses, 55% lived in this county. Out of people who lived in different counties, 50% lived in Kentucky.
90% of the 40464 zip code residents lived in the same house 1 year ago. Out of people who lived in different houses, 11% moved from this county. Out of people who lived in different houses, 63% moved from different county within same state. Out of people who lived in different houses, 28% moved from different state.
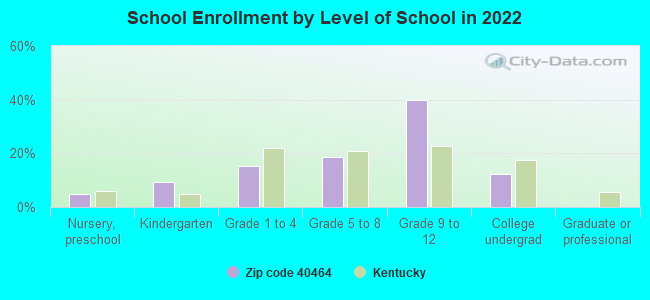
Private vs. public school enrollment:
Students in private schools in grades 1 to 8 (elementary and middle school):
Here:
0.0%
Kentucky:
17.2%
Students in private schools in grades 9 to 12 (high school): 20
Here:
28.8%
Kentucky:
15.2%
Students in private undergraduate colleges:
Here:
0.0%
Kentucky:
19.6%
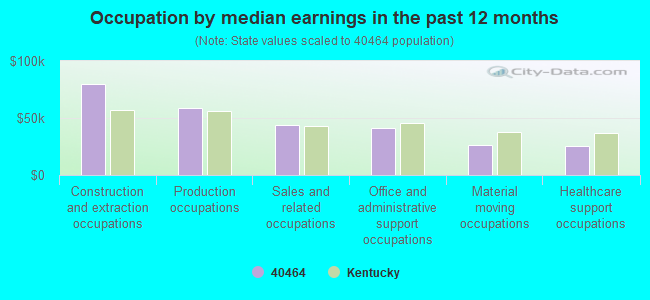
Occupation by median earnings in the past 12 months ($)
79,994Construction and extraction occupations
58,968Production occupations
43,497Sales and related occupations
41,455Office and administrative support occupations
25,981Material moving occupations
25,458Healthcare support occupations
Top industries in this zip code by the number of employees in 2005:
Other Services (except Public Administration): Cemeteries and Crematories (1-4 employees: 1 establishment)
Other Services (except Public Administration): Religious Organizations (1-4: 1)
Construction: Commercial and Institutional Building Construction (1-4: 1)
Construction: Drywall and Insulation Contractors (1-4: 1)
Fatal accident statistics in 2014:
Fatal accident count: 1
Vehicles involved in fatal accidents: 1
Fatal accidents caused by drunken drivers: 1
Fatalities: 1
Persons involved in fatal accidents: 5
Pedestrians involved in fatal accidents: 0
Fatal accident statistics in 2010:
Fatal accident count: 1
Vehicles involved in fatal accidents: 1
Fatal accidents caused by drunken drivers: 0
Fatalities: 1
Persons involved in fatal accidents: 1
Pedestrians involved in fatal accidents: 0
Most common first names in zip code 40464 among deceased individuals
Name
Count
Lived (average)
James
11
66.3 years
Mary
10
80.0 years
William
10
70.5 years
John
9
81.1 years
Robert
8
64.2 years
Nellie
6
82.5 years
Dorothy
5
73.0 years
Charles
5
62.4 years
Walter
5
79.6 years
Clarence
4
73.8 years
Most common last names in zip code 40464 among deceased individuals
Last name
Count
Lived (average)
Belcher
10
72.0 years
Johnson
9
73.2 years
Wilson
9
71.8 years
Pendygraft
8
71.1 years
Engle
8
73.1 years
Holt
7
79.6 years
Roller
7
81.7 years
Montgomery
7
70.9 years
Pike
6
62.5 years
Wofford
5
67.2 years
Discuss , Kentucky (KY) on our hugely popular Kentucky forum.


 Nearest zip codes: 40468, 40440, 40422, 40328, 40437, 40448.