Estimated zip code population in 2022: 3,532 Zip code population in 2010: 4,434 Zip code population in 2000: 4,874
Houses and condos: 1,720 Renter-occupied apartments: 363
% of renters here:
25%
State:
31%
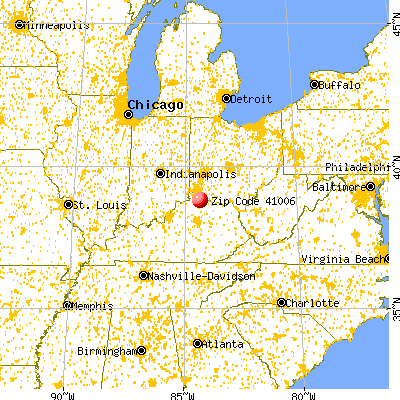
March 2022 cost of living index in zip code 41006: 81.5 (low, U.S. average is 100)
Land area: 52.9 sq. mi. Water area: 0.8 sq. mi.
Population density: 67 people per square mile
(very low).
OSM Map
General Map
Google Map
MSN Map
OSM Map
General Map
Google Map
MSN Map
OSM Map
General Map
Google Map
MSN Map
OSM Map
General Map
Google Map
MSN Map
Please wait while loading the map...
Real estate property taxes paid for housing units in 2022:
This zip code:
0.8% ($1,539)
Kentucky:
0.7% ($1,456)
Median real estate property taxes paid for housing units with mortgages in 2022: $1,785 (0.8%) Median real estate property taxes paid for housing units with no mortgage in 2022: $1,273 (0.8%)
Business Search- 14 Million verified businesses
Males: 1,719
(48.7%)
Females: 1,813
(51.3%)
For population 25 years and over in 41006:
High school or higher: 89.6%
Bachelor's degree or higher: 24.0%
Graduate or professional degree: 5.9%
Unemployed: 1.8%
Mean travel time to work (commute): 38.7 minutes
For population 15 years and over in 41006:
Never married: 18.9%
Now married: 53.9%
Separated: 0.6%
Widowed: 7.9%
Divorced: 18.7%
Zip code 41006 compared to state average:
Unemployed percentage below state average.
Black race population percentage significantly below state average.
Hispanic race population percentage below state average.
Median age significantly above state average.
Foreign-born population percentage significantly below state average.
Length of stay since moving in significantly above state average.
Estimated median house/condo value in 2022: $191,642
41006:
$191,642
Kentucky:
$196,300
According to our research of Kentucky and other state lists, there were 5 registered sex offenders living in 41006 zip code as of May 28, 2024. The ratio of all residents to sex offenders in zip code 41006 is 884 to 1. The ratio of registered sex offenders to all residents in this zip code is lower than the state average.
Median resident age:
This zip code:
49.6 years
Kentucky median age:
39.4 years
Average household size:
This zip code:
2.3 people
Kentucky:
2.4 people
Averages for the 2020 tax year for zip code 41006, filed in 2021:
Average Adjusted Gross Income (AGI) in 2020: $64,508 (Individual Income Tax Returns)
Here:
$64,508
State:
$61,342
Salary/wage: $56,024 (reported on 82.5% of returns)
Here:
$56,024
State:
$50,827
(% of AGI for various income ranges: 1052.9% for AGIs below $25k, 3554.7% for AGIs $25k-50k, 5988.0% for AGIs $50k-75k, 9102.9% for AGIs $75k-100k, 16831.7% for AGIs $100k-200k, 58390.0% for AGIs over 200k)
Taxable interest for individuals: $885 (reported on 24.2% of returns)
This zip code:
$885
Kentucky:
$1,441
(% of AGI for various income ranges: 7.1% for AGIs below $25k, 14.7% for AGIs $25k-50k, 30.4% for AGIs $50k-75k, 28.8% for AGIs $75k-100k, 66.7% for AGIs $100k-200k, 440.0% for AGIs over 200k)
Ordinary dividends: $3,635 (reported on 16.0% of returns)
Here:
$3,635
State:
$7,388
(% of AGI for various income ranges: 8.8% for AGIs below $25k, 41.7% for AGIs $25k-50k, 76.4% for AGIs $50k-75k, 54.1% for AGIs $75k-100k, 295.6% for AGIs $100k-200k, 625.0% for AGIs over 200k)
Net capital gain/loss in AGI: +$12,215 (reported on 13.9% of returns)
Here:
+$12,215
State:
+$19,475
(% of AGI for various income ranges: 6.2% for AGIs below $25k, 38.6% for AGIs $25k-50k, 72.4% for AGIs $50k-75k, 198.8% for AGIs $75k-100k, 406.1% for AGIs $100k-200k, 9415.0% for AGIs over 200k)
Profit/loss from business: +$8,015 (reported on 13.4% of returns)
Here:
+$8,015
State:
+$11,386
(% of AGI for various income ranges: 93.3% for AGIs below $25k, 103.1% for AGIs $25k-50k, 189.2% for AGIs $50k-75k, 308.2% for AGIs $75k-100k, 180.0% for AGIs $100k-200k)
Taxable individual retirement arrangement distribution: $17,194 (reported on 9.3% of returns)
41006:
$17,194
Kentucky:
$18,941
(% of AGI for various income ranges: 51.4% for AGIs below $25k, 124.2% for AGIs $25k-50k, 222.8% for AGIs $50k-75k, 411.8% for AGIs $75k-100k, 652.8% for AGIs $100k-200k)
Total itemized deductions: $33,488 (reported on 4.1% of returns)
Here:
$33,488
State:
$32,473
(% of AGI for various income ranges: 355.2% for AGIs $50k-75k, 995.0% for AGIs $100k-200k)
Charity contributions: $10,100 (reported on 3.6% of returns)
Here:
$10,100
State:
$13,472
(% of AGI for various income ranges: 61.6% for AGIs $50k-75k, 307.2% for AGIs $100k-200k)
Taxes paid: $7,878 (reported on 4.6% of returns)
41006:
$7,878
State:
$7,830
(% of AGI for various income ranges: 84.4% for AGIs $50k-75k, 276.7% for AGIs $100k-200k)
Earned income credit: $2,217 (reported on 15.5% of returns)
Here:
$2,217
State:
$2,336
(% of AGI for various income ranges: 108.3% for AGIs below $25k, 58.3% for AGIs $25k-50k)
Percentage of individuals using paid preparers for their 2020 taxes: 95.4%
Here:
95%
State:
94%
(% for various income ranges: 94.7% for AGIs below $25k, 95.6% for AGIs $25k-50k, 93.9% for AGIs $50k-75k, 95.8% for AGIs $75k-100k, 96.7% for AGIs $100k-200k, 100.0% for AGIs over 200k)
Averages for the 2012 tax year for zip code 41006, filed in 2013:
Average Adjusted Gross Income (AGI) in 2012: $49,236 (Individual Income Tax Returns)
Here:
$49,236
State:
$50,814
Salary/wage: $43,041 (reported on 87.7% of returns)
Here:
$43,041
State:
$42,723
(% of AGI for various income ranges: 78.4% for AGIs below $25k, 80.2% for AGIs $25k-50k, 83.7% for AGIs $50k-75k, 78.4% for AGIs $75k-100k, 69.0% for AGIs $100k-200k)
Taxable interest for individuals: $777 (reported on 29.2% of returns)
This zip code:
$777
Kentucky:
$1,381
(% of AGI for various income ranges: 0.8% for AGIs below $25k, 0.5% for AGIs $25k-50k, 0.3% for AGIs $50k-75k, 0.4% for AGIs $75k-100k, 0.5% for AGIs $100k-200k)
Ordinary dividends: $2,010 (reported on 15.4% of returns)
Here:
$2,010
State:
$6,239
(% of AGI for various income ranges: 0.6% for AGIs below $25k, 0.6% for AGIs $25k-50k, 0.4% for AGIs $50k-75k, 0.3% for AGIs $75k-100k, 1.0% for AGIs $100k-200k)
Net capital gain/loss in AGI: +$6,948 (reported on 11.8% of returns)
Here:
+$6,948
State:
+$11,336
(% of AGI for various income ranges: 0.6% for AGIs below $25k, 0.4% for AGIs $25k-50k, 0.2% for AGIs $50k-75k, 4.5% for AGIs $100k-200k)
Profit/loss from business: +$8,107 (reported on 13.8% of returns)
Here:
+$8,107
State:
+$10,862
(% of AGI for various income ranges: 6.5% for AGIs below $25k, 3.2% for AGIs $25k-50k, 1.8% for AGIs $50k-75k, 1.8% for AGIs $75k-100k, 1.1% for AGIs $100k-200k)
Taxable individual retirement arrangement distribution: $13,360 (reported on 7.7% of returns)
41006:
$13,360
Kentucky:
$14,296
(% of AGI for various income ranges: 2.9% for AGIs below $25k, 2.3% for AGIs $25k-50k, 1.5% for AGIs $50k-75k, 3.3% for AGIs $75k-100k, 1.3% for AGIs $100k-200k)
Total itemized deductions: $19,112 (21% of AGI, reported on 29.7% of returns)
Here:
$19,112
State:
$21,160
Here:
21.0% of AGI
State:
20.0% of AGI
(% of AGI for various income ranges: 6.4% for AGIs below $25k, 8.6% for AGIs $25k-50k, 12.1% for AGIs $50k-75k, 12.1% for AGIs $75k-100k, 14.0% for AGIs $100k-200k)
Charity contributions: $3,078 (reported on 23.1% of returns)
Here:
$3,078
State:
$4,303
(% of AGI for various income ranges: 0.3% for AGIs below $25k, 1.1% for AGIs $25k-50k, 0.9% for AGIs $50k-75k, 1.4% for AGIs $75k-100k, 2.3% for AGIs $100k-200k)
Taxes paid: $7,264 (reported on 29.7% of returns)
41006:
$7,264
State:
$8,496
(% of AGI for various income ranges: 1.0% for AGIs below $25k, 2.2% for AGIs $25k-50k, 4.1% for AGIs $50k-75k, 5.1% for AGIs $75k-100k, 6.4% for AGIs $100k-200k)
Earned income credit: $2,526 (reported on 17.4% of returns)
Here:
$2,526
State:
$2,273
(% of AGI for various income ranges: 6.6% for AGIs below $25k, 1.5% for AGIs $25k-50k)
Percentage of individuals using paid preparers for their 2012 taxes: 62.1%
Here:
62%
State:
60%
(% for various income ranges: 57.5% for AGIs below $25k, 64.0% for AGIs $25k-50k, 63.3% for AGIs $50k-75k, 68.2% for AGIs $75k-100k, 65.0% for AGIs $100k-200k)
Averages for the 2004 tax year for zip code 41006, filed in 2005:
Average Adjusted Gross Income (AGI) in 2004: $41,574 (Individual Income Tax Returns)
Here:
$41,574
State:
$41,540
Salary/wage: $36,676 (reported on 90.5% of returns)
Here:
$36,676
State:
$36,432
(% of AGI for various income ranges: 107.1% for AGIs below $10k, 84.8% for AGIs $10k-25k, 83.6% for AGIs $25k-50k, 86.0% for AGIs $50k-75k, 87.9% for AGIs $75k-100k, 57.4% for AGIs over 100k)
Taxable interest for individuals: $830 (reported on 38.6% of returns)
This zip code:
$830
Kentucky:
$1,571
(% of AGI for various income ranges: 2.6% for AGIs below $10k, 1.0% for AGIs $10k-25k, 0.7% for AGIs $25k-50k, 0.6% for AGIs $50k-75k, 0.9% for AGIs $75k-100k, 0.8% for AGIs over 100k)
Taxable dividends: $1,485 (reported on 18.8% of returns)
Here:
$1,485
State:
$3,453
(% of AGI for various income ranges: 1.0% for AGIs below $10k, 0.8% for AGIs $10k-25k, 0.5% for AGIs $25k-50k, 0.2% for AGIs $50k-75k, 0.6% for AGIs $75k-100k, 1.3% for AGIs over 100k)
Net capital gain/loss: +$3,483 (reported on 12.4% of returns)
Here:
+$3,483
State:
+$9,663
(% of AGI for various income ranges: -0.9% for AGIs below $10k, 0.6% for AGIs $10k-25k, 0.8% for AGIs $25k-50k, 0.3% for AGIs $50k-75k, 1.2% for AGIs $75k-100k, 2.4% for AGIs over 100k)
Profit/loss from business: +$6,383 (reported on 13.6% of returns)
Here:
+$6,383
State:
+$9,233
(% of AGI for various income ranges: 4.5% for AGIs below $10k, 3.9% for AGIs $10k-25k, 3.1% for AGIs $25k-50k, 1.5% for AGIs $50k-75k, -0.1% for AGIs $75k-100k, 2.4% for AGIs over 100k)
IRA payment deduction: $2,259 (reported on 1.4% of returns)
41006:
$2,259
Kentucky:
$2,955
Total itemized deductions: $15,107 (20% of AGI, reported on 33.6% of returns)
Here:
$15,107
State:
$17,474
Here:
20.4% of AGI
State:
21.0% of AGI
(% of AGI for various income ranges: 7.4% for AGIs $10k-25k, 9.6% for AGIs $25k-50k, 14.0% for AGIs $50k-75k, 15.7% for AGIs $75k-100k, 13.2% for AGIs over 100k)
Charity contributions deductions: $2,278 (3% of AGI, reported on 28.8% of returns)
Here:
$2,278
State:
$3,494
Here:
2.9% of AGI
State:
4.0% of AGI
(% of AGI for various income ranges: 0.8% for AGIs $10k-25k, 1.2% for AGIs $25k-50k, 1.5% for AGIs $50k-75k, 2.2% for AGIs $75k-100k, 2.0% for AGIs over 100k)
Total tax: $5,265 (reported on 76.6% of returns)
41006:
$5,265
State:
$6,162
(% of AGI for various income ranges: 2.3% for AGIs below $10k, 4.2% for AGIs $10k-25k, 6.5% for AGIs $25k-50k, 7.9% for AGIs $50k-75k, 9.2% for AGIs $75k-100k, 18.9% for AGIs over 100k)
Earned income credit: $1,688 (reported on 14.5% of returns)
Here:
$1,688
State:
$1,723
Percentage of individuals using paid preparers for their 2004 taxes: 66.5%
Here:
66%
State:
66%
(% for various income ranges: 57.1% for AGIs below $10k, 66.7% for AGIs $10k-25k, 70.9% for AGIs $25k-50k, 68.9% for AGIs $50k-75k, 67.1% for AGIs $75k-100k, 68.0% for AGIs over 100k)
Likely homosexual households (counted as self-reported same-sex unmarried-partner households)
Lesbian couples: 1.5% of all households
Gay men: 0.0% of all households
Household received Food Stamps/SNAP in the past 12 months: 53 Household did not receive Food Stamps/SNAP in the past 12 months: 1,420
Women who had a birth in the past 12 months: 86 (45 now married, 41 unmarried) Women who did not have a birth in the past 12 months: 518 (210 now married, 307 unmarried)
Housing units in zip code 41006 with a mortgage: 531 (29 second mortgage, 8 home equity loan, 22 both second mortgage and home equity loan) Houses without a mortgage: 48
Median monthly owner costs for units with a mortgage: $1,169 Median monthly owner costs for units without a mortgage: $433
Residents with income below the poverty level in 2022:
This zip code:
13.0%
Whole state:
16.5%
Residents with income below 50% of the poverty level in 2022:
This zip code:
5.9%
Whole state:
9.0%
Median number of rooms in houses and condos:
Here:
6.6
State:
6.4
Median number of rooms in apartments:
Here:
5.6
State:
4.4
Notable locations in this zip code not listed on our city pages
Notable locations in zip code 41006: Butler Volunteer Fire Department (A), Northern Pendleton County Volunteer Fire Department (B). Display/hide their locations on the map
Cemeteries: Butler Cemetery (1), Pleasant Hill Cemetery (2), Norris Cemetery (3), Ellis Cemetery (4), Mount Auburn Cemetery (5). Display/hide their locations on the map
Streams, rivers, and creeks: Willow Creek (A), Steer Creek (B), Plum Creek (C), Lick Creek (D), Kincaid Creek (E), Kennedy Branch (F), Harris Creek (G), Holst Creek (H), Sandy Branch (I). Display/hide their locations on the map
In group quarters: 76 (-1 institutionalized population)
Size of family households: 522 2-persons, 223 3-persons, 167 4-persons, 96 5-persons, 15 6-persons, 3 7-or-more-persons
Size of nonfamily households: 439 1-person, 10 2-persons
318 married couples with children.
151 single-parent households (52 men, 99 women).
99.5% of residents of 41006 zip code speak English at home.
0.5% of residents speak Spanish at home (100% very well).
0.4% of residents speak other Indo-European language at home (100% very well).
Foreign born population: 27 (0.8%) (45.0% of them are naturalized citizens)
This zip code:
0.8%
Whole state:
4.0%
46%Honduras
39%Malaysia
7%Bhutan
23%English
20%American
17%German
11%Irish
3%Welsh
3%Italian
1%Norwegian
Year of entry for the foreign-born population
22010 or later
112000 to 2009
41990 to 1999
19Before 1990
Major facilities with environmental interests located in this zip code:
CARMEUSE LIME & STONE INC. BLACK RIVER OPERATION (9043 HWY. 154 in BUTLER, KY)
AIR MAJOR (AIRS/AFS) (Integrated Compliance Information System) - ICIS-04-1999-0539, FORMAL ENFORCEMENT ACTION COMPLIANCE ACTIVITY (Tracking inspections of insecticide, fungicide, and rodenticide, and toxic substances) CRITERIA AND HAZARDOUS AIR POLLUTANT INVENTORY (Inventory of air pollution sources) National Pollutant Discharge Elimination System NON-MAJOR (Tracking pollutant discharge elimination systems) - permit National Pollutant Discharge Elimination System NON-MAJOR (Tracking pollutant discharge elimination systems) - permit AIR MAJOR ("Best Available" air pollution technologies tracking) TRI REPORTER (Tracking of toxic chemicals releasing facilities) Business SIC classification: CRUSHED AND BROKEN LIMESTONE; LIME Organizations: CARMEUSE LIME BLACK RIVER OPER (CONTACT/OWNER)
, BLACK RIVER MINE (CONTACT/OWNER)
Alternative names: BLACK RIVER MINE, CARMEUSE LIME BLACK RIVER OPER, DRAVO LIME CO, DRAVO LIME CO BLACK RIVER DIV, DRAVO LIME COMPANY - KY ROUTE 8, DRAVO LIME COMPANY - KY ROUTE 8
MAGO CONSTRUCTION COMPANY, INC. (HIGHWAY 177 in BUTLER, KY)
(Integrated Compliance Information System) - ICIS-04-2000-0063, FORMAL ENFORCEMENT ACTION CRITERIA AND HAZARDOUS AIR POLLUTANT INVENTORY (Inventory of air pollution sources) National Pollutant Discharge Elimination System NON-MAJOR (Tracking pollutant discharge elimination systems) - permit (Resource Conservation and Recovery Act (tracking hazardous waste)) Business SIC classification: ASPHALT PAVING MIXTURES AND BLOCKS Business NAICS classification: ASPHALT PAVING MIXTURE AND BLOCK MANUFACTURING. Organizations: MAGO CONSTRUCTION CO INC (CONTACT/OWNER)
PENDLETON CO LANDFILL/RUMPKE OF KY (135 BRYANT GRIFFIN ROAD in BUTLER, KY)
AIR MINOR (AIRS/AFS) CRITERIA AND HAZARDOUS AIR POLLUTANT INVENTORY (Inventory of air pollution sources) National Pollutant Discharge Elimination System NON-MAJOR (Tracking pollutant discharge elimination systems) - permit Business SIC classification: CRUSHED AND BROKEN LIMESTONE; REFUSE SYSTEMS; MANAGEMENT SERVICES Organizations: RUMPKE OF KENTUCKY INC (CONTACT/OWNER)
Alternative names: RUMPKE OF KENTUCKY INC, RUMPKE OF KENTUCKY INC
NORTHERN ELEMENTARY SCHOOL (925 HWY 177 E in BUTLER, KY)
(National Center for Education Statistics) - STATE ID-096481060 Organizations: PENDLETON COUNTY (SCHOOL DISTRICT)
PHILLIP A SHARP MIDDLE SCHOOL (35 WRIGHT RD in BUTLER, KY)
(National Center for Education Statistics) - STATE ID-096481061 Organizations: PENDLETON COUNTY (SCHOOL DISTRICT)
A T & T LONG LINES (.4 MI N OF JCT 17 & 27 in BUTLER, KY)
(Resource Conservation and Recovery Act (tracking hazardous waste)) Organizations: AT & T LONG LINES (CONTACT/OWNER)
AT&T (W OF INTERSEC. HWY 17 & 27 S in BUTLER, KY)
(Resource Conservation and Recovery Act (tracking hazardous waste)) Organizations: AT & T (CONTACT/OWNER)
BAY RESIDENCE (414G PLEASANT VALLEY CT in BUTLER, KY)
National Pollutant Discharge Elimination System NON-MAJOR (Tracking pollutant discharge elimination systems) - permit Business SIC classification: OPERATORS OF DWELLINGS OTHER THAN APARTMENT BUILDINGS
BOSTON HEIGHTS MHP (BOSTON RD in BUTLER, KY)
National Pollutant Discharge Elimination System NON-MAJOR (Tracking pollutant discharge elimination systems) - permit Business SIC classification: OPERATORS OF RESIDENTIAL MOBILE HOME SITES
BROUGHTON RESIDENCE (662 WEST VISAILIA RD in BUTLER, KY)
National Pollutant Discharge Elimination System NON-MAJOR (Tracking pollutant discharge elimination systems) - permit Business SIC classification: OPERATORS OF DWELLINGS OTHER THAN APARTMENT BUILDINGS
BUTLER STP (CINDY DR in BUTLER, KY)
National Pollutant Discharge Elimination System NON-MAJOR (Tracking pollutant discharge elimination systems) - permit Business SIC classification: SEWERAGE SYSTEMS
MT AUBURN APTS (RT 10 & RT 159 in BUTLER, KY)
National Pollutant Discharge Elimination System NON-MAJOR (Tracking pollutant discharge elimination systems) - permit Business SIC classification: OPERATORS OF APARTMENT BUILDINGS
MULLEN RESIDENCE (GRANTS LICK RIDGEVIEW EST in BUTLER, KY)
National Pollutant Discharge Elimination System NON-MAJOR (Tracking pollutant discharge elimination systems) - permit Business SIC classification: OPERATORS OF DWELLINGS OTHER THAN APARTMENT BUILDINGS
Housing units lacking complete plumbing facilities: 1.3% Housing units lacking complete kitchen facilities: 2.1%
49.9%Electricity
25.1%Bottled, tank, or LP gas
17.1%Utility gas
3.8%Fuel oil, kerosene, etc.
1.8%Wood
1.8%Other fuel
0.8%No fuel used
Population in 1990: 4,743. Population change in the 1990s: +131 (+2.8%).
Place of birth for U.S.-born residents:
This state: 2,606
Northeast: 110
Midwest: 554
South: 146
West: 64
63% of the 41006 zip code residents lived in the same house 5 years ago. Out of people who lived in different houses, 43% lived in this county. Out of people who lived in different counties, 50% lived in Kentucky.
97% of the 41006 zip code residents lived in the same house 1 year ago. Out of people who lived in different houses, 14% moved from this county. Out of people who lived in different houses, 77% moved from different county within same state. Out of people who lived in different houses, 22% moved from different state.
Private vs. public school enrollment:
Students in private schools in grades 1 to 8 (elementary and middle school): 12
Here:
4.6%
Kentucky:
17.2%
Students in private schools in grades 9 to 12 (high school): 14
Here:
7.6%
Kentucky:
15.2%
Students in private undergraduate colleges: 1
Here:
1.1%
Kentucky:
19.6%
Occupation by median earnings in the past 12 months ($)
84,226Management occupations
70,537Health diagnosing and treating practitioners and other technical occupations
58,995Installation, maintenance, and repair occupations
53,136Transportation occupations
45,123Production occupations
44,238Office and administrative support occupations
Companies with federal contracts located in this zip code:
BUTLER PRODUCTS INC (103 SOUTH ST in BUTLER, KY; small business) : $176,345 in 9 contractsfrom 2003 to 2005
Contracts for Miscellaneous Vehicular Components, Nails, Machine Keys, and Pins, Hardware, Commercial, Miscellaneous Power Transmission Equipment by Defense Logistics Agency Signed by year:2000: $0; 2001: $0; 2002: $0; 2003: $53,350; 2004: $116,930; 2005: $6,065; 2006: $0.
Biggest contracts:
$78,883 with Defense Logistics Agency for Miscellaneous Vehicular Components. Signed on 2004-02-27. Completion date: 2004-04-27.
$53,350, same as above.Signed on 2003-10-31. Completion date: 2003-11-30.
$24,750, same as above.Signed on 2004-12-30. Completion date: 2005-02-05.
$7,319 with Defense Logistics Agency for Nails, Machine Keys, and Pins. Signed on 2004-11-05. Completion date: 2004-12-16.
Top industries in this zip code by the number of employees in 2005:
Construction: Site Preparation Contractors (50-99 employees: 1 establishment)
Health Care and Social Assistance: Nursing Care Facilities (50-99: 1)
Mining: Crushed and Broken Limestone Mining and Quarrying (20-49: 1, 1-4: 1)
Professional, Scientific, and Technical Services: Veterinary Services (20-49: 1)
People in group quarters in 2010:
81 people in nursing facilities/skilled-nursing facilities
People in group quarters in 2000:
58 people in nursing homes
15 people in other noninstitutional group quarters
Fatal accident statistics in 2014:
Fatal accident count: 1
Vehicles involved in fatal accidents: 1
Fatal accidents caused by drunken drivers: 0
Fatalities: 1
Persons involved in fatal accidents: 1
Pedestrians involved in fatal accidents: 0
Fatal accident statistics in 2011:
Fatal accident count: 1
Vehicles involved in fatal accidents: 1
Fatal accidents caused by drunken drivers: 0
Fatalities: 1
Persons involved in fatal accidents: 3
Pedestrians involved in fatal accidents: 0
Home Mortgage Disclosure Act Aggregated Statistics For Year 2009 (Based on 2 partial tracts)
A) FHA, FSA/RHS & VA Home Purchase Loans
B) Conventional Home Purchase Loans
C) Refinancings
D) Home Improvement Loans
F) Non-occupant Loans on < 5 Family Dwellings (A B C & D)
G) Loans On Manufactured Home Dwelling (A B C & D)
Number
Average Value
Number
Average Value
Number
Average Value
Number
Average Value
Number
Average Value
Number
Average Value
LOANS ORIGINATED
8
$145,844
7
$148,793
52
$152,297
1
$67,880
1
$237,290
1
$62,460
APPLICATIONS APPROVED, NOT ACCEPTED
0
$0
0
$0
2
$183,810
0
$0
0
$0
0
$0
APPLICATIONS DENIED
1
$87,840
1
$116,650
21
$157,716
2
$20,250
0
$0
0
$0
APPLICATIONS WITHDRAWN
1
$265,810
0
$0
8
$172,795
0
$0
1
$61,600
0
$0
FILES CLOSED FOR INCOMPLETENESS
0
$0
0
$0
1
$181,960
0
$0
0
$0
0
$0
Aggregated Statistics For Year 2008 (Based on 2 partial tracts)
A) FHA, FSA/RHS & VA Home Purchase Loans
B) Conventional Home Purchase Loans
C) Refinancings
D) Home Improvement Loans
F) Non-occupant Loans on < 5 Family Dwellings (A B C & D)
G) Loans On Manufactured Home Dwelling (A B C & D)
Number
Average Value
Number
Average Value
Number
Average Value
Number
Average Value
Number
Average Value
Number
Average Value
LOANS ORIGINATED
5
$130,450
7
$124,307
25
$161,994
1
$65,600
1
$98,390
1
$82,420
APPLICATIONS APPROVED, NOT ACCEPTED
0
$0
1
$52,760
2
$147,875
1
$61,030
0
$0
0
$0
APPLICATIONS DENIED
1
$64,170
2
$94,685
15
$143,741
1
$91,830
0
$0
1
$60,750
APPLICATIONS WITHDRAWN
1
$65,600
1
$71,300
6
$171,833
0
$0
0
$0
1
$65,030
FILES CLOSED FOR INCOMPLETENESS
1
$64,460
0
$0
0
$0
0
$0
0
$0
0
$0
Aggregated Statistics For Year 2007 (Based on 2 partial tracts)
A) FHA, FSA/RHS & VA Home Purchase Loans
B) Conventional Home Purchase Loans
C) Refinancings
D) Home Improvement Loans
F) Non-occupant Loans on < 5 Family Dwellings (A B C & D)
G) Loans On Manufactured Home Dwelling (A B C & D)
Number
Average Value
Number
Average Value
Number
Average Value
Number
Average Value
Number
Average Value
Number
Average Value
LOANS ORIGINATED
1
$160,280
18
$154,182
18
$131,002
4
$33,795
3
$66,357
2
$46,200
APPLICATIONS APPROVED, NOT ACCEPTED
0
$0
2
$160,425
4
$152,725
1
$68,450
0
$0
0
$0
APPLICATIONS DENIED
0
$0
3
$160,853
16
$162,457
2
$71,155
1
$28,520
1
$44,210
APPLICATIONS WITHDRAWN
1
$103,530
2
$93,405
8
$145,986
1
$101,530
1
$81,850
1
$43,350
FILES CLOSED FOR INCOMPLETENESS
0
$0
0
$0
2
$193,365
0
$0
0
$0
0
$0
Aggregated Statistics For Year 2006 (Based on 2 partial tracts)
A) FHA, FSA/RHS & VA Home Purchase Loans
B) Conventional Home Purchase Loans
C) Refinancings
D) Home Improvement Loans
F) Non-occupant Loans on < 5 Family Dwellings (A B C & D)
G) Loans On Manufactured Home Dwelling (A B C & D)
Number
Average Value
Number
Average Value
Number
Average Value
Number
Average Value
Number
Average Value
Number
Average Value
LOANS ORIGINATED
1
$86,130
17
$149,277
18
$118,326
1
$66,450
2
$108,375
1
$60,460
APPLICATIONS APPROVED, NOT ACCEPTED
0
$0
1
$285,200
5
$132,048
1
$39,360
0
$0
0
$0
APPLICATIONS DENIED
0
$0
5
$105,410
13
$131,105
2
$64,170
1
$219,890
2
$70,445
APPLICATIONS WITHDRAWN
1
$81,000
3
$120,260
4
$116,790
0
$0
0
$0
0
$0
FILES CLOSED FOR INCOMPLETENESS
0
$0
1
$122,070
1
$172,830
0
$0
0
$0
0
$0
Aggregated Statistics For Year 2005 (Based on 2 partial tracts)
A) FHA, FSA/RHS & VA Home Purchase Loans
B) Conventional Home Purchase Loans
C) Refinancings
D) Home Improvement Loans
F) Non-occupant Loans on < 5 Family Dwellings (A B C & D)
G) Loans On Manufactured Home Dwelling (A B C & D)
Number
Average Value
Number
Average Value
Number
Average Value
Number
Average Value
Number
Average Value
Number
Average Value
LOANS ORIGINATED
1
$93,260
15
$129,880
28
$137,069
3
$47,913
1
$77,290
1
$89,550
APPLICATIONS APPROVED, NOT ACCEPTED
0
$0
3
$58,847
4
$113,795
0
$0
1
$70,440
2
$24,100
APPLICATIONS DENIED
0
$0
3
$145,927
14
$133,412
2
$22,960
0
$0
3
$61,793
APPLICATIONS WITHDRAWN
0
$0
2
$265,380
5
$130,052
1
$152,300
0
$0
1
$57,040
FILES CLOSED FOR INCOMPLETENESS
0
$0
0
$0
1
$199,640
0
$0
0
$0
0
$0
Aggregated Statistics For Year 2004 (Based on 2 partial tracts)
A) FHA, FSA/RHS & VA Home Purchase Loans
B) Conventional Home Purchase Loans
C) Refinancings
D) Home Improvement Loans
F) Non-occupant Loans on < 5 Family Dwellings (A B C & D)
G) Loans On Manufactured Home Dwelling (A B C & D)
Number
Average Value
Number
Average Value
Number
Average Value
Number
Average Value
Number
Average Value
Number
Average Value
LOANS ORIGINATED
0
$0
13
$116,186
31
$133,565
4
$32,870
1
$104,100
1
$58,750
APPLICATIONS APPROVED, NOT ACCEPTED
0
$0
2
$109,375
7
$163,216
0
$0
0
$0
0
$0
APPLICATIONS DENIED
1
$98,680
3
$51,907
13
$119,016
4
$19,535
1
$36,220
1
$62,460
APPLICATIONS WITHDRAWN
0
$0
1
$91,830
7
$127,810
0
$0
0
$0
0
$0
FILES CLOSED FOR INCOMPLETENESS
0
$0
0
$0
3
$122,730
0
$0
0
$0
0
$0
Aggregated Statistics For Year 2003 (Based on 2 partial tracts)
A) FHA, FSA/RHS & VA Home Purchase Loans
B) Conventional Home Purchase Loans
C) Refinancings
D) Home Improvement Loans
F) Non-occupant Loans on < 5 Family Dwellings (A B C & D)
Detailed PMIC statistics for the following Tracts:0520.01
2003 - 2018 National Fire Incident Reporting System (NFIRS) incidents
Based on the data from the years 2003 - 2018 the average number of fire incidents per year is 11. The highest number of reported fires - 28 took place in 2009, and the least - 0 in 2015. The data has an increasing trend.
When looking into fire subcategories, the most incidents belonged to: Structure Fires (40.4%), and Outside Fires (31.5%).
Fire incident types reported to NFIRS in Zip Code 41006


 Nearest zip codes: 41033, 41007, 41040, 45156, 41043, 41001.


 Based on the data from the years 2003 - 2018 the average number of fire incidents per year is 11. The highest number of reported fires - 28 took place in 2009, and the least - 0 in 2015. The data has an increasing trend.
 When looking into fire subcategories, the most incidents belonged to: Structure Fires (40.4%), and Outside Fires (31.5%).