Estimated zip code population in 2022: 1,494 Zip code population in 2010: 1,745 Zip code population in 2000: 1,362
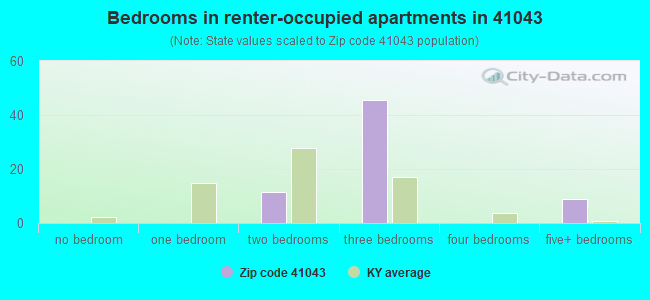
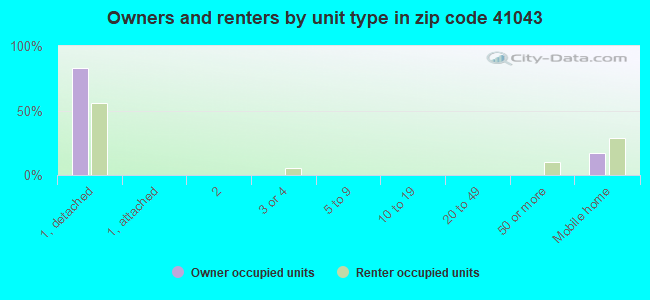
Houses and condos: 747 Renter-occupied apartments: 70
% of renters here:
12%
State:
31%
March 2022 cost of living index in zip code 41043: 81.3 (low, U.S. average is 100)
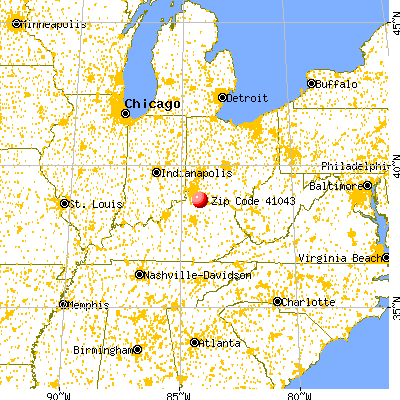
Land area: 50.4 sq. mi. Water area: 1.6 sq. mi.
Population density: 30 people per square mile
(very low).
OSM Map
General Map
Google Map
MSN Map
OSM Map
General Map
Google Map
MSN Map
OSM Map
General Map
Google Map
MSN Map
OSM Map
General Map
Google Map
MSN Map
Please wait while loading the map...
Real estate property taxes paid for housing units in 2022:
This zip code:
0.7% ($1,324)
Kentucky:
0.7% ($1,456)
Median real estate property taxes paid for housing units with mortgages in 2022: $1,834 (0.7%) Median real estate property taxes paid for housing units with no mortgage in 2022: $889 (0.7%)
Business Search- 14 Million verified businesses
Males: 844
(56.6%)
Females: 648
(43.4%)
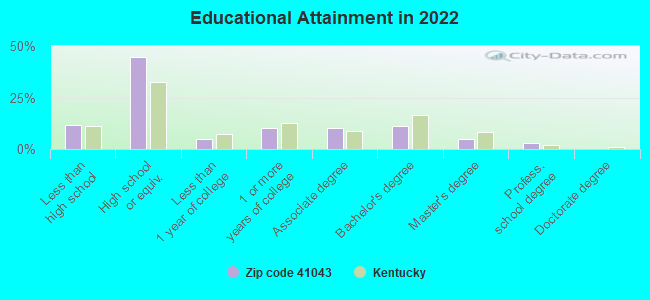
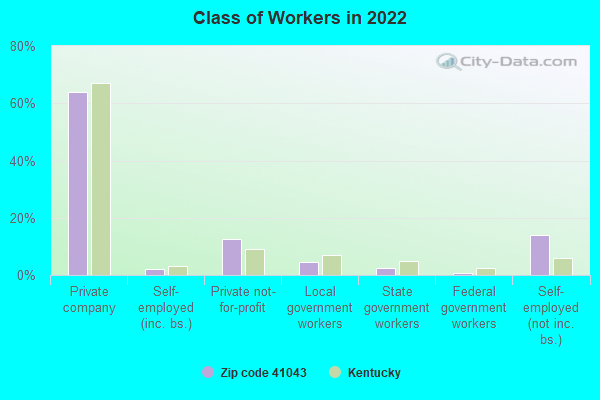
For population 25 years and over in 41043:
High school or higher: 87.2%
Bachelor's degree or higher: 18.6%
Graduate or professional degree: 7.7%
Unemployed: 0.8%
Mean travel time to work (commute): 41.4 minutes
For population 15 years and over in 41043:
Never married: 21.5%
Now married: 67.3%
Separated: 1.3%
Widowed: 4.2%
Divorced: 5.7%
Zip code 41043 compared to state average:
Unemployed percentage significantly below state average.
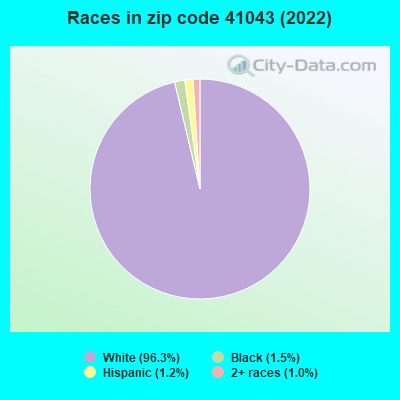
Black race population percentage significantly below state average.
Hispanic race population percentage significantly below state average.
Median age significantly above state average.
Foreign-born population percentage significantly below state average.
Renting percentage significantly below state average.
Length of stay since moving in significantly above state average.
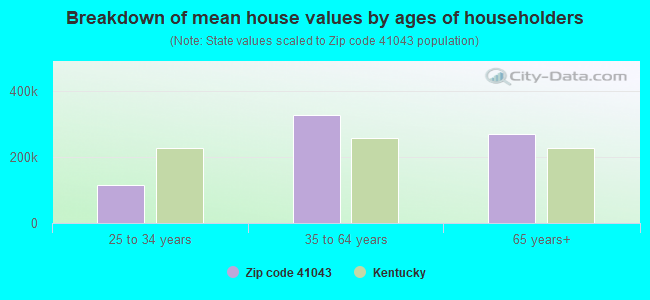
Estimated median house/condo value in 2022: $192,418
41043:
$192,418
Kentucky:
$196,300
According to our research of Kentucky and other state lists, there were 4 registered sex offenders living in 41043 zip code as of May 28, 2024. The ratio of all residents to sex offenders in zip code 41043 is 411 to 1. The ratio of registered sex offenders to all residents in this zip code is near the state average.
Median resident age:
This zip code:
47.7 years
Kentucky median age:
39.4 years
Average household size:
This zip code:
2.6 people
Kentucky:
2.4 people
Averages for the 2020 tax year for zip code 41043, filed in 2021:
Average Adjusted Gross Income (AGI) in 2020: $60,994 (Individual Income Tax Returns)
Here:
$60,994
State:
$61,342
Salary/wage: $57,762 (reported on 84.7% of returns)
Here:
$57,762
State:
$50,827
(% of AGI for various income ranges: 1093.7% for AGIs below $25k, 3490.6% for AGIs $25k-50k, 6580.0% for AGIs $50k-75k, 8128.6% for AGIs $75k-100k, 19682.0% for AGIs $100k-200k)
Taxable interest for individuals: $293 (reported on 16.5% of returns)
This zip code:
$293
Kentucky:
$1,441
(% of AGI for various income ranges: 5.3% for AGIs below $25k, 3.8% for AGIs $25k-50k, 3.1% for AGIs $50k-75k, 21.0% for AGIs $100k-200k)
Ordinary dividends: $2,264 (reported on 12.9% of returns)
Here:
$2,264
State:
$7,388
(% of AGI for various income ranges: 14.7% for AGIs below $25k, 15.4% for AGIs $50k-75k, 201.0% for AGIs $100k-200k)
Net capital gain/loss in AGI: +$5,422 (reported on 10.6% of returns)
Here:
+$5,422
State:
+$19,475
(% of AGI for various income ranges: 15.6% for AGIs $25k-50k, 463.0% for AGIs $100k-200k)
Profit/loss from business: +$9,864 (reported on 12.9% of returns)
Here:
+$9,864
State:
+$11,386
(% of AGI for various income ranges: 121.1% for AGIs below $25k, 126.9% for AGIs $25k-50k, 285.4% for AGIs $50k-75k, 281.0% for AGIs $100k-200k)
Taxable individual retirement arrangement distribution: $16,950 (reported on 9.4% of returns)
41043:
$16,950
Kentucky:
$18,941
(% of AGI for various income ranges: 345.6% for AGIs $25k-50k, 1147.1% for AGIs $75k-100k)
Total itemized deductions: $22,375 (reported on 4.7% of returns)
Here:
$22,375
State:
$32,473
(% of AGI for various income ranges: 895.0% for AGIs $100k-200k)
Charity contributions: $6,167 (reported on 3.5% of returns)
Here:
$6,167
State:
$13,472
(% of AGI for various income ranges: 185.0% for AGIs $100k-200k)
Taxes paid: $7,375 (reported on 4.7% of returns)
41043:
$7,375
State:
$7,830
(% of AGI for various income ranges: 295.0% for AGIs $100k-200k)
Earned income credit: $2,325 (reported on 14.1% of returns)
Here:
$2,325
State:
$2,336
(% of AGI for various income ranges: 91.1% for AGIs below $25k, 66.2% for AGIs $25k-50k)
Percentage of individuals using paid preparers for their 2020 taxes: 94.1%
Here:
94%
State:
94%
(% for various income ranges: 92.0% for AGIs below $25k, 94.7% for AGIs $25k-50k, 94.1% for AGIs $50k-75k, 100.0% for AGIs $75k-100k, 93.8% for AGIs $100k-200k)
Averages for the 2012 tax year for zip code 41043, filed in 2013:
Average Adjusted Gross Income (AGI) in 2012: $46,396 (Individual Income Tax Returns)
Here:
$46,396
State:
$50,814
Salary/wage: $44,846 (reported on 87.3% of returns)
Here:
$44,846
State:
$42,723
(% of AGI for various income ranges: 70.8% for AGIs below $25k, 89.3% for AGIs $25k-50k, 84.0% for AGIs $50k-75k, 83.1% for AGIs $75k-100k, 86.3% for AGIs $100k-200k)
Taxable interest for individuals: $330 (reported on 29.1% of returns)
This zip code:
$330
Kentucky:
$1,381
(% of AGI for various income ranges: 1.1% for AGIs below $25k, 0.1% for AGIs $25k-50k, 0.1% for AGIs $50k-75k, 0.2% for AGIs $75k-100k)
Ordinary dividends: $700 (reported on 13.9% of returns)
Here:
$700
State:
$6,239
(% of AGI for various income ranges: 0.3% for AGIs below $25k, 0.3% for AGIs $25k-50k, 0.3% for AGIs $50k-75k, 0.1% for AGIs $100k-200k)
Net capital gain/loss in AGI: +$1,467 (reported on 15.2% of returns)
Here:
+$1,467
State:
+$11,336
(% of AGI for various income ranges: 1.2% for AGIs below $25k, 0.4% for AGIs $25k-50k, 0.4% for AGIs $50k-75k, 0.7% for AGIs $100k-200k)
Profit/loss from business: +$6,242 (reported on 15.2% of returns)
Here:
+$6,242
State:
+$10,862
(% of AGI for various income ranges: 11.7% for AGIs below $25k, 2.5% for AGIs $25k-50k, 0.9% for AGIs $50k-75k, 1.3% for AGIs $75k-100k)
Taxable individual retirement arrangement distribution: $9,383 (reported on 7.6% of returns)
41043:
$9,383
Kentucky:
$14,296
Total itemized deductions: $17,704 (22% of AGI, reported on 30.4% of returns)
Here:
$17,704
State:
$21,160
Here:
22.1% of AGI
State:
20.0% of AGI
(% of AGI for various income ranges: 9.8% for AGIs $25k-50k, 10.6% for AGIs $50k-75k, 15.6% for AGIs $75k-100k, 15.1% for AGIs $100k-200k)
Charity contributions: $2,829 (reported on 21.5% of returns)
Here:
$2,829
State:
$4,303
(% of AGI for various income ranges: 0.7% for AGIs $25k-50k, 0.9% for AGIs $50k-75k, 1.9% for AGIs $75k-100k, 2.2% for AGIs $100k-200k)
Taxes paid: $6,683 (reported on 30.4% of returns)
41043:
$6,683
State:
$8,496
(% of AGI for various income ranges: 2.5% for AGIs $25k-50k, 3.7% for AGIs $50k-75k, 5.6% for AGIs $75k-100k, 7.0% for AGIs $100k-200k)
Earned income credit: $2,062 (reported on 20.3% of returns)
Here:
$2,062
State:
$2,273
(% of AGI for various income ranges: 6.5% for AGIs below $25k, 1.4% for AGIs $25k-50k)
Percentage of individuals using paid preparers for their 2012 taxes: 68.4%
Here:
68%
State:
60%
(% for various income ranges: 67.9% for AGIs below $25k, 66.7% for AGIs $25k-50k, 78.6% for AGIs $50k-75k, 62.5% for AGIs $75k-100k, 62.5% for AGIs $100k-200k)
Averages for the 2004 tax year for zip code 41043, filed in 2005:
Average Adjusted Gross Income (AGI) in 2004: $37,036 (Individual Income Tax Returns)
Here:
$37,036
State:
$41,540
Salary/wage: $37,316 (reported on 87.3% of returns)
Here:
$37,316
State:
$36,432
(% of AGI for various income ranges: 96.7% for AGIs below $10k, 79.3% for AGIs $10k-25k, 90.2% for AGIs $25k-50k, 94.4% for AGIs $50k-75k, 90.0% for AGIs $75k-100k, 69.0% for AGIs over 100k)
Taxable interest for individuals: $674 (reported on 34.5% of returns)
This zip code:
$674
Kentucky:
$1,571
(% of AGI for various income ranges: 8.6% for AGIs below $10k, 2.2% for AGIs $10k-25k, 0.3% for AGIs $25k-50k, 0.2% for AGIs $50k-75k, 0.1% for AGIs $75k-100k, 0.3% for AGIs over 100k)
Taxable dividends: $943 (reported on 13.0% of returns)
Here:
$943
State:
$3,453
(% of AGI for various income ranges: 2.2% for AGIs below $10k, 0.6% for AGIs $10k-25k, 0.2% for AGIs $25k-50k, 0.1% for AGIs $50k-75k, 0.2% for AGIs $75k-100k, 0.8% for AGIs over 100k)
Net capital gain/loss: +$2,476 (reported on 12.7% of returns)
Here:
+$2,476
State:
+$9,663
(% of AGI for various income ranges: -1.1% for AGIs below $10k, -0.0% for AGIs $10k-25k, 0.5% for AGIs $25k-50k, 0.4% for AGIs $50k-75k, -0.1% for AGIs $75k-100k, 5.4% for AGIs over 100k)
Profit/loss from business: +$5,017 (reported on 14.3% of returns)
Here:
+$5,017
State:
+$9,233
(% of AGI for various income ranges: 6.4% for AGIs below $10k, 6.6% for AGIs $10k-25k, 3.3% for AGIs $25k-50k, 0.6% for AGIs $50k-75k)
IRA payment deduction: $1,545 (reported on 1.4% of returns)
41043:
$1,545
Kentucky:
$2,955
Total itemized deductions: $15,176 (24% of AGI, reported on 32.4% of returns)
Here:
$15,176
State:
$17,474
Here:
24.3% of AGI
State:
21.0% of AGI
(% of AGI for various income ranges: 10.0% for AGIs $10k-25k, 11.4% for AGIs $25k-50k, 13.3% for AGIs $50k-75k, 17.9% for AGIs $75k-100k, 16.2% for AGIs over 100k)
Charity contributions deductions: $2,251 (3% of AGI, reported on 26.6% of returns)
Here:
$2,251
State:
$3,494
Here:
3.4% of AGI
State:
4.0% of AGI
(% of AGI for various income ranges: 0.9% for AGIs $10k-25k, 1.1% for AGIs $25k-50k, 1.3% for AGIs $50k-75k, 2.0% for AGIs $75k-100k, 4.0% for AGIs over 100k)
Total tax: $3,925 (reported on 74.5% of returns)
41043:
$3,925
State:
$6,162
(% of AGI for various income ranges: 4.5% for AGIs below $10k, 4.1% for AGIs $10k-25k, 6.1% for AGIs $25k-50k, 7.8% for AGIs $50k-75k, 8.6% for AGIs $75k-100k, 15.4% for AGIs over 100k)
Earned income credit: $1,632 (reported on 15.5% of returns)
Here:
$1,632
State:
$1,723
Percentage of individuals using paid preparers for their 2004 taxes: 72.9%
Here:
73%
State:
66%
(% for various income ranges: 69.3% for AGIs below $10k, 77.0% for AGIs $10k-25k, 75.7% for AGIs $25k-50k, 69.1% for AGIs $50k-75k, 69.5% for AGIs $75k-100k, 72.0% for AGIs over 100k)
Household received Food Stamps/SNAP in the past 12 months: 50 Household did not receive Food Stamps/SNAP in the past 12 months: 523
Women who had a birth in the past 12 months: 53 (41 now married, 10 unmarried) Women who did not have a birth in the past 12 months: 155 (103 now married, 53 unmarried)
Housing units in zip code 41043 with a mortgage: 248 (49 second mortgage, 5 home equity loan, 31 both second mortgage and home equity loan) Houses without a mortgage: 8
Median monthly owner costs for units with a mortgage: $1,391 Median monthly owner costs for units without a mortgage: $511
Residents with income below the poverty level in 2022:
This zip code:
13.5%
Whole state:
16.5%
Residents with income below 50% of the poverty level in 2022:
This zip code:
3.6%
Whole state:
9.0%
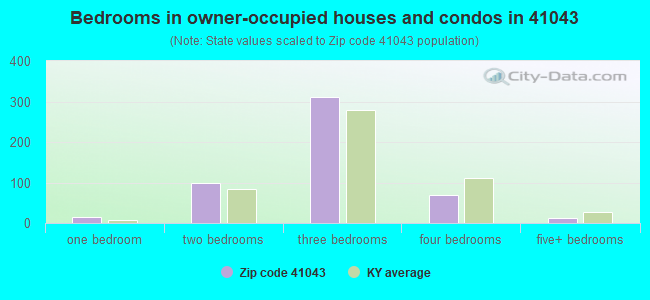
Median number of rooms in houses and condos:
Here:
6.6
State:
6.4
Median number of rooms in apartments:
Here:
6.0
State:
4.4
Notable locations in this zip code not listed on our city pages
Churches in zip code 41043 include: Fisher Tabernacle (A), Fairview Methodist Church (B), Fairview Christian Church (C), Bethany Church (D), New Zion Church (E), Cemetery Chapel (F). Display/hide their locations on the map
Cemeteries: Biddle Cemetery (1), New Zion Cemetery (2), Downard Cemetery (3), Odd Fellows Cemetery (4), Eden Ridge Cemetery (5), Fisher Cemetery (6). Display/hide their locations on the map
Streams, rivers, and creeks: Big Run (A), Wrangling Run (B), Turtle Creek (C), Chalfant Creek (D), Willow Creek (E), Snag Creek (F), Locust Creek (G), Lick Run (H), Jimmie Creek (I). Display/hide their locations on the map
Size of family households: 236 2-persons, 95 3-persons, 101 4-persons, 16 5-persons, 15 6-persons, 2 7-or-more-persons
Size of nonfamily households: 63 1-person, 29 2-persons, 9 3-persons
221 married couples with children.
8 single-parent households (8 women).
99.5% of residents of 41043 zip code speak English at home.
0.5% of residents speak other Indo-European language at home (100% very well).
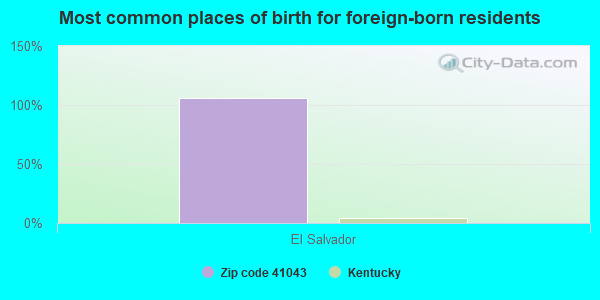
Foreign born population: 18 (1.2%) (100.0% of them are naturalized citizens)
This zip code:
1.2%
Whole state:
4.0%
106%El Salvador
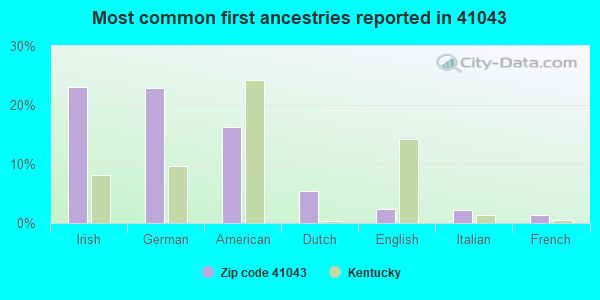
23%Irish
23%German
16%American
5%Dutch
2%English
2%Italian
1%French
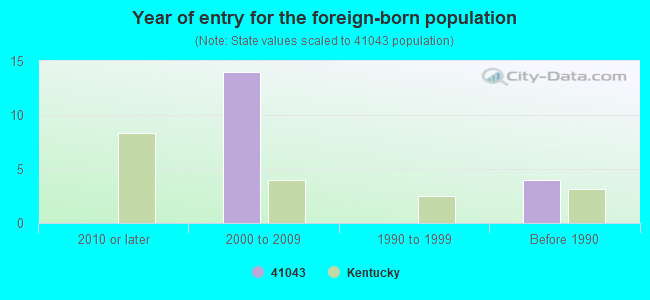
Year of entry for the foreign-born population
02010 or later
142000 to 2009
01990 to 1999
4Before 1990
Facilities with environmental interests located in this zip code:
PERKINS RESIDENCE (RR 2 BOX 79A in FOSTER, KY)
National Pollutant Discharge Elimination System NON-MAJOR (Tracking pollutant discharge elimination systems) - permit Business SIC classification: OPERATORS OF DWELLINGS OTHER THAN APARTMENT BUILDINGS
Housing units lacking complete plumbing facilities: 0.8% Housing units lacking complete kitchen facilities: 0.8%
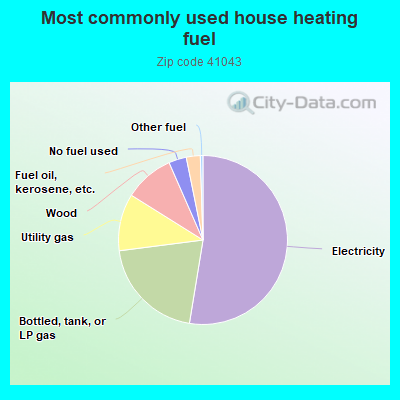
52.9%Electricity
20.5%Bottled, tank, or LP gas
11.0%Utility gas
9.6%Wood
3.4%No fuel used
2.7%Fuel oil, kerosene, etc.
0.5%Other fuel
Population in 1990: 1,479.
Place of birth for U.S.-born residents:
This state: 1,154
Northeast: 25
Midwest: 195
South: 86
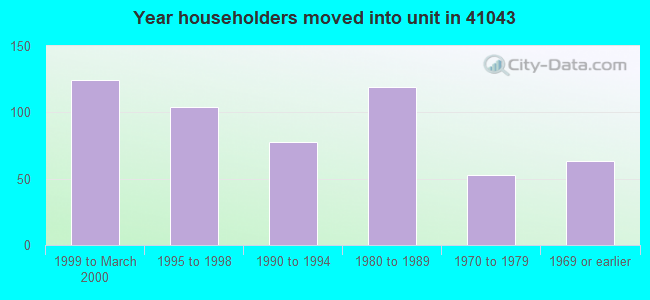
67% of the 41043 zip code residents lived in the same house 5 years ago. Out of people who lived in different houses, 45% lived in this county. Out of people who lived in different counties, 50% lived in Kentucky.
93% of the 41043 zip code residents lived in the same house 1 year ago. Out of people who lived in different houses, 49% moved from this county. Out of people who lived in different houses, 48% moved from different county within same state.
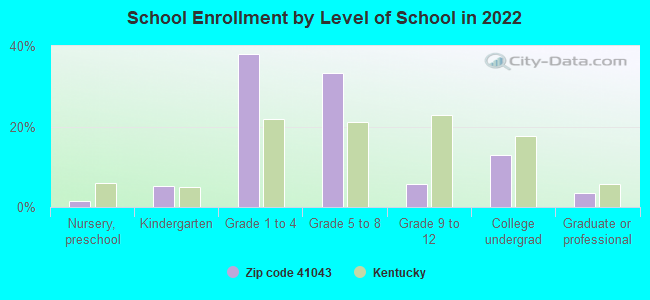
Private vs. public school enrollment:
Students in private schools in grades 1 to 8 (elementary and middle school):
Here:
0.0%
Kentucky:
17.2%
Students in private schools in grades 9 to 12 (high school): 12
Here:
100.0%
Kentucky:
15.2%
Students in private undergraduate colleges:
Here:
0.0%
Kentucky:
19.6%
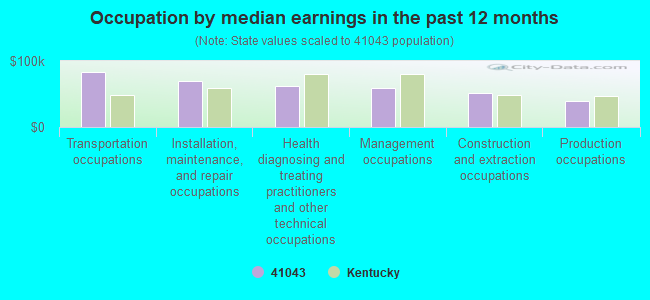
Occupation by median earnings in the past 12 months ($)
82,892Transportation occupations
69,809Installation, maintenance, and repair occupations
62,793Health diagnosing and treating practitioners and other technical occupations
59,349Management occupations
51,510Construction and extraction occupations
39,006Production occupations
Top industries in this zip code by the number of employees in 2005:
Construction: New Single-Family Housing Construction (except Operative Builders) (5-9 employees: 1 establishment)
Other Services (except Public Administration): Religious Organizations (1-4: 3)
2002 - 2018 National Fire Incident Reporting System (NFIRS) incidents
Based on the data from the years 2002 - 2018 the average number of fires per year is 7. The highest number of fires - 16 took place in 2010, and the least - 2 in 2011. The data has a decreasing trend.
When looking into fire subcategories, the most reports belonged to: Structure Fires (39.0%), and Outside Fires (29.7%).
Fire incident types reported to NFIRS in Zip Code 41043


 Nearest zip codes: 45156, 45112, 45153, 45120, 41006, 41007.


 Based on the data from the years 2002 - 2018 the average number of fires per year is 7. The highest number of fires - 16 took place in 2010, and the least - 2 in 2011. The data has a decreasing trend.
 When looking into fire subcategories, the most reports belonged to: Structure Fires (39.0%), and Outside Fires (29.7%).