Estimated zip code population in 2022: 5,542 Zip code population in 2010: 5,407 Zip code population in 2000: 4,881
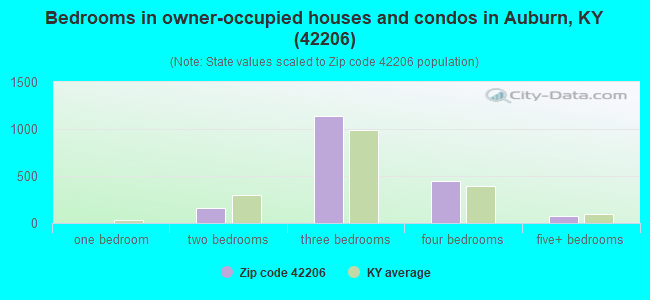
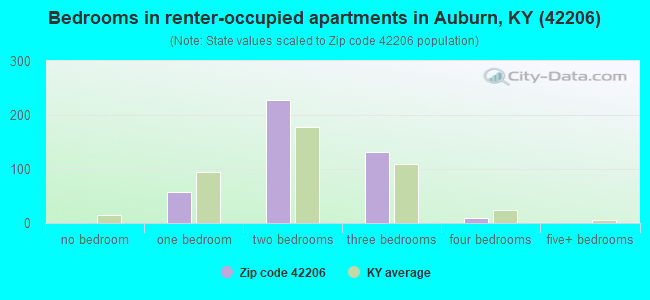
Houses and condos: 2,353 Renter-occupied apartments: 427
% of renters here:
19%
State:
31%
March 2022 cost of living index in zip code 42206: 81.0 (low, U.S. average is 100)
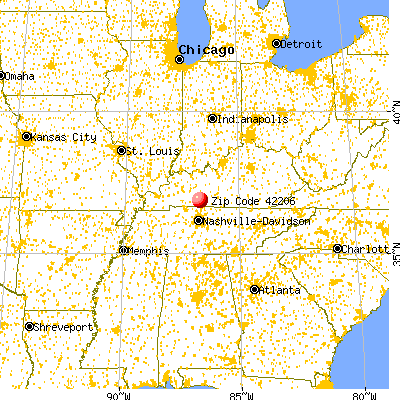
Land area: 118.5 sq. mi. Water area: 0.6 sq. mi.
Population density: 47 people per square mile
(very low).
OSM Map
General Map
Google Map
MSN Map
OSM Map
General Map
Google Map
MSN Map
OSM Map
General Map
Google Map
MSN Map
OSM Map
General Map
Google Map
MSN Map
Please wait while loading the map...
Real estate property taxes paid for housing units in 2022:
This zip code:
0.7% ($982)
Kentucky:
0.7% ($1,456)
Median real estate property taxes paid for housing units with mortgages in 2022: $1,198 (0.7%) Median real estate property taxes paid for housing units with no mortgage in 2022: $580 (0.5%)
Estimated median house/condo value in 2022: $143,177
42206:
$143,177
Kentucky:
$196,300
According to our research of Kentucky and other state lists, there were 10 registered sex offenders living in 42206 zip code as of May 28, 2024. The ratio of all residents to sex offenders in zip code 42206 is 604 to 1. The ratio of registered sex offenders to all residents in this zip code is lower than the state average.
Median resident age:
This zip code:
38.7 years
Kentucky median age:
39.4 years
Average household size:
This zip code:
2.4 people
Kentucky:
2.4 people
Averages for the 2020 tax year for zip code 42206, filed in 2021:
Average Adjusted Gross Income (AGI) in 2020: $52,280 (Individual Income Tax Returns)
Here:
$52,280
State:
$61,342
Salary/wage: $45,339 (reported on 80.5% of returns)
Here:
$45,339
State:
$50,827
(% of AGI for various income ranges: 1238.3% for AGIs below $25k, 3701.3% for AGIs $25k-50k, 6591.7% for AGIs $50k-75k, 8958.0% for AGIs $75k-100k, 14071.2% for AGIs $100k-200k)
Taxable interest for individuals: $904 (reported on 21.1% of returns)
This zip code:
$904
Kentucky:
$1,441
(% of AGI for various income ranges: 15.0% for AGIs below $25k, 18.8% for AGIs $25k-50k, 25.0% for AGIs $50k-75k, 21.5% for AGIs $75k-100k, 56.2% for AGIs $100k-200k)
Ordinary dividends: $2,619 (reported on 11.0% of returns)
Here:
$2,619
State:
$7,388
(% of AGI for various income ranges: 8.8% for AGIs below $25k, 31.5% for AGIs $25k-50k, 18.0% for AGIs $50k-75k, 28.5% for AGIs $75k-100k, 245.0% for AGIs $100k-200k)
Net capital gain/loss in AGI: +$9,981 (reported on 10.6% of returns)
Here:
+$9,981
State:
+$19,475
(% of AGI for various income ranges: 9.8% for AGIs below $25k, 46.2% for AGIs $25k-50k, 55.3% for AGIs $50k-75k, 198.5% for AGIs $75k-100k, 852.5% for AGIs $100k-200k)
Profit/loss from business: +$14,034 (reported on 19.1% of returns)
Here:
+$14,034
State:
+$11,386
(% of AGI for various income ranges: 160.7% for AGIs below $25k, 273.1% for AGIs $25k-50k, 501.7% for AGIs $50k-75k, 443.0% for AGIs $75k-100k, 1206.2% for AGIs $100k-200k)
Taxable individual retirement arrangement distribution: $12,753 (reported on 7.7% of returns)
42206:
$12,753
Kentucky:
$18,941
(% of AGI for various income ranges: 36.0% for AGIs below $25k, 57.9% for AGIs $25k-50k, 161.3% for AGIs $50k-75k, 269.0% for AGIs $75k-100k, 566.9% for AGIs $100k-200k)
Total itemized deductions: $28,071 (reported on 2.8% of returns)
Here:
$28,071
State:
$32,473
(% of AGI for various income ranges: 142.1% for AGIs $25k-50k, 801.9% for AGIs $100k-200k)
Charity contributions: $14,467 (reported on 2.4% of returns)
Here:
$14,467
State:
$13,472
(% of AGI for various income ranges: 542.5% for AGIs $100k-200k)
Taxes paid: $6,800 (reported on 2.8% of returns)
42206:
$6,800
State:
$7,830
(% of AGI for various income ranges: 32.7% for AGIs $25k-50k, 199.4% for AGIs $100k-200k)
Earned income credit: $2,457 (reported on 19.1% of returns)
Here:
$2,457
State:
$2,336
(% of AGI for various income ranges: 122.8% for AGIs below $25k, 87.1% for AGIs $25k-50k)
Percentage of individuals using paid preparers for their 2020 taxes: 93.5%
Here:
93%
State:
94%
(% for various income ranges: 94.0% for AGIs below $25k, 90.5% for AGIs $25k-50k, 95.3% for AGIs $50k-75k, 92.6% for AGIs $75k-100k, 96.2% for AGIs $100k-200k, 100.0% for AGIs over 200k)
Averages for the 2012 tax year for zip code 42206, filed in 2013:
Average Adjusted Gross Income (AGI) in 2012: $41,177 (Individual Income Tax Returns)
Here:
$41,177
State:
$50,814
Salary/wage: $36,383 (reported on 84.4% of returns)
Here:
$36,383
State:
$42,723
(% of AGI for various income ranges: 75.2% for AGIs below $25k, 80.3% for AGIs $25k-50k, 81.0% for AGIs $50k-75k, 80.0% for AGIs $75k-100k, 81.6% for AGIs $100k-200k)
Taxable interest for individuals: $1,024 (reported on 23.8% of returns)
This zip code:
$1,024
Kentucky:
$1,381
(% of AGI for various income ranges: 0.9% for AGIs below $25k, 0.6% for AGIs $25k-50k, 0.5% for AGIs $50k-75k, 0.5% for AGIs $75k-100k, 1.0% for AGIs $100k-200k)
Ordinary dividends: $1,957 (reported on 10.0% of returns)
Here:
$1,957
State:
$6,239
(% of AGI for various income ranges: 0.6% for AGIs below $25k, 0.3% for AGIs $25k-50k, 0.5% for AGIs $50k-75k, 0.4% for AGIs $75k-100k, 1.0% for AGIs $100k-200k)
Net capital gain/loss in AGI: +$2,196 (reported on 12.1% of returns)
Here:
+$2,196
State:
+$11,336
(% of AGI for various income ranges: 0.7% for AGIs below $25k, 0.3% for AGIs $25k-50k, 0.6% for AGIs $50k-75k, 0.7% for AGIs $75k-100k, 1.5% for AGIs $100k-200k)
Profit/loss from business: +$10,719 (reported on 18.6% of returns)
Here:
+$10,719
State:
+$10,862
(% of AGI for various income ranges: 11.7% for AGIs below $25k, 7.0% for AGIs $25k-50k, 2.1% for AGIs $50k-75k, 3.7% for AGIs $75k-100k, 3.1% for AGIs $100k-200k)
Taxable individual retirement arrangement distribution: $10,475 (reported on 6.9% of returns)
42206:
$10,475
Kentucky:
$14,296
(% of AGI for various income ranges: 1.9% for AGIs below $25k, 1.5% for AGIs $25k-50k, 1.5% for AGIs $50k-75k, 1.9% for AGIs $75k-100k, 3.2% for AGIs $100k-200k)
Total itemized deductions: $16,481 (22% of AGI, reported on 22.9% of returns)
Here:
$16,481
State:
$21,160
Here:
22.5% of AGI
State:
20.0% of AGI
(% of AGI for various income ranges: 3.4% for AGIs below $25k, 8.3% for AGIs $25k-50k, 9.2% for AGIs $50k-75k, 11.1% for AGIs $75k-100k, 17.5% for AGIs $100k-200k)
Charity contributions: $4,290 (reported on 18.2% of returns)
Here:
$4,290
State:
$4,303
(% of AGI for various income ranges: 0.6% for AGIs below $25k, 1.5% for AGIs $25k-50k, 1.8% for AGIs $50k-75k, 2.2% for AGIs $75k-100k, 4.3% for AGIs $100k-200k)
Taxes paid: $5,574 (reported on 22.9% of returns)
42206:
$5,574
State:
$8,496
(% of AGI for various income ranges: 0.5% for AGIs below $25k, 2.3% for AGIs $25k-50k, 2.9% for AGIs $50k-75k, 4.3% for AGIs $75k-100k, 7.2% for AGIs $100k-200k)
Earned income credit: $2,353 (reported on 22.9% of returns)
Here:
$2,353
State:
$2,273
(% of AGI for various income ranges: 7.4% for AGIs below $25k, 1.4% for AGIs $25k-50k)
Percentage of individuals using paid preparers for their 2012 taxes: 65.8%
Here:
66%
State:
60%
(% for various income ranges: 59.8% for AGIs below $25k, 65.6% for AGIs $25k-50k, 71.1% for AGIs $50k-75k, 77.8% for AGIs $75k-100k, 75.0% for AGIs $100k-200k, 100.0% for AGIs over 200k)
Averages for the 2004 tax year for zip code 42206, filed in 2005:
Average Adjusted Gross Income (AGI) in 2004: $33,955 (Individual Income Tax Returns)
Here:
$33,955
State:
$41,540
Salary/wage: $32,562 (reported on 85.3% of returns)
Here:
$32,562
State:
$36,432
(% of AGI for various income ranges: 119.1% for AGIs below $10k, 80.0% for AGIs $10k-25k, 85.8% for AGIs $25k-50k, 84.6% for AGIs $50k-75k, 79.6% for AGIs $75k-100k, 60.2% for AGIs over 100k)
Taxable interest for individuals: $1,120 (reported on 31.6% of returns)
This zip code:
$1,120
Kentucky:
$1,571
(% of AGI for various income ranges: 5.6% for AGIs below $10k, 1.9% for AGIs $10k-25k, 1.0% for AGIs $25k-50k, 0.4% for AGIs $50k-75k, 0.6% for AGIs $75k-100k, 1.3% for AGIs over 100k)
Taxable dividends: $981 (reported on 12.4% of returns)
Here:
$981
State:
$3,453
(% of AGI for various income ranges: 0.6% for AGIs below $10k, 0.4% for AGIs $10k-25k, 0.4% for AGIs $25k-50k, 0.3% for AGIs $50k-75k, 0.4% for AGIs $75k-100k, 0.5% for AGIs over 100k)
Net capital gain/loss: +$3,822 (reported on 11.2% of returns)
Here:
+$3,822
State:
+$9,663
(% of AGI for various income ranges: 1.7% for AGIs below $10k, 0.2% for AGIs $10k-25k, 0.8% for AGIs $25k-50k, 1.3% for AGIs $50k-75k, 0.9% for AGIs $75k-100k, 4.7% for AGIs over 100k)
Profit/loss from business: +$6,829 (reported on 19.9% of returns)
Here:
+$6,829
State:
+$9,233
(% of AGI for various income ranges: 12.5% for AGIs below $10k, 8.4% for AGIs $10k-25k, 3.0% for AGIs $25k-50k, 2.9% for AGIs $50k-75k, 4.1% for AGIs $75k-100k, 2.2% for AGIs over 100k)
IRA payment deduction: $3,238 (reported on 2.0% of returns)
42206:
$3,238
Kentucky:
$2,955
Total itemized deductions: $13,458 (22% of AGI, reported on 24.5% of returns)
Here:
$13,458
State:
$17,474
Here:
22.5% of AGI
State:
21.0% of AGI
(% of AGI for various income ranges: 9.1% for AGIs below $10k, 5.9% for AGIs $10k-25k, 6.8% for AGIs $25k-50k, 11.3% for AGIs $50k-75k, 13.7% for AGIs $75k-100k, 13.5% for AGIs over 100k)
Charity contributions deductions: $3,184 (5% of AGI, reported on 20.4% of returns)
Here:
$3,184
State:
$3,494
Here:
5.0% of AGI
State:
4.0% of AGI
(% of AGI for various income ranges: 1.1% for AGIs $10k-25k, 1.2% for AGIs $25k-50k, 2.0% for AGIs $50k-75k, 2.9% for AGIs $75k-100k, 3.7% for AGIs over 100k)
Total tax: $3,549 (reported on 74.8% of returns)
42206:
$3,549
State:
$6,162
(% of AGI for various income ranges: 4.5% for AGIs below $10k, 4.4% for AGIs $10k-25k, 5.7% for AGIs $25k-50k, 8.1% for AGIs $50k-75k, 9.7% for AGIs $75k-100k, 16.3% for AGIs over 100k)
Earned income credit: $1,748 (reported on 19.5% of returns)
Here:
$1,748
State:
$1,723
Percentage of individuals using paid preparers for their 2004 taxes: 71.8%
Here:
72%
State:
66%
(% for various income ranges: 64.1% for AGIs below $10k, 71.3% for AGIs $10k-25k, 73.1% for AGIs $25k-50k, 76.0% for AGIs $50k-75k, 77.5% for AGIs $75k-100k, 80.4% for AGIs over 100k)
Likely homosexual households (counted as self-reported same-sex unmarried-partner households)
Lesbian couples: 0.0% of all households
Gay men: 0.5% of all households
Household received Food Stamps/SNAP in the past 12 months: 168 Household did not receive Food Stamps/SNAP in the past 12 months: 2,056
Women who had a birth in the past 12 months: 48 (31 now married, 17 unmarried) Women who did not have a birth in the past 12 months: 1,163 (621 now married, 544 unmarried)
Housing units in zip code 42206 with a mortgage: 1,054 (46 second mortgage, 13 home equity loan, 36 both second mortgage and home equity loan) Houses without a mortgage: 20
Median monthly owner costs for units with a mortgage: $1,187 Median monthly owner costs for units without a mortgage: $379
Residents with income below the poverty level in 2022:
This zip code:
15.1%
Whole state:
16.5%
Residents with income below 50% of the poverty level in 2022:
This zip code:
11.9%
Whole state:
9.0%
Median number of rooms in houses and condos:
Here:
6.5
State:
6.4
Median number of rooms in apartments:
Here:
5.0
State:
4.4
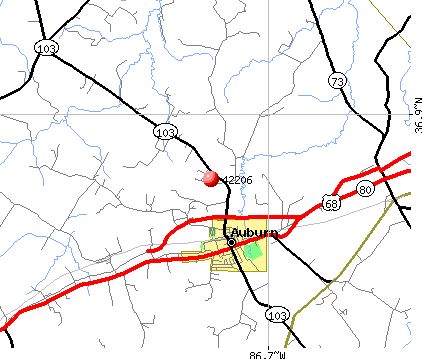
Notable locations in this zip code not listed on our city pages
Churches in zip code 42206 include: Friendship Church (A), Liberty Church (B), New Friendship Church (C), New Harmony Church (D), Plainview Church (E), Cave Spring Church (F), Duncan Chapel (G). Display/hide their locations on the map
In group quarters: 76 (-1 institutionalized population)
Size of family households: 752 2-persons, 298 3-persons, 142 4-persons, 139 5-persons, 53 6-persons, 24 7-or-more-persons
Size of nonfamily households: 636 1-person, 182 2-persons
923 married couples with children.
254 single-parent households (182 men, 72 women).
95.9% of residents of 42206 zip code speak English at home.
1.0% of residents speak Spanish at home (70% very well, 28% well, 2% not well).
2.9% of residents speak other Indo-European language at home (68% very well, 32% well).
0.3% of residents speak Asian or Pacific Island language at home (100% very well).
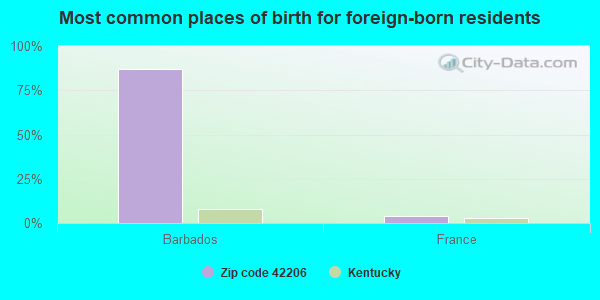
Foreign born population: 50 (0.9%) (0.0% of them are naturalized citizens)
:
0.9%
Whole state:
4.0%
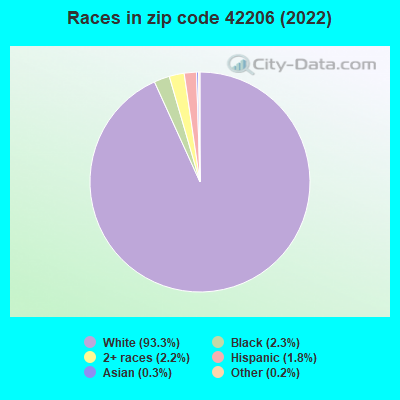
87%Barbados
4%France
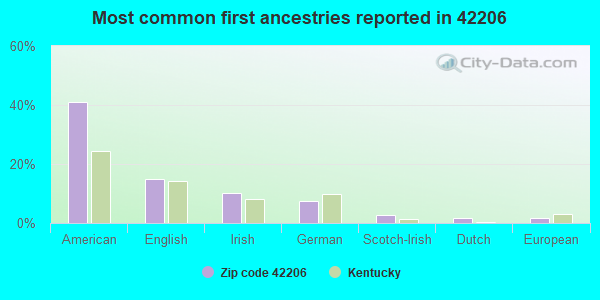
41%American
15%English
10%Irish
7%German
3%Scotch-Irish
2%Dutch
2%European
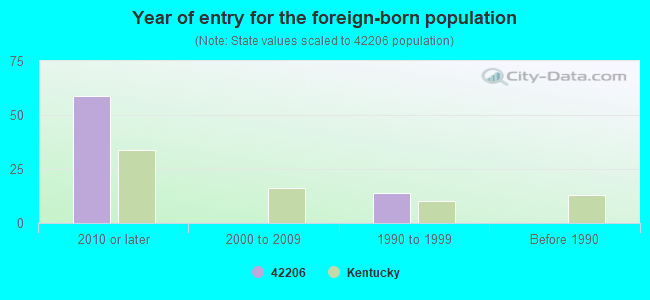
Year of entry for the foreign-born population
592010 or later
02000 to 2009
141990 to 1999
0Before 1990
Facilities with environmental interests located in this zip code:
AUBURN ELEMENTARY SCHOOL (221 COLLEGE ST in AUBURN, KY)
(National Center for Education Statistics) - STATE ID-071351012 Organizations: LOGAN COUNTY (SCHOOL DISTRICT)
AUBURN STP (334 EAST MAIN STREET in AUBURN, KY)
National Pollutant Discharge Elimination System NON-MAJOR (Tracking pollutant discharge elimination systems) - permit (Resource Conservation and Recovery Act (tracking hazardous waste)) Business SIC classification: SEWERAGE SYSTEMS Business NAICS classification: SHEER HOSIERY MILLS. Organizations: CITY OF AUBURN (CONTACT/OWNER)
Alternative names: AUBURN WASTE WATER TREATMENT PLANT, CIMA AUBURN STP
AUBURN HOSIERY MILLS (113 N. MAIN ST. in AUBURN, KY)
(Resource Conservation and Recovery Act (tracking hazardous waste)) TRI REPORTER (Tracking of toxic chemicals releasing facilities) Business SIC classification: HOSIERY Organizations: AUBURN HOSIERY MILLS INC. (CONTACT/OWNER)
CALDWELL LACE LEATHER CO., INC. (111 EAST CALDWELL STREET in AUBURN, KY)
SUPERFUND NPL (Superfund database) (Resource Conservation and Recovery Act (tracking hazardous waste)) Business NAICS classification: ALL OTHER LEATHER GOOD MANUFACTURING.; ALL OTHER MISCELLANEOUS NONMETALLIC MINERAL PRODUCT MANUFACTURING. Organizations: CALDWELL LACE COMPANY (CONTACT/OWNER)
CALDWELL INDUSTRIES INC (100 ALLEN ST in AUBURN, KY)
(Resource Conservation and Recovery Act (tracking hazardous waste))
MINIT MART #93 (MAIN STREET HWY 68 & 80 in AUBURN, KY)
(Resource Conservation and Recovery Act (tracking hazardous waste)) Organizations: KEY OIL COMPANY (CONTACT/OWNER)
NAN'S RESTAURANT (339 E MAIN ST in AUBURN, KY)
(Resource Conservation and Recovery Act (tracking hazardous waste)) Organizations: NAN COLLIER (CONTACT/OWNER)
PLAINVIEW MENNONITE SCHOOL (RT. 2 in AUBURN, KY)
COMPLIANCE ACTIVITY (Tracking inspections of insecticide, fungicide, and rodenticide, and toxic substances)
Housing units lacking complete plumbing facilities: 1.0% Housing units lacking complete kitchen facilities: 1.2%
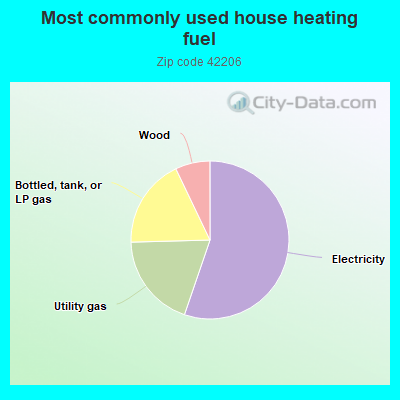
55.2%Electricity
19.3%Utility gas
18.3%Bottled, tank, or LP gas
7.1%Wood
Population in 1990: 4,192. Population change in the 1990s: +689 (+16.4%).
Place of birth for U.S.-born residents:
This state: 3,583
Northeast: 198
Midwest: 555
South: 1,073
West: 75
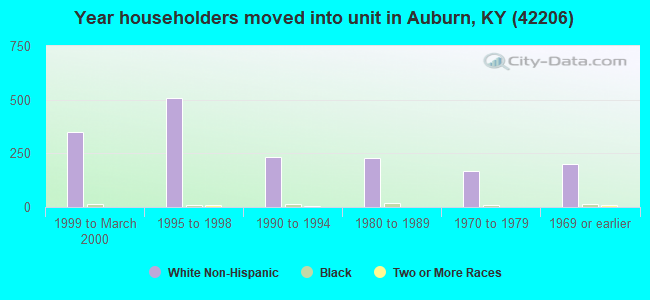
54% of the 42206 zip code residents lived in the same house 5 years ago. Out of people who lived in different houses, 55% lived in this county. Out of people who lived in different counties, 50% lived in Kentucky.
92% of the 42206 zip code residents lived in the same house 1 year ago. Out of people who lived in different houses, 51% moved from this county. Out of people who lived in different houses, 42% moved from different county within same state. Out of people who lived in different houses, 6% moved from different state.
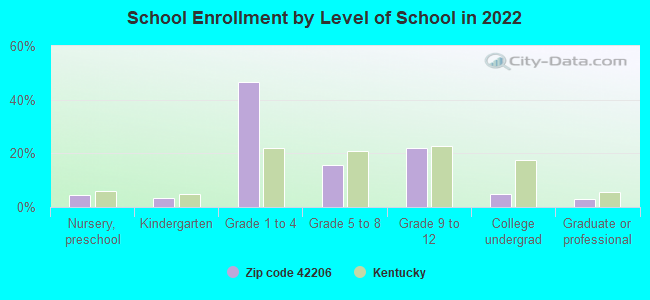
Private vs. public school enrollment:
Students in private schools in grades 1 to 8 (elementary and middle school): 278
Here:
39.5%
Kentucky:
17.2%
Students in private schools in grades 9 to 12 (high school): 3
Here:
1.5%
Kentucky:
15.2%
Students in private undergraduate colleges: 8
Here:
15.3%
Kentucky:
19.6%
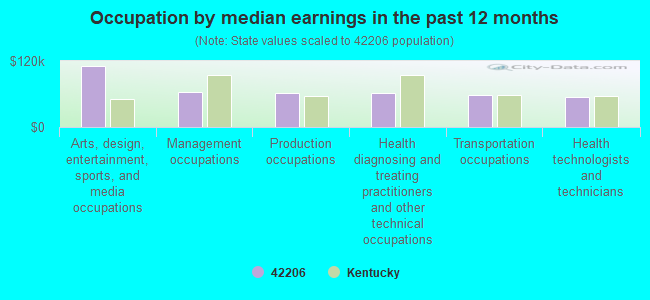
Occupation by median earnings in the past 12 months ($)
111,075Arts, design, entertainment, sports, and media occupations
63,439Management occupations
61,880Production occupations
60,963Health diagnosing and treating practitioners and other technical occupations
57,330Transportation occupations
54,386Health technologists and technicians
Companies with federal contracts located in this zip code:
BENITA DOUGHTY (201 WALNUT STREET in AUBURN, TN; small business)
$62,928 with Army for Other Medical Services. Signed on 2000-11-08. Completion date: 2001-09-30.
Top industries in this zip code by the number of employees in 2005:
Health Care and Social Assistance: Nursing Care Facilities (50-99 employees: 1 establishment)
Finance and Insurance: Commercial Banking (10-19: 1, 5-9: 1)
Other Services (except Public Administration): Religious Organizations (5-9: 1, 1-4: 6)
People in group quarters in 2010:
53 people in nursing facilities/skilled-nursing facilities
15 people in other noninstitutional facilities
People in group quarters in 2000:
66 people in nursing homes
Fatal accident statistics in 2014:
Fatal accident count: 1
Vehicles involved in fatal accidents: 2
Fatal accidents caused by drunken drivers: 0
Fatalities: 1
Persons involved in fatal accidents: 6
Pedestrians involved in fatal accidents: 0
Fatal accident statistics in 2013:
Fatal accident count: 1
Vehicles involved in fatal accidents: 1
Fatal accidents caused by drunken drivers: 0
Fatalities: 1
Persons involved in fatal accidents: 1
Pedestrians involved in fatal accidents: 0
2002 - 2018 National Fire Incident Reporting System (NFIRS) incidents
According to the data from the years 2002 - 2018 the average number of fires per year is 11. The highest number of reported fires - 28 took place in 2010, and the least - 1 in 2002. The data has an increasing trend.
When looking into fire subcategories, the most reports belonged to: Structure Fires (50.8%), and Outside Fires (30.9%).
Fire incident types reported to NFIRS in Zip Code 42206


 Nearest zip codes: 42276, 42274, 42170, 42256, 42202, 42134.


 According to the data from the years 2002 - 2018 the average number of fires per year is 11. The highest number of reported fires - 28 took place in 2010, and the least - 1 in 2002. The data has an increasing trend.
 When looking into fire subcategories, the most reports belonged to: Structure Fires (50.8%), and Outside Fires (30.9%).