Estimated zip code population in 2022: 1,482 Zip code population in 2010: 1,852 Zip code population in 2000: 2,007
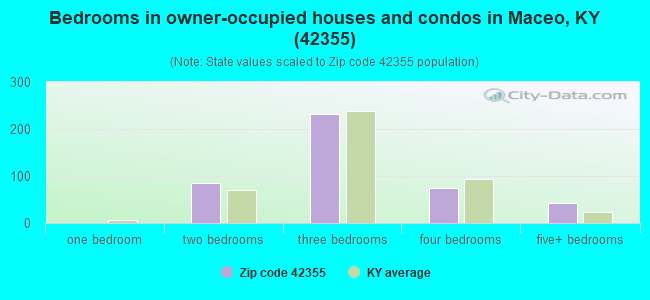
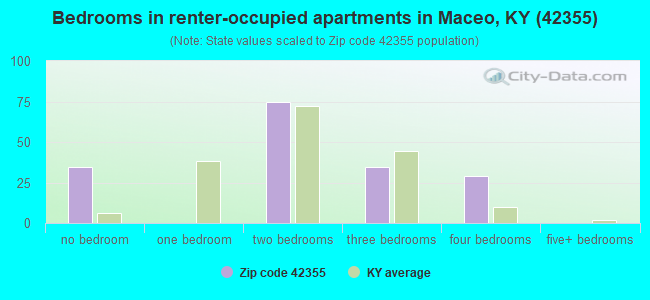
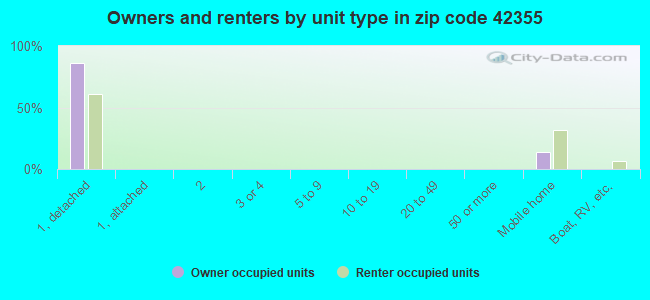
Houses and condos: 690 Renter-occupied apartments: 177
% of renters here:
29%
State:
31%
March 2022 cost of living index in zip code 42355: 80.7 (low, U.S. average is 100)
Land area: 28.6 sq. mi. Water area: 0.4 sq. mi.
Population density: 52 people per square mile
(very low).
OSM Map
General Map
Google Map
MSN Map
OSM Map
General Map
Google Map
MSN Map
OSM Map
General Map
Google Map
MSN Map
OSM Map
General Map
Google Map
MSN Map
Please wait while loading the map...
Real estate property taxes paid for housing units in 2022:
This zip code:
0.9% ($1,134)
Kentucky:
0.7% ($1,456)
Median real estate property taxes paid for housing units with mortgages in 2022: $1,372 (0.9%) Median real estate property taxes paid for housing units with no mortgage in 2022: $877 (1.1%)
Business Search- 14 Million verified businesses
Males: 720
(48.6%)
Females: 761
(51.4%)
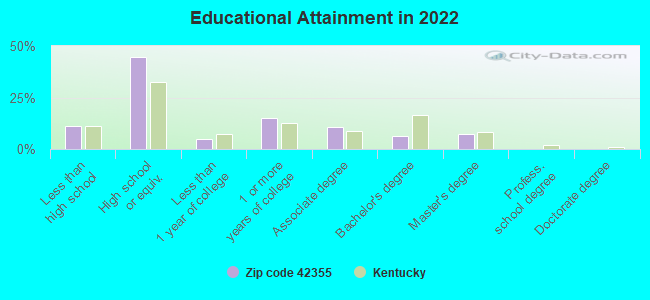
For population 25 years and over in 42355:
High school or higher: 87.2%
Bachelor's degree or higher: 13.4%
Graduate or professional degree: 7.3%
Unemployed: 3.2%
Mean travel time to work (commute): 24.5 minutes
For population 15 years and over in 42355:
Never married: 22.3%
Now married: 61.7%
Separated: 2.8%
Widowed: 2.6%
Divorced: 10.7%
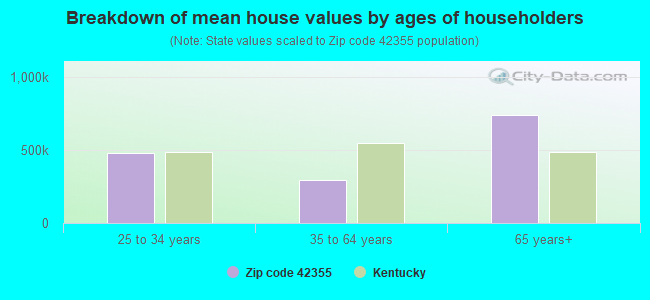
Zip code 42355 compared to state average:
Median house value below state average.
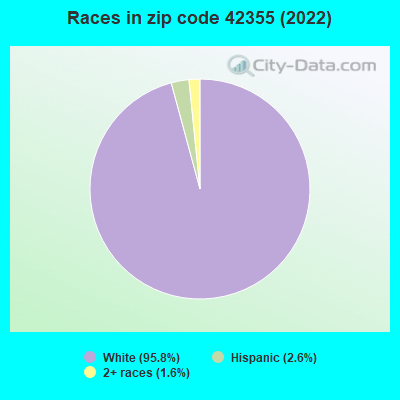
Black race population percentage significantly below state average.
Foreign-born population percentage significantly below state average.
Length of stay since moving in significantly above state average.
Percentage of population with a bachelor's degree or higher below state average.
Averages for the 2020 tax year for zip code 42355, filed in 2021:
Average Adjusted Gross Income (AGI) in 2020: $58,926 (Individual Income Tax Returns)
Here:
$58,926
State:
$61,342
Salary/wage: $48,873 (reported on 81.7% of returns)
Here:
$48,873
State:
$50,827
(% of AGI for various income ranges: 1088.1% for AGIs below $25k, 3549.3% for AGIs $25k-50k, 6472.5% for AGIs $50k-75k, 9020.0% for AGIs $75k-100k, 13978.6% for AGIs $100k-200k)
Taxable interest for individuals: $433 (reported on 22.0% of returns)
This zip code:
$433
Kentucky:
$1,441
(% of AGI for various income ranges: 5.2% for AGIs below $25k, 10.0% for AGIs $25k-50k, 16.2% for AGIs $50k-75k, 10.0% for AGIs $75k-100k, 45.7% for AGIs $100k-200k)
Ordinary dividends: $2,833 (reported on 14.6% of returns)
Here:
$2,833
State:
$7,388
(% of AGI for various income ranges: 22.9% for AGIs below $25k, 25.3% for AGIs $25k-50k, 77.5% for AGIs $50k-75k, 274.3% for AGIs $100k-200k)
Net capital gain/loss in AGI: +$5,142 (reported on 14.6% of returns)
Here:
+$5,142
State:
+$19,475
(% of AGI for various income ranges: 8.1% for AGIs below $25k, 62.7% for AGIs $25k-50k, 140.0% for AGIs $50k-75k, 562.9% for AGIs $100k-200k)
Profit/loss from business: +$6,018 (reported on 13.4% of returns)
Here:
+$6,018
State:
+$11,386
(% of AGI for various income ranges: 49.0% for AGIs below $25k, 103.3% for AGIs $25k-50k, 131.2% for AGIs $50k-75k, 427.1% for AGIs $100k-200k)
Taxable individual retirement arrangement distribution: $16,511 (reported on 11.0% of returns)
42355:
$16,511
Kentucky:
$18,941
(% of AGI for various income ranges: 464.7% for AGIs $25k-50k, 1127.1% for AGIs $75k-100k)
Total itemized deductions: $28,867 (reported on 3.7% of returns)
Here:
$28,867
State:
$32,473
(% of AGI for various income ranges: 1082.5% for AGIs $50k-75k)
Taxes paid: $6,733 (reported on 3.7% of returns)
42355:
$6,733
State:
$7,830
(% of AGI for various income ranges: 252.5% for AGIs $50k-75k)
Earned income credit: $2,100 (reported on 17.1% of returns)
Here:
$2,100
State:
$2,336
(% of AGI for various income ranges: 76.2% for AGIs below $25k, 89.3% for AGIs $25k-50k)
Percentage of individuals using paid preparers for their 2020 taxes: 93.9%
Here:
94%
State:
94%
(% for various income ranges: 92.9% for AGIs below $25k, 95.0% for AGIs $25k-50k, 91.7% for AGIs $50k-75k, 90.0% for AGIs $75k-100k, 100.0% for AGIs $100k-200k, 100.0% for AGIs over 200k)
Averages for the 2012 tax year for zip code 42355, filed in 2013:
Average Adjusted Gross Income (AGI) in 2012: $47,468 (Individual Income Tax Returns)
Here:
$47,468
State:
$50,814
Salary/wage: $40,893 (reported on 87.2% of returns)
Here:
$40,893
State:
$42,723
(% of AGI for various income ranges: 76.2% for AGIs below $25k, 74.8% for AGIs $25k-50k, 82.2% for AGIs $50k-75k, 75.7% for AGIs $75k-100k, 67.8% for AGIs $100k-200k)
Taxable interest for individuals: $652 (reported on 29.5% of returns)
This zip code:
$652
Kentucky:
$1,381
(% of AGI for various income ranges: 0.8% for AGIs below $25k, 0.6% for AGIs $25k-50k, 0.4% for AGIs $50k-75k, 0.3% for AGIs $75k-100k, 0.3% for AGIs $100k-200k)
Ordinary dividends: $1,830 (reported on 12.8% of returns)
Here:
$1,830
State:
$6,239
(% of AGI for various income ranges: 0.5% for AGIs below $25k, 0.5% for AGIs $50k-75k, 1.2% for AGIs $100k-200k)
Net capital gain/loss in AGI: +$2,371 (reported on 9.0% of returns)
Here:
+$2,371
State:
+$11,336
Profit/loss from business: +$9,891 (reported on 14.1% of returns)
Here:
+$9,891
State:
+$10,862
(% of AGI for various income ranges: 5.3% for AGIs below $25k, 5.7% for AGIs $25k-50k, 6.2% for AGIs $75k-100k)
Taxable individual retirement arrangement distribution: $13,350 (reported on 10.3% of returns)
42355:
$13,350
Kentucky:
$14,296
Total itemized deductions: $16,963 (21% of AGI, reported on 24.4% of returns)
Here:
$16,963
State:
$21,160
Here:
21.3% of AGI
State:
20.0% of AGI
(% of AGI for various income ranges: 7.6% for AGIs $25k-50k, 7.1% for AGIs $50k-75k, 10.3% for AGIs $75k-100k, 13.2% for AGIs $100k-200k)
Charity contributions: $3,579 (reported on 17.9% of returns)
Here:
$3,579
State:
$4,303
(% of AGI for various income ranges: 1.2% for AGIs $25k-50k, 0.9% for AGIs $50k-75k, 1.6% for AGIs $75k-100k, 2.2% for AGIs $100k-200k)
Taxes paid: $5,463 (reported on 24.4% of returns)
42355:
$5,463
State:
$8,496
(% of AGI for various income ranges: 1.3% for AGIs $25k-50k, 2.3% for AGIs $50k-75k, 3.6% for AGIs $75k-100k, 4.8% for AGIs $100k-200k)
Earned income credit: $2,079 (reported on 17.9% of returns)
Here:
$2,079
State:
$2,273
(% of AGI for various income ranges: 5.7% for AGIs below $25k, 1.0% for AGIs $25k-50k)
Percentage of individuals using paid preparers for their 2012 taxes: 56.4%
Here:
56%
State:
60%
(% for various income ranges: 50.0% for AGIs below $25k, 57.9% for AGIs $25k-50k, 64.3% for AGIs $50k-75k, 55.6% for AGIs $75k-100k, 66.7% for AGIs $100k-200k)
Averages for the 2004 tax year for zip code 42355, filed in 2005:
Average Adjusted Gross Income (AGI) in 2004: $36,320 (Individual Income Tax Returns)
Here:
$36,320
State:
$41,540
Salary/wage: $32,197 (reported on 87.9% of returns)
Here:
$32,197
State:
$36,432
(% of AGI for various income ranges: 84.8% for AGIs below $10k, 77.4% for AGIs $10k-25k, 80.8% for AGIs $25k-50k, 83.9% for AGIs $50k-75k, 78.8% for AGIs $75k-100k, 56.3% for AGIs over 100k)
Taxable interest for individuals: $1,029 (reported on 41.1% of returns)
This zip code:
$1,029
Kentucky:
$1,571
(% of AGI for various income ranges: 3.7% for AGIs below $10k, 1.7% for AGIs $10k-25k, 0.7% for AGIs $25k-50k, 0.7% for AGIs $50k-75k, 0.8% for AGIs $75k-100k, 2.6% for AGIs over 100k)
Taxable dividends: $763 (reported on 13.5% of returns)
Here:
$763
State:
$3,453
(% of AGI for various income ranges: 0.3% for AGIs below $10k, 0.2% for AGIs $10k-25k, 0.1% for AGIs $25k-50k, 0.2% for AGIs $50k-75k, 0.4% for AGIs $75k-100k, 0.8% for AGIs over 100k)
Net capital gain/loss: +$1,710 (reported on 11.0% of returns)
Here:
+$1,710
State:
+$9,663
(% of AGI for various income ranges: -0.1% for AGIs below $10k, -0.0% for AGIs $25k-50k, 2.2% for AGIs $50k-75k, -0.1% for AGIs $75k-100k, -0.5% for AGIs over 100k)
Profit/loss from business: +$10,775 (reported on 15.3% of returns)
Here:
+$10,775
State:
+$9,233
(% of AGI for various income ranges: 3.9% for AGIs below $10k, 8.1% for AGIs $10k-25k, 6.7% for AGIs $25k-50k, 1.8% for AGIs $50k-75k, 6.4% for AGIs $75k-100k)
IRA payment deduction: $2,700 (reported on 1.2% of returns)
42355:
$2,700
Kentucky:
$2,955
Total itemized deductions: $15,231 (23% of AGI, reported on 25.1% of returns)
Here:
$15,231
State:
$17,474
Here:
23.0% of AGI
State:
21.0% of AGI
(% of AGI for various income ranges: 5.9% for AGIs $10k-25k, 7.0% for AGIs $25k-50k, 12.2% for AGIs $50k-75k, 13.0% for AGIs $75k-100k, 17.1% for AGIs over 100k)
Charity contributions deductions: $3,038 (4% of AGI, reported on 19.0% of returns)
Here:
$3,038
State:
$3,494
Here:
4.4% of AGI
State:
4.0% of AGI
(% of AGI for various income ranges: 5.6% for AGIs below $10k, 0.6% for AGIs $25k-50k, 1.9% for AGIs $50k-75k, 1.9% for AGIs $75k-100k, 3.0% for AGIs over 100k)
Total tax: $4,094 (reported on 73.5% of returns)
42355:
$4,094
State:
$6,162
(% of AGI for various income ranges: 1.8% for AGIs below $10k, 4.5% for AGIs $10k-25k, 6.8% for AGIs $25k-50k, 7.4% for AGIs $50k-75k, 10.5% for AGIs $75k-100k, 15.1% for AGIs over 100k)
Earned income credit: $1,693 (reported on 16.2% of returns)
Here:
$1,693
State:
$1,723
Percentage of individuals using paid preparers for their 2004 taxes: 59.1%
Here:
59%
State:
66%
(% for various income ranges: 43.8% for AGIs below $10k, 59.6% for AGIs $10k-25k, 64.7% for AGIs $25k-50k, 64.3% for AGIs $50k-75k, 60.9% for AGIs $75k-100k, 74.1% for AGIs over 100k)
Household received Food Stamps/SNAP in the past 12 months: 14 Household did not receive Food Stamps/SNAP in the past 12 months: 596
Women who had a birth in the past 12 months: 26 (16 now married, 9 unmarried) Women who did not have a birth in the past 12 months: 239 (110 now married, 129 unmarried)
Housing units in zip code 42355 with a mortgage: 212 (14 second mortgage, 9 both second mortgage and home equity loan) Houses without a mortgage: 12
Median monthly owner costs for units with a mortgage: $944 Median monthly owner costs for units without a mortgage: $429
Residents with income below the poverty level in 2022:
This zip code:
10.6%
Whole state:
16.5%
Residents with income below 50% of the poverty level in 2022:
This zip code:
5.7%
Whole state:
9.0%
Median number of rooms in houses and condos:
Here:
5.9
State:
6.4
Median number of rooms in apartments:
Here:
4.8
State:
4.4
Notable locations in this zip code not listed on our city pages
Size of family households: 223 2-persons, 72 3-persons, 50 4-persons, 29 5-persons, 11 6-persons, 8 7-or-more-persons
Size of nonfamily households: 154 1-person, 61 2-persons
258 married couples with children.
34 single-parent households (34 women).
99.8% of residents of 42355 zip code speak English at home.
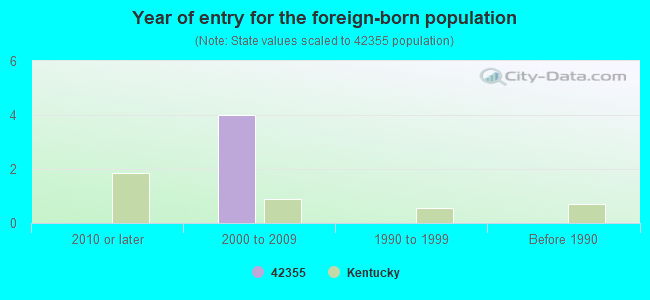
Foreign born population: 0 (0.0%)
:
0.0%
Whole state:
4.0%
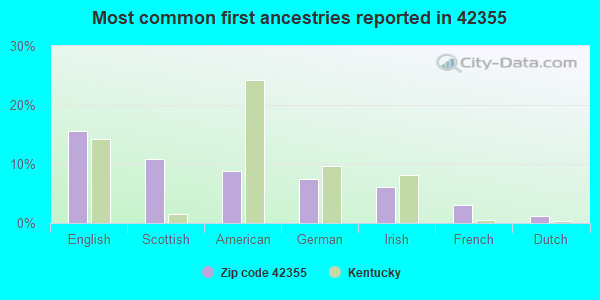
16%English
11%Scottish
9%American
7%German
6%Irish
3%French
1%Dutch
Year of entry for the foreign-born population
02010 or later
42000 to 2009
01990 to 1999
0Before 1990
Facilities with environmental interests located in this zip code:
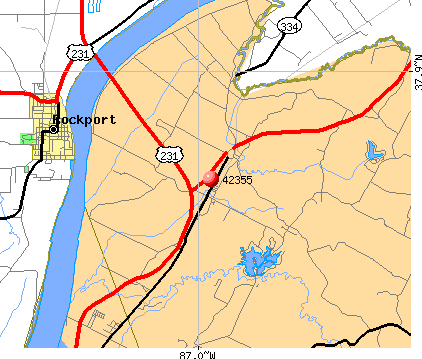
LANHAM RIVER TERMINAL (7415 TERMINAL ROAD in MACEO, KY)
AIR MINOR (AIRS/AFS) AIR MAJOR (AIRS/AFS) CRITERIA AND HAZARDOUS AIR POLLUTANT INVENTORY (Inventory of air pollution sources) Business SIC classification: BITUMINOUS COAL UNDERGROUND MINING; MARINE CARGO HANDLING Business NAICS classification: BITUMINOUS COAL UNDERGROUND MINING. Alternative names: LANHAM COAL DOCK, INC., LANHAM MINING CO INC
KINDER MORGAN OWENSBORO GATEWY (7550 TERMINAL ROAD in MACEO, KY)
National Pollutant Discharge Elimination System NON-MAJOR (Tracking pollutant discharge elimination systems) - permit Business SIC classification: MARINE CARGO HANDLING Alternative names: LANHAM RIVER TERMINAL LLC
Housing units lacking complete plumbing facilities: 1.4% Housing units lacking complete kitchen facilities: 10.3%
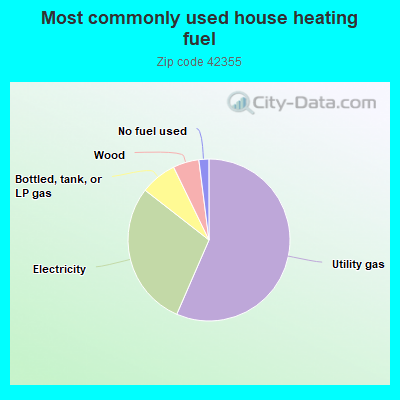
56.7%Utility gas
29.1%Electricity
7.3%Bottled, tank, or LP gas
5.2%Wood
2.0%No fuel used
Population in 1990: 2,223.
Place of birth for U.S.-born residents:
This state: 1,130
Northeast: 18
Midwest: 179
South: 110
West: 34
60% of the 42355 zip code residents lived in the same house 5 years ago. Out of people who lived in different houses, 79% lived in this county. Out of people who lived in different counties, 50% lived in Kentucky.
98% of the 42355 zip code residents lived in the same house 1 year ago. Out of people who lived in different houses, 39% moved from this county. Out of people who lived in different houses, 83% moved from different state.
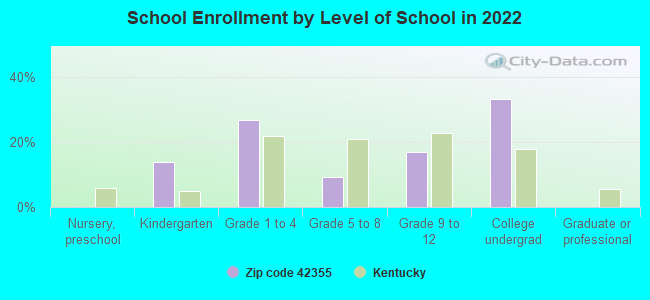
Private vs. public school enrollment:
Students in private schools in grades 1 to 8 (elementary and middle school): 16
Here:
13.2%
Kentucky:
17.2%
Students in private schools in grades 9 to 12 (high school):
Here:
0.0%
Kentucky:
15.2%
Students in private undergraduate colleges: 5
Here:
4.9%
Kentucky:
19.6%
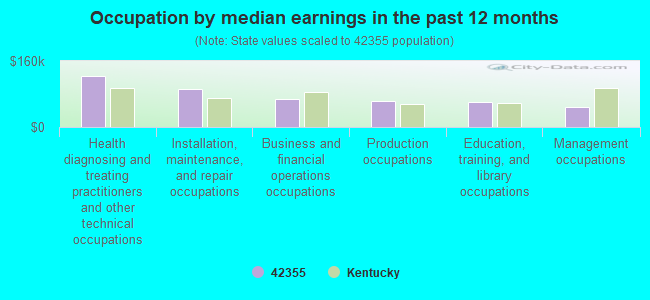
Occupation by median earnings in the past 12 months ($)
123,213Health diagnosing and treating practitioners and other technical occupations
92,813Installation, maintenance, and repair occupations
67,605Business and financial operations occupations
63,068Production occupations
60,214Education, training, and library occupations
49,405Management occupations
Top industries in this zip code by the number of employees in 2005:
Administrative and Support and Waste Management and Remediation Services: Solid Waste Collection (20-49 employees: 1 establishment)
Construction: Painting and Wall Covering Contractors (20-49: 1)
Other Services (except Public Administration): Religious Organizations (5-9: 1, 1-4: 1)
Construction: Commercial and Institutional Building Construction (5-9: 1)
Construction: New Single-Family Housing Construction (except Operative Builders) (1-4: 2)
Construction: Plumbing, Heating, and Air-Conditioning Contractors (1-4: 2)
Administrative and Support and Waste Management and Remediation Services: Security Guards and Patrol Services (1-4: 1)
Administrative and Support and Waste Management and Remediation Services: Janitorial Services (1-4: 1)
Construction: Electrical Contractors (1-4: 1)
Fatal accident statistics in 2014:
Fatal accident count: 1
Vehicles involved in fatal accidents: 2
Fatal accidents caused by drunken drivers: 0
Fatalities: 1
Persons involved in fatal accidents: 4
Pedestrians involved in fatal accidents: 0
Fatal accident statistics in 2012:
Fatal accident count: 1
Vehicles involved in fatal accidents: 1
Fatal accidents caused by drunken drivers: 1
Fatalities: 1
Persons involved in fatal accidents: 1
Pedestrians involved in fatal accidents: 0
Home Mortgage Disclosure Act Aggregated Statistics For Year 2009 (Based on 2 partial tracts)
A) FHA, FSA/RHS & VA Home Purchase Loans
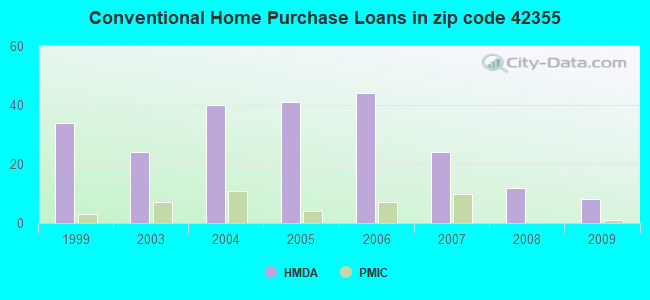
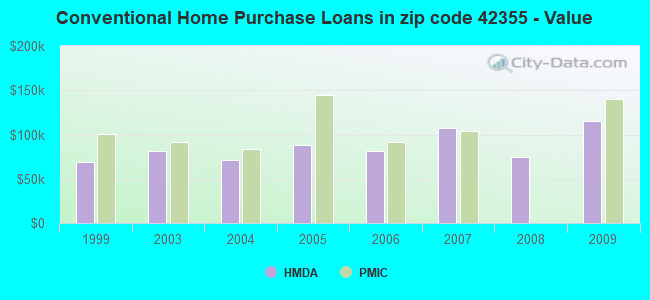
B) Conventional Home Purchase Loans
C) Refinancings
D) Home Improvement Loans
F) Non-occupant Loans on < 5 Family Dwellings (A B C & D)
G) Loans On Manufactured Home Dwelling (A B C & D)
Number
Average Value
Number
Average Value
Number
Average Value
Number
Average Value
Number
Average Value
Number
Average Value
LOANS ORIGINATED
7
$81,141
8
$115,112
31
$150,582
2
$74,300
3
$99,717
5
$36,172
APPLICATIONS APPROVED, NOT ACCEPTED
2
$100,695
1
$293,280
6
$79,348
0
$0
0
$0
0
$0
APPLICATIONS DENIED
0
$0
6
$104,767
16
$87,251
1
$14,660
0
$0
6
$67,455
APPLICATIONS WITHDRAWN
2
$111,935
2
$70,385
8
$125,744
0
$0
0
$0
1
$29,330
FILES CLOSED FOR INCOMPLETENESS
1
$92,870
0
$0
2
$151,530
0
$0
0
$0
0
$0
Aggregated Statistics For Year 2008 (Based on 2 partial tracts)
A) FHA, FSA/RHS & VA Home Purchase Loans
B) Conventional Home Purchase Loans
C) Refinancings
D) Home Improvement Loans
F) Non-occupant Loans on < 5 Family Dwellings (A B C & D)
G) Loans On Manufactured Home Dwelling (A B C & D)
Number
Average Value
Number
Average Value
Number
Average Value
Number
Average Value
Number
Average Value
Number
Average Value
LOANS ORIGINATED
4
$98,492
12
$75,112
24
$106,355
5
$49,466
3
$48,880
5
$52,008
APPLICATIONS APPROVED, NOT ACCEPTED
0
$0
1
$206,270
7
$83,376
1
$19,550
0
$0
2
$129,045
APPLICATIONS DENIED
3
$85,377
10
$70,094
22
$96,071
2
$20,530
1
$125,130
6
$32,260
APPLICATIONS WITHDRAWN
2
$86,520
0
$0
6
$92,547
0
$0
0
$0
1
$99,720
FILES CLOSED FOR INCOMPLETENESS
1
$129,040
2
$107,535
1
$39,100
0
$0
0
$0
0
$0
Aggregated Statistics For Year 2007 (Based on 2 partial tracts)
A) FHA, FSA/RHS & VA Home Purchase Loans
B) Conventional Home Purchase Loans
C) Refinancings
D) Home Improvement Loans
F) Non-occupant Loans on < 5 Family Dwellings (A B C & D)
G) Loans On Manufactured Home Dwelling (A B C & D)
Number
Average Value
Number
Average Value
Number
Average Value
Number
Average Value
Number
Average Value
Number
Average Value
LOANS ORIGINATED
3
$70,060
24
$106,884
32
$93,452
12
$22,078
3
$48,880
14
$58,097
APPLICATIONS APPROVED, NOT ACCEPTED
0
$0
6
$37,800
8
$77,352
2
$9,285
0
$0
3
$48,553
APPLICATIONS DENIED
3
$70,060
13
$49,332
30
$80,848
4
$31,772
0
$0
13
$53,994
APPLICATIONS WITHDRAWN
0
$0
2
$90,430
12
$92,220
0
$0
0
$0
3
$81,467
FILES CLOSED FOR INCOMPLETENESS
0
$0
0
$0
4
$64,032
0
$0
0
$0
0
$0
Aggregated Statistics For Year 2006 (Based on 2 partial tracts)
A) FHA, FSA/RHS & VA Home Purchase Loans
B) Conventional Home Purchase Loans
C) Refinancings
D) Home Improvement Loans
F) Non-occupant Loans on < 5 Family Dwellings (A B C & D)
G) Loans On Manufactured Home Dwelling (A B C & D)
Number
Average Value
Number
Average Value
Number
Average Value
Number
Average Value
Number
Average Value
Number
Average Value
LOANS ORIGINATED
3
$71,363
44
$81,119
50
$81,864
8
$19,919
17
$63,141
13
$48,880
APPLICATIONS APPROVED, NOT ACCEPTED
1
$50,840
6
$62,078
12
$64,278
4
$28,105
5
$29,524
9
$54,854
APPLICATIONS DENIED
3
$64,520
18
$52,519
31
$85,997
11
$21,329
7
$44,271
18
$40,516
APPLICATIONS WITHDRAWN
2
$48,390
6
$57,842
19
$85,772
1
$114,380
1
$24,440
5
$61,394
FILES CLOSED FOR INCOMPLETENESS
0
$0
1
$53,770
2
$87,005
0
$0
0
$0
0
$0
Aggregated Statistics For Year 2005 (Based on 2 partial tracts)
A) FHA, FSA/RHS & VA Home Purchase Loans
B) Conventional Home Purchase Loans
C) Refinancings
D) Home Improvement Loans
F) Non-occupant Loans on < 5 Family Dwellings (A B C & D)
G) Loans On Manufactured Home Dwelling (A B C & D)
Number
Average Value
Number
Average Value
Number
Average Value
Number
Average Value
Number
Average Value
Number
Average Value
LOANS ORIGINATED
5
$87,788
41
$88,199
41
$81,069
7
$22,624
2
$65,010
16
$55,540
APPLICATIONS APPROVED, NOT ACCEPTED
0
$0
9
$83,857
4
$94,828
0
$0
0
$0
4
$64,522
APPLICATIONS DENIED
1
$57,680
25
$54,706
43
$92,599
13
$31,659
2
$18,085
22
$49,635
APPLICATIONS WITHDRAWN
3
$60,937
2
$72,340
4
$81,385
3
$154,787
0
$0
2
$71,855
FILES CLOSED FOR INCOMPLETENESS
0
$0
1
$68,430
1
$43,010
1
$14,660
0
$0
0
$0
Aggregated Statistics For Year 2004 (Based on 2 partial tracts)
A) FHA, FSA/RHS & VA Home Purchase Loans
B) Conventional Home Purchase Loans
C) Refinancings
D) Home Improvement Loans
F) Non-occupant Loans on < 5 Family Dwellings (A B C & D)
G) Loans On Manufactured Home Dwelling (A B C & D)
Number
Average Value
Number
Average Value
Number
Average Value
Number
Average Value
Number
Average Value
Number
Average Value
LOANS ORIGINATED
4
$64,032
40
$71,145
58
$80,349
5
$23,266
4
$40,325
16
$38,982
APPLICATIONS APPROVED, NOT ACCEPTED
0
$0
6
$53,768
7
$69,829
2
$73,320
0
$0
3
$43,013
APPLICATIONS DENIED
1
$75,280
15
$44,057
47
$77,958
8
$14,175
0
$0
18
$47,359
APPLICATIONS WITHDRAWN
1
$51,810
0
$0
24
$106,966
0
$0
0
$0
2
$57,190
FILES CLOSED FOR INCOMPLETENESS
0
$0
1
$81,140
2
$64,035
1
$4,890
0
$0
1
$81,140
Aggregated Statistics For Year 2003 (Based on 2 partial tracts)
A) FHA, FSA/RHS & VA Home Purchase Loans
B) Conventional Home Purchase Loans
C) Refinancings
D) Home Improvement Loans
F) Non-occupant Loans on < 5 Family Dwellings (A B C & D)
Number
Average Value
Number
Average Value
Number
Average Value
Number
Average Value
Number
Average Value
LOANS ORIGINATED
2
$95,805
24
$81,670
114
$81,518
14
$14,874
4
$52,545
APPLICATIONS APPROVED, NOT ACCEPTED
0
$0
8
$51,446
19
$74,709
2
$50,345
1
$47,900
APPLICATIONS DENIED
2
$62,080
17
$39,909
55
$79,612
6
$36,172
1
$44,970
APPLICATIONS WITHDRAWN
2
$106,070
5
$51,422
20
$90,672
2
$11,730
1
$58,660
FILES CLOSED FOR INCOMPLETENESS
0
$0
0
$0
3
$147,293
0
$0
0
$0
Aggregated Statistics For Year 1999 (Based on 1 partial tract)
A) FHA, FSA/RHS & VA Home Purchase Loans
B) Conventional Home Purchase Loans
C) Refinancings
D) Home Improvement Loans
F) Non-occupant Loans on < 5 Family Dwellings (A B C & D)
Detailed PMIC statistics for the following Tracts:0015.01
2002 - 2018 National Fire Incident Reporting System (NFIRS) incidents
According to the data from the years 2002 - 2018 the average number of fire incidents per year is 22. The highest number of reported fires - 66 took place in 2009, and the least - 6 in 2004. The data has a rising trend.
When looking into fire subcategories, the most incidents belonged to: Outside Fires (45.8%), and Structure Fires (36.7%).
Fire incident types reported to NFIRS in Zip Code 42355

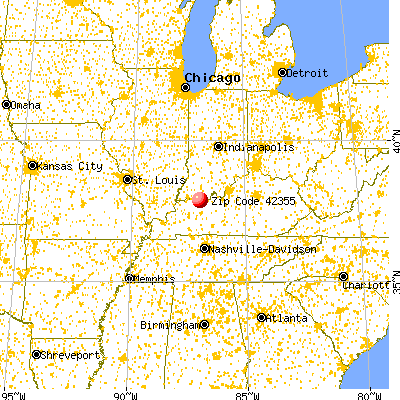


 Nearest zip codes: 42303, 47635, 47615, 42351, 42366, 47611.


 According to the data from the years 2002 - 2018 the average number of fire incidents per year is 22. The highest number of reported fires - 66 took place in 2009, and the least - 6 in 2004. The data has a rising trend.
 When looking into fire subcategories, the most incidents belonged to: Outside Fires (45.8%), and Structure Fires (36.7%).