Estimated zip code population in 2022: 5,200 Zip code population in 2010: 5,863 Zip code population in 2000: 6,051
Houses and condos: 2,195 Renter-occupied apartments: 124
% of renters here:
6%
State:
31%
March 2022 cost of living index in zip code 42366: 82.5 (low, U.S. average is 100)
Land area: 80.6 sq. mi. Water area: 0.7 sq. mi.
Population density: 65 people per square mile
(very low).
OSM Map
General Map
Google Map
MSN Map
OSM Map
General Map
Google Map
MSN Map
OSM Map
General Map
Google Map
MSN Map
OSM Map
General Map
Google Map
MSN Map
Please wait while loading the map...
Real estate property taxes paid for housing units in 2022:
This zip code:
0.7% ($1,616)
Kentucky:
0.7% ($1,456)
Median real estate property taxes paid for housing units with mortgages in 2022: $1,808 (0.7%) Median real estate property taxes paid for housing units with no mortgage in 2022: $1,398 (0.7%)
Business Search- 14 Million verified businesses
Males: 2,656
(51.1%)
Females: 2,543
(48.9%)
For population 25 years and over in 42366:
High school or higher: 97.4%
Bachelor's degree or higher: 25.0%
Graduate or professional degree: 9.0%
Unemployed: 5.8%
Mean travel time to work (commute): 26.8 minutes
For population 15 years and over in 42366:
Never married: 16.8%
Now married: 70.9%
Separated: 0.5%
Widowed: 4.0%
Divorced: 7.7%
Zip code 42366 compared to state average:
Black race population percentage significantly below state average.
Hispanic race population percentage significantly below state average.
Median age above state average.
Foreign-born population percentage significantly below state average.
Renting percentage significantly below state average.
Length of stay since moving in significantly above state average.
Estimated median house/condo value in 2022: $237,224
42366:
$237,224
Kentucky:
$196,300
According to our research of Kentucky and other state lists, there were 7 registered sex offenders living in 42366 zip code as of June 08, 2024. The ratio of all residents to sex offenders in zip code 42366 is 813 to 1. The ratio of registered sex offenders to all residents in this zip code is lower than the state average.
Median resident age:
This zip code:
44.8 years
Kentucky median age:
39.4 years
Average household size:
This zip code:
2.6 people
Kentucky:
2.4 people
Averages for the 2020 tax year for zip code 42366, filed in 2021:
Average Adjusted Gross Income (AGI) in 2020: $67,733 (Individual Income Tax Returns)
Here:
$67,733
State:
$61,342
Salary/wage: $58,177 (reported on 82.8% of returns)
Here:
$58,177
State:
$50,827
(% of AGI for various income ranges: 1160.8% for AGIs below $25k, 3760.7% for AGIs $25k-50k, 6654.0% for AGIs $50k-75k, 9712.2% for AGIs $75k-100k, 15918.2% for AGIs $100k-200k, 54326.7% for AGIs over 200k)
Taxable interest for individuals: $1,398 (reported on 34.1% of returns)
This zip code:
$1,398
Kentucky:
$1,441
(% of AGI for various income ranges: 22.7% for AGIs below $25k, 24.9% for AGIs $25k-50k, 58.0% for AGIs $50k-75k, 40.0% for AGIs $75k-100k, 58.2% for AGIs $100k-200k, 2210.0% for AGIs over 200k)
Ordinary dividends: $3,850 (reported on 17.9% of returns)
Here:
$3,850
State:
$7,388
(% of AGI for various income ranges: 27.6% for AGIs below $25k, 37.0% for AGIs $25k-50k, 62.0% for AGIs $50k-75k, 109.6% for AGIs $75k-100k, 124.1% for AGIs $100k-200k, 2586.7% for AGIs over 200k)
Net capital gain/loss in AGI: +$10,160 (reported on 16.2% of returns)
Here:
+$10,160
State:
+$19,475
(% of AGI for various income ranges: 22.2% for AGIs below $25k, 47.9% for AGIs $25k-50k, 82.0% for AGIs $50k-75k, 125.9% for AGIs $75k-100k, 316.8% for AGIs $100k-200k, 9250.0% for AGIs over 200k)
Profit/loss from business: +$11,592 (reported on 13.8% of returns)
Here:
+$11,592
State:
+$11,386
(% of AGI for various income ranges: 73.7% for AGIs below $25k, 92.1% for AGIs $25k-50k, 148.7% for AGIs $50k-75k, 349.3% for AGIs $75k-100k, 710.9% for AGIs $100k-200k)
Taxable individual retirement arrangement distribution: $16,154 (reported on 12.1% of returns)
42366:
$16,154
Kentucky:
$18,941
(% of AGI for various income ranges: 87.8% for AGIs below $25k, 180.2% for AGIs $25k-50k, 395.0% for AGIs $50k-75k, 288.9% for AGIs $75k-100k, 704.7% for AGIs $100k-200k)
Total itemized deductions: $35,369 (reported on 4.5% of returns)
Here:
$35,369
State:
$32,473
(% of AGI for various income ranges: 267.9% for AGIs $25k-50k, 177.0% for AGIs $75k-100k, 398.5% for AGIs $100k-200k, 5376.7% for AGIs over 200k)
Charity contributions: $15,245 (reported on 3.8% of returns)
Here:
$15,245
State:
$13,472
(% of AGI for various income ranges: 91.3% for AGIs $50k-75k, 125.3% for AGIs $100k-200k, 3256.7% for AGIs over 200k)
Taxes paid: $7,500 (reported on 4.5% of returns)
42366:
$7,500
State:
$7,830
(% of AGI for various income ranges: 40.0% for AGIs $25k-50k, 46.7% for AGIs $75k-100k, 106.2% for AGIs $100k-200k, 1053.3% for AGIs over 200k)
Earned income credit: $2,041 (reported on 11.0% of returns)
Here:
$2,041
State:
$2,336
(% of AGI for various income ranges: 64.4% for AGIs below $25k, 63.5% for AGIs $25k-50k)
Percentage of individuals using paid preparers for their 2020 taxes: 93.4%
Here:
93%
State:
94%
(% for various income ranges: 92.0% for AGIs below $25k, 94.8% for AGIs $25k-50k, 93.2% for AGIs $50k-75k, 92.5% for AGIs $75k-100k, 94.3% for AGIs $100k-200k, 100.0% for AGIs over 200k)
Averages for the 2012 tax year for zip code 42366, filed in 2013:
Average Adjusted Gross Income (AGI) in 2012: $60,211 (Individual Income Tax Returns)
Here:
$60,211
State:
$50,814
Salary/wage: $49,552 (reported on 85.2% of returns)
Here:
$49,552
State:
$42,723
(% of AGI for various income ranges: 71.2% for AGIs below $25k, 73.8% for AGIs $25k-50k, 80.1% for AGIs $50k-75k, 82.5% for AGIs $75k-100k, 79.0% for AGIs $100k-200k, 35.4% for AGIs over 200k)
Taxable interest for individuals: $1,248 (reported on 38.5% of returns)
This zip code:
$1,248
Kentucky:
$1,381
(% of AGI for various income ranges: 1.9% for AGIs below $25k, 0.8% for AGIs $25k-50k, 0.7% for AGIs $50k-75k, 0.7% for AGIs $75k-100k, 0.6% for AGIs $100k-200k, 0.8% for AGIs over 200k)
Ordinary dividends: $2,598 (reported on 18.5% of returns)
Here:
$2,598
State:
$6,239
(% of AGI for various income ranges: 0.8% for AGIs below $25k, 0.5% for AGIs $25k-50k, 0.7% for AGIs $50k-75k, 0.5% for AGIs $75k-100k, 0.5% for AGIs $100k-200k, 1.7% for AGIs over 200k)
Net capital gain/loss in AGI: +$8,328 (reported on 18.5% of returns)
Here:
+$8,328
State:
+$11,336
(% of AGI for various income ranges: 0.3% for AGIs below $25k, 0.8% for AGIs $25k-50k, 0.7% for AGIs $50k-75k, 1.1% for AGIs $75k-100k, 1.6% for AGIs $100k-200k, 8.8% for AGIs over 200k)
Profit/loss from business: +$11,419 (reported on 13.7% of returns)
Here:
+$11,419
State:
+$10,862
(% of AGI for various income ranges: 4.5% for AGIs below $25k, 3.2% for AGIs $25k-50k, 2.3% for AGIs $50k-75k, 2.5% for AGIs $75k-100k, 4.4% for AGIs $100k-200k)
Taxable individual retirement arrangement distribution: $11,525 (reported on 10.4% of returns)
42366:
$11,525
Kentucky:
$14,296
(% of AGI for various income ranges: 4.0% for AGIs below $25k, 3.4% for AGIs $25k-50k, 1.7% for AGIs $50k-75k, 1.9% for AGIs $75k-100k, 2.6% for AGIs $100k-200k)
Total itemized deductions: $21,527 (19% of AGI, reported on 30.4% of returns)
Here:
$21,527
State:
$21,160
Here:
18.8% of AGI
State:
20.0% of AGI
(% of AGI for various income ranges: 6.3% for AGIs below $25k, 7.0% for AGIs $25k-50k, 9.5% for AGIs $50k-75k, 11.1% for AGIs $75k-100k, 13.0% for AGIs $100k-200k, 13.8% for AGIs over 200k)
Charity contributions: $5,654 (reported on 25.6% of returns)
Here:
$5,654
State:
$4,303
(% of AGI for various income ranges: 0.8% for AGIs below $25k, 0.9% for AGIs $25k-50k, 1.3% for AGIs $50k-75k, 2.0% for AGIs $75k-100k, 2.3% for AGIs $100k-200k, 5.5% for AGIs over 200k)
Taxes paid: $8,512 (reported on 30.4% of returns)
42366:
$8,512
State:
$8,496
(% of AGI for various income ranges: 0.8% for AGIs below $25k, 1.8% for AGIs $25k-50k, 2.9% for AGIs $50k-75k, 4.1% for AGIs $75k-100k, 5.9% for AGIs $100k-200k, 7.0% for AGIs over 200k)
Earned income credit: $2,015 (reported on 12.6% of returns)
Here:
$2,015
State:
$2,273
(% of AGI for various income ranges: 4.6% for AGIs below $25k, 0.9% for AGIs $25k-50k)
Percentage of individuals using paid preparers for their 2012 taxes: 61.5%
Here:
61%
State:
60%
(% for various income ranges: 51.7% for AGIs below $25k, 62.3% for AGIs $25k-50k, 68.1% for AGIs $50k-75k, 69.2% for AGIs $75k-100k, 64.3% for AGIs $100k-200k, 83.3% for AGIs over 200k)
Averages for the 2004 tax year for zip code 42366, filed in 2005:
Average Adjusted Gross Income (AGI) in 2004: $43,663 (Individual Income Tax Returns)
Here:
$43,663
State:
$41,540
Salary/wage: $39,649 (reported on 87.7% of returns)
Here:
$39,649
State:
$36,432
(% of AGI for various income ranges: 110.5% for AGIs below $10k, 73.2% for AGIs $10k-25k, 82.0% for AGIs $25k-50k, 87.2% for AGIs $50k-75k, 89.2% for AGIs $75k-100k, 60.6% for AGIs over 100k)
Taxable interest for individuals: $1,131 (reported on 53.4% of returns)
This zip code:
$1,131
Kentucky:
$1,571
(% of AGI for various income ranges: 6.5% for AGIs below $10k, 3.8% for AGIs $10k-25k, 1.4% for AGIs $25k-50k, 0.8% for AGIs $50k-75k, 0.8% for AGIs $75k-100k, 1.4% for AGIs over 100k)
Taxable dividends: $1,290 (reported on 20.0% of returns)
Here:
$1,290
State:
$3,453
(% of AGI for various income ranges: 1.4% for AGIs below $10k, 1.0% for AGIs $10k-25k, 0.6% for AGIs $25k-50k, 0.3% for AGIs $50k-75k, 0.2% for AGIs $75k-100k, 1.0% for AGIs over 100k)
Net capital gain/loss: +$4,980 (reported on 17.2% of returns)
Here:
+$4,980
State:
+$9,663
(% of AGI for various income ranges: 4.5% for AGIs below $10k, 1.2% for AGIs $10k-25k, 1.0% for AGIs $25k-50k, 0.6% for AGIs $50k-75k, 0.4% for AGIs $75k-100k, 5.9% for AGIs over 100k)
Profit/loss from business: +$10,244 (reported on 14.4% of returns)
Here:
+$10,244
State:
+$9,233
(% of AGI for various income ranges: 1.4% for AGIs below $10k, 4.4% for AGIs $10k-25k, 3.1% for AGIs $25k-50k, 2.8% for AGIs $50k-75k, 2.3% for AGIs $75k-100k, 5.0% for AGIs over 100k)
IRA payment deduction: $3,210 (reported on 3.0% of returns)
42366:
$3,210
Kentucky:
$2,955
(% of AGI for various income ranges: 0.4% for AGIs $10k-25k, 0.4% for AGIs $25k-50k, 0.2% for AGIs $50k-75k, 0.2% for AGIs over 100k)
Total itemized deductions: $15,236 (20% of AGI, reported on 33.3% of returns)
Here:
$15,236
State:
$17,474
Here:
19.5% of AGI
State:
21.0% of AGI
(% of AGI for various income ranges: 10.8% for AGIs below $10k, 6.9% for AGIs $10k-25k, 9.2% for AGIs $25k-50k, 12.3% for AGIs $50k-75k, 13.9% for AGIs $75k-100k, 12.9% for AGIs over 100k)
Charity contributions deductions: $3,154 (4% of AGI, reported on 29.1% of returns)
Here:
$3,154
State:
$3,494
Here:
3.8% of AGI
State:
4.0% of AGI
(% of AGI for various income ranges: 0.9% for AGIs below $10k, 1.0% for AGIs $10k-25k, 1.4% for AGIs $25k-50k, 2.1% for AGIs $50k-75k, 2.3% for AGIs $75k-100k, 3.1% for AGIs over 100k)
Total tax: $5,937 (reported on 77.5% of returns)
42366:
$5,937
State:
$6,162
(% of AGI for various income ranges: 2.9% for AGIs below $10k, 4.5% for AGIs $10k-25k, 6.1% for AGIs $25k-50k, 7.9% for AGIs $50k-75k, 9.5% for AGIs $75k-100k, 21.3% for AGIs over 100k)
Earned income credit: $1,498 (reported on 10.5% of returns)
Here:
$1,498
State:
$1,723
Percentage of individuals using paid preparers for their 2004 taxes: 60.3%
Here:
60%
State:
66%
(% for various income ranges: 48.0% for AGIs below $10k, 58.0% for AGIs $10k-25k, 64.9% for AGIs $25k-50k, 66.3% for AGIs $50k-75k, 64.5% for AGIs $75k-100k, 66.9% for AGIs over 100k)
Household received Food Stamps/SNAP in the past 12 months: 75 Household did not receive Food Stamps/SNAP in the past 12 months: 1,907
Women who had a birth in the past 12 months: 73 (72 now married, 0 unmarried) Women who did not have a birth in the past 12 months: 869 (522 now married, 350 unmarried)
Housing units in zip code 42366 with a mortgage: 1,029 (191 second mortgage, 10 home equity loan, 164 both second mortgage and home equity loan) Houses without a mortgage: 77
Median monthly owner costs for units with a mortgage: $1,443 Median monthly owner costs for units without a mortgage: $479
Residents with income below the poverty level in 2022:
This zip code:
3.6%
Whole state:
16.5%
Residents with income below 50% of the poverty level in 2022:
This zip code:
1.0%
Whole state:
9.0%
Median number of rooms in houses and condos:
Here:
6.6
State:
6.4
Median number of rooms in apartments:
Here:
6.0
State:
4.4
Notable locations in this zip code not listed on our city pages
Notable locations in zip code 42366: Shorts Station (A), Haynes Station (B), Fair Forest Camp (C), Daviess County Fire Department Knottsville (D), Daviess County Fire Department Thruston Philpot 2 (E). Display/hide their locations on the map
Churches in zip code 42366 include: Friendship Church (A), Hopewell Church (B), Karns Grove Church (C), Pleasant Grove Church (D), Providence Church (E), Saint Williams Church (F), Dawson Church (G). Display/hide their locations on the map
Streams, rivers, and creeks: Caney Creek (A), Cane Run (B), Burnett Fork (C), Lick Branch (D), Joes Run (E), Joes Branch (F), Hurricane Branch (G), Fork of Pup Creek (H), Flat Branch (I). Display/hide their locations on the map
In group quarters: 23 (-1 institutionalized population)
Size of family households: 900 2-persons, 304 3-persons, 242 4-persons, 149 5-persons, 53 6-persons
Size of nonfamily households: 267 1-person, 63 2-persons
1,051 married couples with children.
25 single-parent households (4 men, 21 women).
99.9% of residents of 42366 zip code speak English at home.
0.1% of residents speak Spanish at home (100% very well).
Foreign born population: 11 (0.2%) (74.4% of them are naturalized citizens)
This zip code:
0.2%
Whole state:
4.0%
64%Sweden
64%United Kingdom, excluding England and Scotland
18%Barbados
29%American
24%English
14%German
5%Irish
3%European
1%Dutch
1%Norwegian
Year of entry for the foreign-born population
32010 or later
02000 to 2009
01990 to 1999
7Before 1990
Private elementary/middle school in in this zip code not listed on the city page:
MARY CARRICO MEMORIAL SCHOOL (Students: 91, Location: 9546 STATE ROUTE 144, Grades: PK-8)
Facilities with environmental interests located in this zip code:
PREMIUM ALLIED TOOL INCORPORATED (5680 OLD HIGHWAY #54 EAST in PHILPOT, KY)
COMPLIANCE ACTIVITY (Tracking inspections of insecticide, fungicide, and rodenticide, and toxic substances) CRITERIA AND HAZARDOUS AIR POLLUTANT INVENTORY (Inventory of air pollution sources) National Pollutant Discharge Elimination System NON-MAJOR (Tracking pollutant discharge elimination systems) - permit HAZARDOUS WASTE BIENNIAL REPORTER (Resource Conservation and Recovery Act (tracking hazardous waste)) Large Quantity Generators, more that 1000 kg of hazardous waste/month (Resource Conservation and Recovery Act (tracking hazardous waste)) - notification TRI REPORTER (Tracking of toxic chemicals releasing facilities) Business SIC classification: METAL STAMPINGS Business NAICS classification: METAL STAMPING. Organizations: JAMES T. HINES JR (CONTACT/OWNER)
PHILPOT ELEMENTARY SCHOOL (6120 OLD KENTUCKY 54 in PHILPOT, KY)
(National Center for Education Statistics) - STATE ID-030145050 Organizations: DAVIESS COUNTY (SCHOOL DISTRICT)
LANMIN #4 (UNDERGROUND INJECTION CONTROL in PHILPOT, KY)
CEDAR HILLS SANIT DISPOSAL (OLD HWY 54 in PHILPOT, KY)
National Pollutant Discharge Elimination System NON-MAJOR (Tracking pollutant discharge elimination systems) - permit Business SIC classification: LAND SUBDIVIDERS AND DEVELOPERS, EXCEPT CEMETERIES Alternative names: CEDAR HILLS SANIT CORP
POSTLEWAITE'S (9295 KY 144 in KNOTTSVILLE, KY)
(Resource Conservation and Recovery Act (tracking hazardous waste)) Organizations: MARY A POSTLEWAITE (CONTACT/OWNER)
FOSTER'S GROCERY (6062 OLD HWY 54 in PHILPOT, KY)
(Resource Conservation and Recovery Act (tracking hazardous waste)) Organizations: JOSEPH A. FOSTER (CONTACT/OWNER)
MCDONALD'S SHELL (RT 1 6161 HWY 54 in PHILPOT, KY)
(Resource Conservation and Recovery Act (tracking hazardous waste)) Organizations: NORMAN G. MCDONALD (CONTACT/OWNER)
KY UNITED COAL LLC (AULL RD in PHILPOT, KY)
National Pollutant Discharge Elimination System NON-MAJOR (Tracking pollutant discharge elimination systems) - permit Business SIC classification: BITUMINOUS COAL AND LIGNITE SURFACE MINING
LANHAM MINING CO. (KY HWY 951 in PHILPOT, KY)
AIR MINOR (AIRS/AFS) Business SIC classification: BITUMINOUS COAL AND LIGNITE SURFACE MINING
Housing units lacking complete plumbing facilities: 4.6% Housing units lacking complete kitchen facilities: 5.5%
41.9%Utility gas
35.9%Electricity
16.7%Bottled, tank, or LP gas
2.7%Other fuel
2.3%Wood
Population in 1990: 6,890.
Place of birth for U.S.-born residents:
This state: 4,401
Northeast: 66
Midwest: 463
South: 168
West: 52
68% of the 42366 zip code residents lived in the same house 5 years ago. Out of people who lived in different houses, 78% lived in this county. Out of people who lived in different counties, 50% lived in Kentucky.
97% of the 42366 zip code residents lived in the same house 1 year ago. Out of people who lived in different houses, 88% moved from this county. Out of people who lived in different houses, 9% moved from different county within same state. Out of people who lived in different houses, 1% moved from different state. Out of people who lived in different houses, 7% moved from abroad.
Private vs. public school enrollment:
Students in private schools in grades 1 to 8 (elementary and middle school): 238
Here:
35.8%
Kentucky:
17.2%
Students in private schools in grades 9 to 12 (high school): 49
Here:
19.6%
Kentucky:
15.2%
Students in private undergraduate colleges: 23
Here:
27.7%
Kentucky:
19.6%
Occupation by median earnings in the past 12 months ($)
115,207Transportation occupations
105,501Architecture and engineering occupations
89,431Computer and mathematical occupations
73,428Health diagnosing and treating practitioners and other technical occupations
73,374Installation, maintenance, and repair occupations
69,665Production occupations
Top industries in this zip code by the number of employees in 2005:
Health Care and Social Assistance: Nursing Care Facilities (20-49 employees: 1 establishment)
2002 - 2018 National Fire Incident Reporting System (NFIRS) incidents
According to the data from the years 2002 - 2018 the average number of fire incidents per year is 32. The highest number of reported fires - 53 took place in 2010, and the least - 18 in 2003. The data has a rising trend.
When looking into fire subcategories, the most incidents belonged to: Outside Fires (47.8%), and Structure Fires (39.5%).
Fire incident types reported to NFIRS in Zip Code 42366

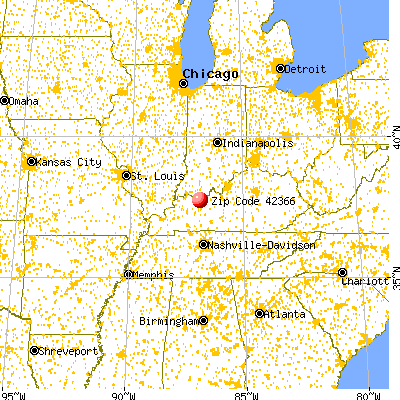


 Nearest zip codes: 42378, 42303, 42355, 42376, 42368, 42351.


 (Students: 91, Location: 9546 STATE ROUTE 144, Grades: PK-8)


 According to the data from the years 2002 - 2018 the average number of fire incidents per year is 32. The highest number of reported fires - 53 took place in 2010, and the least - 18 in 2003. The data has a rising trend.
 When looking into fire subcategories, the most incidents belonged to: Outside Fires (47.8%), and Structure Fires (39.5%).