Estimated zip code population in 2022: 3,001 Zip code population in 2010: 2,974 Zip code population in 2000: 3,140
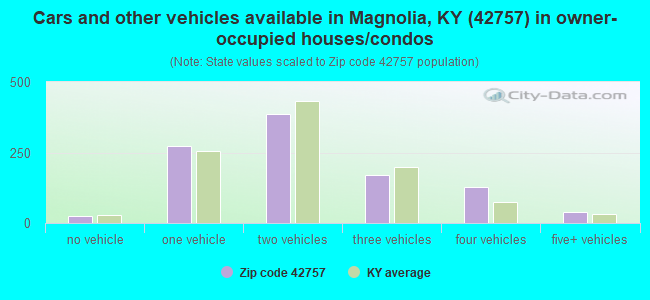
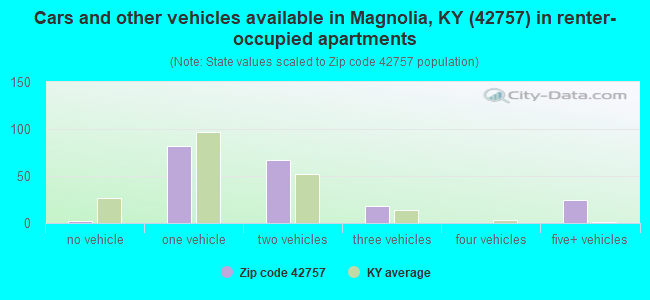
Houses and condos: 1,490 Renter-occupied apartments: 193
% of renters here:
16%
State:
31%
March 2022 cost of living index in zip code 42757: 81.7 (low, U.S. average is 100)
Land area: 82.1 sq. mi. Water area: 0.7 sq. mi.
Population density: 37 people per square mile
(very low).
OSM Map
General Map
Google Map
MSN Map
OSM Map
General Map
Google Map
MSN Map
OSM Map
General Map
Google Map
MSN Map
OSM Map
General Map
Google Map
MSN Map
Please wait while loading the map...
Real estate property taxes paid for housing units in 2022:
This zip code:
0.6% ($850)
Kentucky:
0.7% ($1,456)
Median real estate property taxes paid for housing units with mortgages in 2022: $1,048 (0.7%) Median real estate property taxes paid for housing units with no mortgage in 2022: $812 (0.7%)
Business Search- 14 Million verified businesses
Males: 1,558
(51.9%)
Females: 1,442
(48.1%)
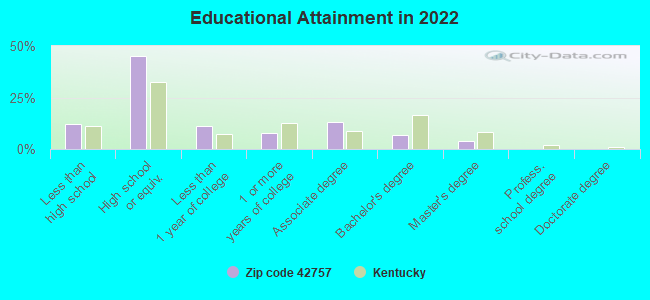
For population 25 years and over in 42757:
High school or higher: 87.1%
Bachelor's degree or higher: 11.0%
Graduate or professional degree: 4.0%
Unemployed: 4.9%
Mean travel time to work (commute): 33.6 minutes
For population 15 years and over in 42757:
Never married: 25.5%
Now married: 50.0%
Separated: 0.2%
Widowed: 13.1%
Divorced: 11.3%
Zip code 42757 compared to state average:
Hispanic race population percentage below state average.
Foreign-born population percentage significantly below state average.
Renting percentage below state average.
Length of stay since moving in significantly above state average.
Percentage of population with a bachelor's degree or higher significantly below state average.
Averages for the 2020 tax year for zip code 42757, filed in 2021:
Average Adjusted Gross Income (AGI) in 2020: $44,484 (Individual Income Tax Returns)
Here:
$44,484
State:
$61,342
Salary/wage: $39,258 (reported on 79.8% of returns)
Here:
$39,258
State:
$50,827
(% of AGI for various income ranges: 1120.0% for AGIs below $25k, 3680.4% for AGIs $25k-50k, 6729.3% for AGIs $50k-75k, 8578.8% for AGIs $75k-100k, 16838.3% for AGIs $100k-200k)
Taxable interest for individuals: $1,018 (reported on 26.4% of returns)
This zip code:
$1,018
Kentucky:
$1,441
(% of AGI for various income ranges: 25.0% for AGIs below $25k, 37.3% for AGIs $25k-50k, 35.0% for AGIs $50k-75k, 80.0% for AGIs $75k-100k, 60.0% for AGIs $100k-200k)
Ordinary dividends: $1,480 (reported on 7.8% of returns)
Here:
$1,480
State:
$7,388
(% of AGI for various income ranges: 21.5% for AGIs below $25k, 27.1% for AGIs $50k-75k, 40.0% for AGIs $100k-200k)
Net capital gain/loss in AGI: +$6,571 (reported on 10.9% of returns)
Here:
+$6,571
State:
+$19,475
(% of AGI for various income ranges: 6.8% for AGIs below $25k, 50.4% for AGIs $25k-50k, 59.3% for AGIs $50k-75k, 136.2% for AGIs $75k-100k, 950.0% for AGIs $100k-200k)
Profit/loss from business: +$3,435 (reported on 15.5% of returns)
Here:
+$3,435
State:
+$11,386
(% of AGI for various income ranges: 111.2% for AGIs below $25k, 73.1% for AGIs $25k-50k, 65.0% for AGIs $75k-100k)
Taxable individual retirement arrangement distribution: $10,733 (reported on 7.0% of returns)
42757:
$10,733
Kentucky:
$18,941
(% of AGI for various income ranges: 115.5% for AGIs below $25k, 360.0% for AGIs $50k-75k)
Total itemized deductions: $23,100 (reported on 2.3% of returns)
Here:
$23,100
State:
$32,473
(% of AGI for various income ranges: 495.0% for AGIs $50k-75k)
Taxes paid: $5,900 (reported on 2.3% of returns)
42757:
$5,900
State:
$7,830
(% of AGI for various income ranges: 126.4% for AGIs $50k-75k)
Earned income credit: $2,400 (reported on 23.3% of returns)
Here:
$2,400
State:
$2,336
(% of AGI for various income ranges: 127.5% for AGIs below $25k, 80.8% for AGIs $25k-50k)
Percentage of individuals using paid preparers for their 2020 taxes: 96.9%
Here:
97%
State:
94%
(% for various income ranges: 94.6% for AGIs below $25k, 97.0% for AGIs $25k-50k, 100.0% for AGIs $50k-75k, 100.0% for AGIs $75k-100k, 100.0% for AGIs $100k-200k)
Averages for the 2012 tax year for zip code 42757, filed in 2013:
Average Adjusted Gross Income (AGI) in 2012: $36,858 (Individual Income Tax Returns)
Here:
$36,858
State:
$50,814
Salary/wage: $34,360 (reported on 77.9% of returns)
Here:
$34,360
State:
$42,723
(% of AGI for various income ranges: 68.8% for AGIs below $25k, 77.5% for AGIs $25k-50k, 82.5% for AGIs $50k-75k, 80.8% for AGIs $75k-100k, 53.0% for AGIs $100k-200k)
Taxable interest for individuals: $1,019 (reported on 32.7% of returns)
This zip code:
$1,019
Kentucky:
$1,381
(% of AGI for various income ranges: 2.4% for AGIs below $25k, 1.1% for AGIs $25k-50k, 0.3% for AGIs $50k-75k, 0.6% for AGIs $75k-100k, 0.3% for AGIs $100k-200k)
Ordinary dividends: $1,958 (reported on 10.6% of returns)
Here:
$1,958
State:
$6,239
(% of AGI for various income ranges: 0.7% for AGIs below $25k, 0.5% for AGIs $25k-50k, 1.9% for AGIs $75k-100k)
Net capital gain/loss in AGI: +$2,527 (reported on 13.3% of returns)
Here:
+$2,527
State:
+$11,336
(% of AGI for various income ranges: 1.1% for AGIs below $25k, 1.8% for AGIs $25k-50k, 1.5% for AGIs $75k-100k)
Profit/loss from business: +$5,710 (reported on 17.7% of returns)
Here:
+$5,710
State:
+$10,862
(% of AGI for various income ranges: 9.8% for AGIs below $25k, 2.0% for AGIs $25k-50k, 2.7% for AGIs $75k-100k)
Taxable individual retirement arrangement distribution: $11,388 (reported on 7.1% of returns)
42757:
$11,388
Kentucky:
$14,296
(% of AGI for various income ranges: 2.9% for AGIs below $25k, 1.7% for AGIs $25k-50k, 6.1% for AGIs $50k-75k)
Total itemized deductions: $15,282 (24% of AGI, reported on 19.5% of returns)
Here:
$15,282
State:
$21,160
Here:
23.7% of AGI
State:
20.0% of AGI
(% of AGI for various income ranges: 4.6% for AGIs below $25k, 7.8% for AGIs $25k-50k, 9.0% for AGIs $50k-75k, 9.4% for AGIs $75k-100k, 9.6% for AGIs $100k-200k)
Charity contributions: $3,633 (reported on 13.3% of returns)
Here:
$3,633
State:
$4,303
(% of AGI for various income ranges: 1.5% for AGIs $25k-50k, 1.5% for AGIs $50k-75k, 2.4% for AGIs $75k-100k, 1.3% for AGIs $100k-200k)
Taxes paid: $4,155 (reported on 19.5% of returns)
42757:
$4,155
State:
$8,496
(% of AGI for various income ranges: 0.6% for AGIs below $25k, 1.6% for AGIs $25k-50k, 2.4% for AGIs $50k-75k, 3.1% for AGIs $75k-100k, 3.4% for AGIs $100k-200k)
Earned income credit: $2,571 (reported on 27.4% of returns)
Here:
$2,571
State:
$2,273
(% of AGI for various income ranges: 8.5% for AGIs below $25k, 1.4% for AGIs $25k-50k)
Percentage of individuals using paid preparers for their 2012 taxes: 72.6%
Here:
73%
State:
60%
(% for various income ranges: 70.2% for AGIs below $25k, 75.9% for AGIs $25k-50k, 71.4% for AGIs $50k-75k, 75.0% for AGIs $75k-100k, 80.0% for AGIs $100k-200k)
Averages for the 2004 tax year for zip code 42757, filed in 2005:
Average Adjusted Gross Income (AGI) in 2004: $29,449 (Individual Income Tax Returns)
Here:
$29,449
State:
$41,540
Salary/wage: $30,215 (reported on 78.4% of returns)
Here:
$30,215
State:
$36,432
(% of AGI for various income ranges: 82.0% for AGIs below $10k, 70.9% for AGIs $10k-25k, 84.2% for AGIs $25k-50k, 82.7% for AGIs $50k-75k, 88.6% for AGIs $75k-100k, 61.6% for AGIs over 100k)
Taxable interest for individuals: $1,366 (reported on 37.7% of returns)
This zip code:
$1,366
Kentucky:
$1,571
(% of AGI for various income ranges: 9.0% for AGIs below $10k, 3.5% for AGIs $10k-25k, 1.5% for AGIs $25k-50k, 1.2% for AGIs $50k-75k, 0.2% for AGIs $75k-100k, 0.2% for AGIs over 100k)
Taxable dividends: $339 (reported on 9.8% of returns)
Here:
$339
State:
$3,453
(% of AGI for various income ranges: 0.4% for AGIs below $10k, 0.2% for AGIs $10k-25k, 0.1% for AGIs $25k-50k, 0.1% for AGIs $50k-75k, 0.2% for AGIs $75k-100k)
Net capital gain/loss: +$4,132 (reported on 11.6% of returns)
Here:
+$4,132
State:
+$9,663
(% of AGI for various income ranges: 2.5% for AGIs below $10k, 1.7% for AGIs $10k-25k, 1.1% for AGIs $25k-50k, 0.9% for AGIs $50k-75k, 4.3% for AGIs $75k-100k)
Profit/loss from business: +$3,432 (reported on 19.5% of returns)
Here:
+$3,432
State:
+$9,233
(% of AGI for various income ranges: 17.8% for AGIs below $10k, 7.3% for AGIs $10k-25k, 0.6% for AGIs $25k-50k, 0.7% for AGIs $50k-75k, 0.1% for AGIs $75k-100k)
IRA payment deduction: $2,250 (reported on 1.0% of returns)
42757:
$2,250
Kentucky:
$2,955
Total itemized deductions: $14,577 (26% of AGI, reported on 19.3% of returns)
Here:
$14,577
State:
$17,474
Here:
26.0% of AGI
State:
21.0% of AGI
(% of AGI for various income ranges: 5.8% for AGIs $10k-25k, 8.2% for AGIs $25k-50k, 11.1% for AGIs $50k-75k, 13.8% for AGIs $75k-100k, 17.5% for AGIs over 100k)
Charity contributions deductions: $3,324 (6% of AGI, reported on 15.2% of returns)
Here:
$3,324
State:
$3,494
Here:
5.7% of AGI
State:
4.0% of AGI
(% of AGI for various income ranges: 0.6% for AGIs $10k-25k, 0.9% for AGIs $25k-50k, 2.0% for AGIs $50k-75k, 3.2% for AGIs $75k-100k, 5.5% for AGIs over 100k)
Total tax: $2,767 (reported on 70.1% of returns)
42757:
$2,767
State:
$6,162
(% of AGI for various income ranges: 4.3% for AGIs below $10k, 3.8% for AGIs $10k-25k, 5.8% for AGIs $25k-50k, 7.5% for AGIs $50k-75k, 9.4% for AGIs $75k-100k, 10.6% for AGIs over 100k)
Earned income credit: $2,061 (reported on 22.3% of returns)
Here:
$2,061
State:
$1,723
Percentage of individuals using paid preparers for their 2004 taxes: 81.2%
Here:
81%
State:
66%
(% for various income ranges: 77.9% for AGIs below $10k, 83.6% for AGIs $10k-25k, 80.4% for AGIs $25k-50k, 79.0% for AGIs $50k-75k, 84.5% for AGIs $75k-100k, 93.3% for AGIs over 100k)
Household received Food Stamps/SNAP in the past 12 months: 153 Household did not receive Food Stamps/SNAP in the past 12 months: 1,055
Women who had a birth in the past 12 months: 21 (21 now married, 0 unmarried) Women who did not have a birth in the past 12 months: 614 (338 now married, 278 unmarried)
Housing units in zip code 42757 with a mortgage: 546 (40 second mortgage, 40 both second mortgage and home equity loan) Houses without a mortgage: 11
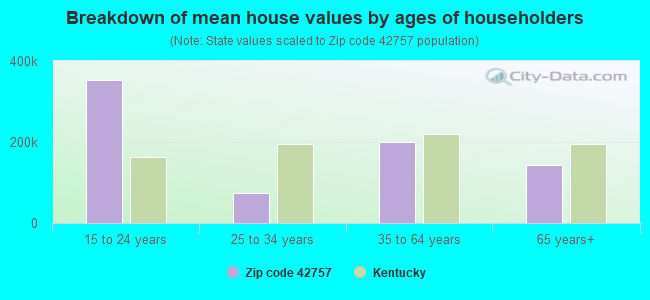
Median monthly owner costs for units with a mortgage: $1,043 Median monthly owner costs for units without a mortgage: $358
Residents with income below the poverty level in 2022:
This zip code:
23.4%
Whole state:
16.5%
Residents with income below 50% of the poverty level in 2022:
This zip code:
15.8%
Whole state:
9.0%
Median number of rooms in houses and condos:
Here:
5.9
State:
6.4
Median number of rooms in apartments:
Here:
5.3
State:
4.4
Notable locations in this zip code not listed on our city pages
Notable locations in zip code 42757: Aetna Furnace (A), Magnolia Fire Department (B), Linwood Volunteer Fire Department (C). Display/hide their locations on the map
Churches in zip code 42757 include: Friendship Church (A), Holly Grove Church (B), Knoxes Creek Baptist Church (C), Mount Moriah Baptist Church (D), Mount Sherman Church (E), Mount Zion Separate Baptist Church (F), Benningfield Chapel (G), Union Church (H), Shiboley Church (I). Display/hide their locations on the map
Cemeteries: Perkins Cemetery (1), Reynolds Cemetery (2), Dobson Cemetery (3), Williams Cemetery (4), Edwards Cemetery (5), Jaggers Cemetery (6), Holly Grove Cemetery (7). Display/hide their locations on the map
Streams, rivers, and creeks: Tampa Branch (A), Meadow Branch (B), Martis Branch (C), Brushy Fork (D), Locust Branch (E), Lindy Creek (F), Laurel Branch (G), Knox Creek (H), Pottinger Creek (I). Display/hide their locations on the map
Size of family households: 298 2-persons, 292 3-persons, 120 4-persons, 44 5-persons, 6 6-persons, 26 7-or-more-persons
Size of nonfamily households: 339 1-person, 83 2-persons
455 married couples with children.
51 single-parent households (15 men, 36 women).
98.6% of residents of 42757 zip code speak English at home.
1.2% of residents speak Spanish at home (100% very well).
0.1% of residents speak other Indo-European language at home (100% very well).
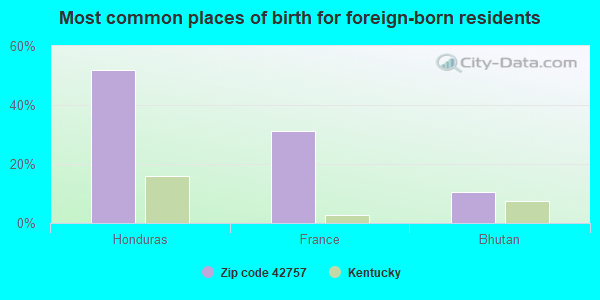
Foreign born population: 29 (1.0%) (84.0% of them are naturalized citizens)
This zip code:
1.0%
Whole state:
4.0%
52%Honduras
31%France
10%Bhutan
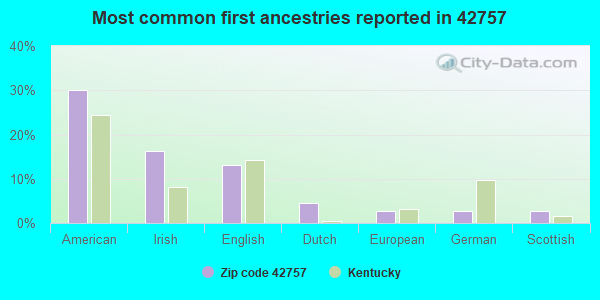
30%American
16%Irish
13%English
5%Dutch
3%European
3%German
3%Scottish
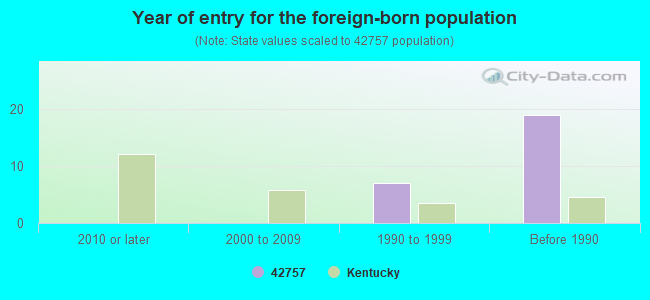
Year of entry for the foreign-born population
02010 or later
02000 to 2009
71990 to 1999
19Before 1990
Facilities with environmental interests located in this zip code:
MAGNOLIA ELEMENTARY SCHOOL (9050 NEW JACKSON HWY in MAGNOLIA, KY)
(National Center for Education Statistics) - STATE ID-062305070 Organizations: LARUE COUNTY (SCHOOL DISTRICT)
LG&E MAGNOLIA STGE FIELD REPLC (650 LG&E RD / OFFICE in MAGNOLIA, KY)
AIR MAJOR (AIRS/AFS) CRITERIA AND HAZARDOUS AIR POLLUTANT INVENTORY (Inventory of air pollution sources) National Pollutant Discharge Elimination System NON-MAJOR (Tracking pollutant discharge elimination systems) - permit Business SIC classification: WATER, SEWER, PIPELINE, AND COMMUNICATIONS AND POWER LINE CONSTRUCTION; NATURAL GAS TRANSMISSION Alternative names: LOUISVILLE GAS & ELECTRIC
LOUISVILLE GAS & ELECTRIC COMPANY (EON-U (APPROX. 700 FEET WEST OF MCS in MAGNOLIA, KY)
LOUISVILLE G&E CO MAGNOLIA STATION (HIGHWAY 1906 in MAGNOLIA, KY)
Conditionally Exempt Small Quantity Generators, less than 100 kg/month of hazardous waste (Resource Conservation and Recovery Act (tracking hazardous waste)) - notification Organizations: LOUISVILLE GAS AND ELECTRIC CO. (CONTACT/OWNER)
LARRY T GLASS CONSTRUCTION CO INC (3080 AETNA FURNACE RD in MAGNOLIA, KY)
CRITERIA AND HAZARDOUS AIR POLLUTANT INVENTORY (Inventory of air pollution sources) Business SIC classification: CONSTRUCTION SAND AND GRAVEL
Housing units lacking complete plumbing facilities: 9.2% Housing units lacking complete kitchen facilities: 7.4%
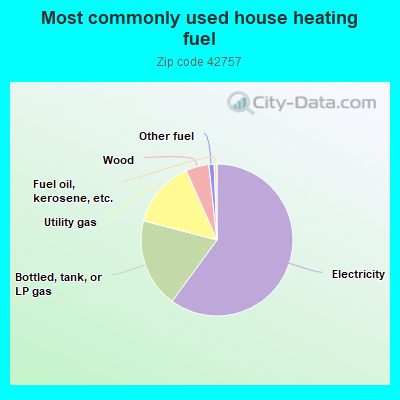
60.0%Electricity
19.0%Bottled, tank, or LP gas
14.3%Utility gas
4.9%Wood
1.1%Other fuel
0.6%Fuel oil, kerosene, etc.
Population in 1990: 2,960. Population change in the 1990s: +180 (+6.1%).
Place of birth for U.S.-born residents:
This state: 2,404
Northeast: 35
Midwest: 352
South: 136
West: 26
66% of the 42757 zip code residents lived in the same house 5 years ago. Out of people who lived in different houses, 47% lived in this county. Out of people who lived in different counties, 50% lived in Kentucky.
97% of the 42757 zip code residents lived in the same house 1 year ago. Out of people who lived in different houses, 22% moved from this county. Out of people who lived in different houses, 84% moved from different county within same state.
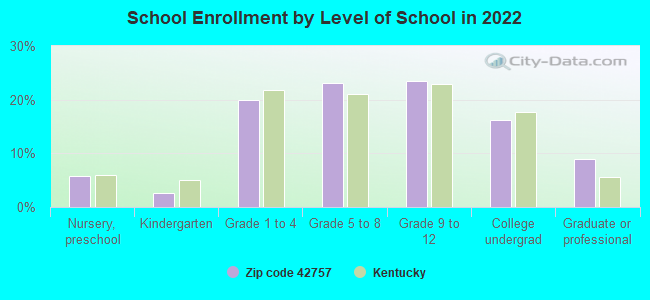
Private vs. public school enrollment:
Students in private schools in grades 1 to 8 (elementary and middle school): 38
Here:
16.5%
Kentucky:
17.2%
Students in private schools in grades 9 to 12 (high school): 36
Here:
28.5%
Kentucky:
15.2%
Students in private undergraduate colleges: 25
Here:
29.0%
Kentucky:
19.6%
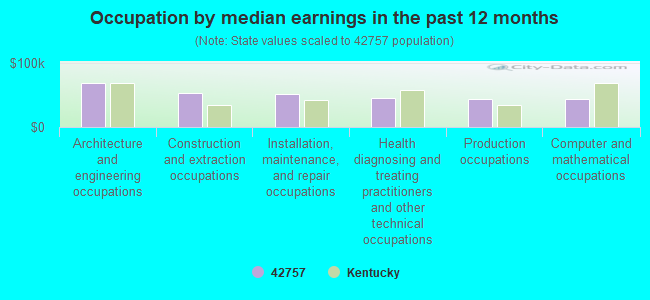
Occupation by median earnings in the past 12 months ($)
68,917Architecture and engineering occupations
53,184Construction and extraction occupations
51,190Installation, maintenance, and repair occupations
45,897Health diagnosing and treating practitioners and other technical occupations
44,628Production occupations
43,966Computer and mathematical occupations
Top industries in this zip code by the number of employees in 2005:
Utilities: Electric Power Distribution (20-49 employees: 1 establishment)
Other Services (except Public Administration): Religious Organizations (5-9: 2, 1-4: 2)
Other Services (except Public Administration): Automotive Transmission Repair (5-9: 1)
Finance and Insurance: Commercial Banking (5-9: 1)
Construction: Plumbing, Heating, and Air-Conditioning Contractors (1-4: 2)
Other Services (except Public Administration): Business Associations (1-4: 1)
Construction: Drywall and Insulation Contractors (1-4: 1)
Fatal accident statistics in 2014:
Fatal accident count: 1
Vehicles involved in fatal accidents: 1
Fatal accidents caused by drunken drivers: 0
Fatalities: 2
Persons involved in fatal accidents: 3
Pedestrians involved in fatal accidents: 0
Fatal accident statistics in 2013:
Fatal accident count: 2
Vehicles involved in fatal accidents: 2
Fatal accidents caused by drunken drivers: 1
Fatalities: 2
Persons involved in fatal accidents: 3
Pedestrians involved in fatal accidents: 0
2002 - 2018 National Fire Incident Reporting System (NFIRS) incidents
According to the data from the years 2002 - 2018 the average number of fires per year is 24. The highest number of reported fire incidents - 44 took place in 2012, and the least - 9 in 2016. The data has a declining trend.
When looking into fire subcategories, the most incidents belonged to: Outside Fires (42.1%), and Structure Fires (40.1%).
Fire incident types reported to NFIRS in Zip Code 42757


 Nearest zip codes: 42782, 42764, 42722, 42716, 42713, 42748.


 According to the data from the years 2002 - 2018 the average number of fires per year is 24. The highest number of reported fire incidents - 44 took place in 2012, and the least - 9 in 2016. The data has a declining trend.
 When looking into fire subcategories, the most incidents belonged to: Outside Fires (42.1%), and Structure Fires (40.1%).