Estimated zip code population in 2022: 6,848 Zip code population in 2010: 7,491 Zip code population in 2000: 6,188
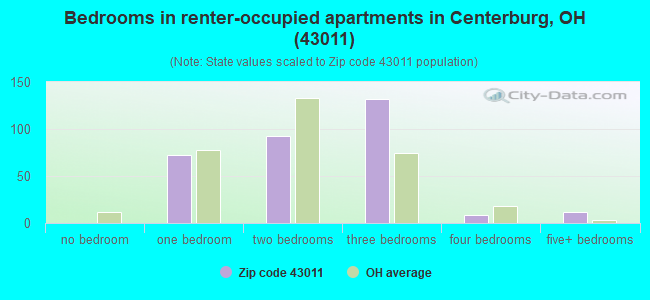
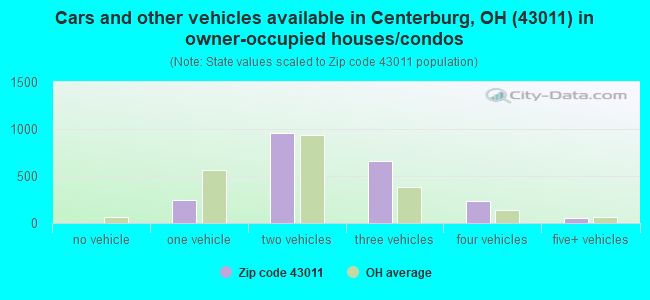
Houses and condos: 2,635 Renter-occupied apartments: 320
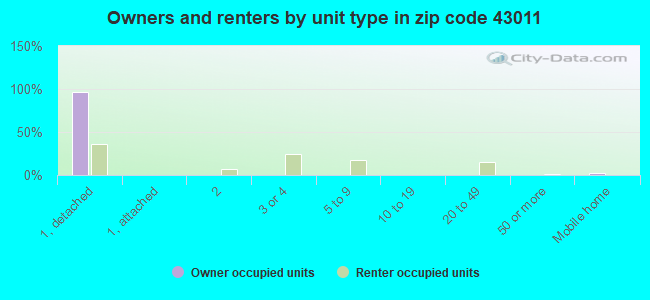
% of renters here:
13%
State:
33%
March 2022 cost of living index in zip code 43011: 83.6 (less than average, U.S. average is 100)
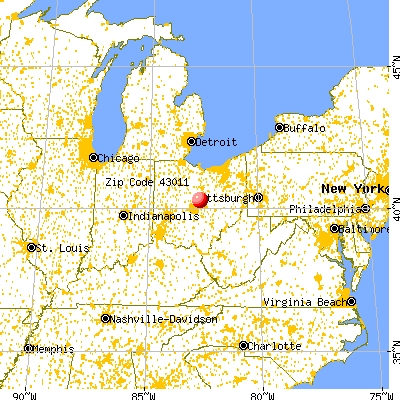
Land area: 82.5 sq. mi. Water area: 0.2 sq. mi.
Population density: 83 people per square mile
(very low).
OSM Map
General Map
Google Map
MSN Map
OSM Map
General Map
Google Map
MSN Map
OSM Map
General Map
Google Map
MSN Map
OSM Map
General Map
Google Map
MSN Map
Please wait while loading the map...
Real estate property taxes paid for housing units in 2022:
This zip code:
1.0% ($2,918)
Ohio:
1.3% ($2,639)
Median real estate property taxes paid for housing units with mortgages in 2022: $2,832 (1.0%) Median real estate property taxes paid for housing units with no mortgage in 2022: $3,184 (1.0%)
Business Search- 14 Million verified businesses
Males: 3,566
(52.1%)
Females: 3,282
(47.9%)
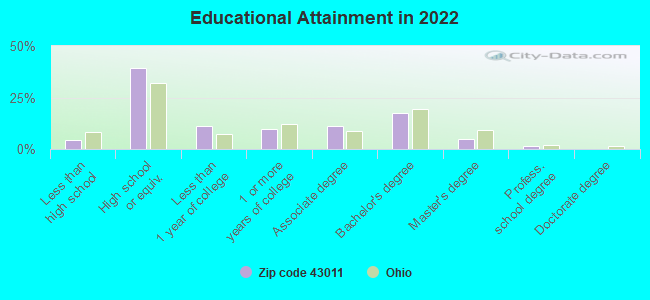
For population 25 years and over in 43011:
High school or higher: 95.1%
Bachelor's degree or higher: 23.9%
Graduate or professional degree: 6.5%
Unemployed: 1.9%
Mean travel time to work (commute): 31.8 minutes
For population 15 years and over in 43011:
Never married: 28.8%
Now married: 59.7%
Separated: 0.0%
Widowed: 5.0%
Divorced: 6.5%
Zip code 43011 compared to state average:
Unemployed percentage below state average.
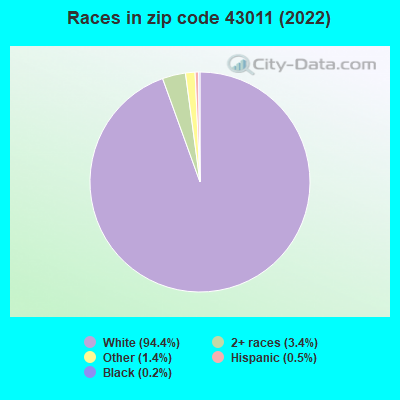
Black race population percentage significantly below state average.
Hispanic race population percentage significantly below state average.
Foreign-born population percentage significantly below state average.
Renting percentage significantly below state average.
Estimated median house/condo value in 2022: $288,501
43011:
$288,501
Ohio:
$204,100
According to our research of Ohio and other state lists, there were 7 registered sex offenders living in 43011 zip code as of June 08, 2024. The ratio of all residents to sex offenders in zip code 43011 is 1,189 to 1. The ratio of registered sex offenders to all residents in this zip code is lower than the state average.
Median resident age:
This zip code:
39.2 years
Ohio median age:
39.9 years
Average household size:
This zip code:
2.7 people
Ohio:
2.4 people
Averages for the 2020 tax year for zip code 43011, filed in 2021:
Average Adjusted Gross Income (AGI) in 2020: $69,648 (Individual Income Tax Returns)
Here:
$69,648
State:
$67,288
Salary/wage: $61,600 (reported on 82.3% of returns)
Here:
$61,600
State:
$55,628
(% of AGI for various income ranges: 1157.6% for AGIs below $25k, 3523.6% for AGIs $25k-50k, 6216.6% for AGIs $50k-75k, 9834.8% for AGIs $75k-100k, 17405.3% for AGIs $100k-200k, 64767.5% for AGIs over 200k)
Taxable interest for individuals: $1,040 (reported on 26.8% of returns)
This zip code:
$1,040
Ohio:
$1,518
(% of AGI for various income ranges: 12.8% for AGIs below $25k, 31.7% for AGIs $25k-50k, 11.4% for AGIs $50k-75k, 31.0% for AGIs $75k-100k, 94.4% for AGIs $100k-200k, 492.5% for AGIs over 200k)
Ordinary dividends: $3,090 (reported on 19.0% of returns)
Here:
$3,090
State:
$7,167
(% of AGI for various income ranges: 17.0% for AGIs below $25k, 47.3% for AGIs $25k-50k, 63.6% for AGIs $50k-75k, 75.5% for AGIs $75k-100k, 173.1% for AGIs $100k-200k, 1290.0% for AGIs over 200k)
Net capital gain/loss in AGI: +$9,862 (reported on 16.4% of returns)
Here:
+$9,862
State:
+$18,919
(% of AGI for various income ranges: 5.1% for AGIs below $25k, 16.3% for AGIs $25k-50k, 85.5% for AGIs $50k-75k, 171.7% for AGIs $75k-100k, 343.6% for AGIs $100k-200k, 8660.0% for AGIs over 200k)
Profit/loss from business: +$15,378 (reported on 18.5% of returns)
Here:
+$15,378
State:
+$13,744
(% of AGI for various income ranges: 156.6% for AGIs below $25k, 247.5% for AGIs $25k-50k, 352.5% for AGIs $50k-75k, 398.6% for AGIs $75k-100k, 657.8% for AGIs $100k-200k, 5930.0% for AGIs over 200k)
Taxable individual retirement arrangement distribution: $18,618 (reported on 10.7% of returns)
43011:
$18,618
Ohio:
$18,876
(% of AGI for various income ranges: 62.8% for AGIs below $25k, 186.6% for AGIs $25k-50k, 239.1% for AGIs $50k-75k, 354.1% for AGIs $75k-100k, 849.1% for AGIs $100k-200k)
Total itemized deductions: $26,056 (reported on 6.7% of returns)
Here:
$26,056
State:
$33,869
(% of AGI for various income ranges: 144.2% for AGIs $25k-50k, 142.0% for AGIs $50k-75k, 304.8% for AGIs $75k-100k, 637.3% for AGIs $100k-200k, 3215.0% for AGIs over 200k)
Charity contributions: $9,206 (reported on 4.8% of returns)
Here:
$9,206
State:
$14,577
(% of AGI for various income ranges: 38.0% for AGIs $50k-75k, 31.0% for AGIs $75k-100k, 203.8% for AGIs $100k-200k, 1207.5% for AGIs over 200k)
Taxes paid: $6,968 (reported on 6.7% of returns)
43011:
$6,968
State:
$7,681
(% of AGI for various income ranges: 18.6% for AGIs $25k-50k, 43.2% for AGIs $50k-75k, 77.2% for AGIs $75k-100k, 186.4% for AGIs $100k-200k, 947.5% for AGIs over 200k)
Earned income credit: $2,013 (reported on 10.2% of returns)
Here:
$2,013
State:
$2,304
(% of AGI for various income ranges: 64.2% for AGIs below $25k, 50.7% for AGIs $25k-50k, 2.3% for AGIs $50k-75k)
Percentage of individuals using paid preparers for their 2020 taxes: 94.1%
Here:
94%
State:
94%
(% for various income ranges: 92.1% for AGIs below $25k, 94.9% for AGIs $25k-50k, 95.1% for AGIs $50k-75k, 93.0% for AGIs $75k-100k, 94.8% for AGIs $100k-200k, 100.0% for AGIs over 200k)
Averages for the 2012 tax year for zip code 43011, filed in 2013:
Average Adjusted Gross Income (AGI) in 2012: $53,901 (Individual Income Tax Returns)
Here:
$53,901
State:
$54,926
Salary/wage: $48,707 (reported on 85.2% of returns)
Here:
$48,707
State:
$45,869
(% of AGI for various income ranges: 73.2% for AGIs below $25k, 78.2% for AGIs $25k-50k, 79.4% for AGIs $50k-75k, 83.2% for AGIs $75k-100k, 79.4% for AGIs $100k-200k, 53.0% for AGIs over 200k)
Taxable interest for individuals: $891 (reported on 30.1% of returns)
This zip code:
$891
Ohio:
$1,297
(% of AGI for various income ranges: 1.8% for AGIs below $25k, 0.5% for AGIs $25k-50k, 0.3% for AGIs $50k-75k, 0.3% for AGIs $75k-100k, 0.3% for AGIs $100k-200k, 0.8% for AGIs over 200k)
Ordinary dividends: $2,168 (reported on 17.8% of returns)
Here:
$2,168
State:
$5,821
(% of AGI for various income ranges: 1.0% for AGIs below $25k, 0.7% for AGIs $25k-50k, 0.8% for AGIs $50k-75k, 0.7% for AGIs $75k-100k, 0.3% for AGIs $100k-200k, 1.3% for AGIs over 200k)
Net capital gain/loss in AGI: +$7,190 (reported on 11.7% of returns)
Here:
+$7,190
State:
+$11,232
(% of AGI for various income ranges: 0.1% for AGIs $25k-50k, 0.1% for AGIs $75k-100k, 1.6% for AGIs $100k-200k, 11.7% for AGIs over 200k)
Profit/loss from business: +$9,987 (reported on 18.1% of returns)
Here:
+$9,987
State:
+$12,773
(% of AGI for various income ranges: 8.6% for AGIs below $25k, 3.9% for AGIs $25k-50k, 3.5% for AGIs $50k-75k, 1.5% for AGIs $75k-100k, 4.0% for AGIs $100k-200k)
Taxable individual retirement arrangement distribution: $13,941 (reported on 9.6% of returns)
43011:
$13,941
Ohio:
$14,511
(% of AGI for various income ranges: 3.4% for AGIs below $25k, 2.4% for AGIs $25k-50k, 1.9% for AGIs $50k-75k, 2.2% for AGIs $75k-100k, 3.8% for AGIs $100k-200k)
Total itemized deductions: $17,822 (21% of AGI, reported on 40.4% of returns)
Here:
$17,822
State:
$21,278
Here:
21.0% of AGI
State:
18.8% of AGI
(% of AGI for various income ranges: 9.0% for AGIs below $25k, 10.0% for AGIs $25k-50k, 13.8% for AGIs $50k-75k, 13.8% for AGIs $75k-100k, 16.1% for AGIs $100k-200k, 13.1% for AGIs over 200k)
Charity contributions: $2,823 (reported on 29.8% of returns)
Here:
$2,823
State:
$3,943
(% of AGI for various income ranges: 0.6% for AGIs below $25k, 1.0% for AGIs $25k-50k, 1.4% for AGIs $50k-75k, 1.4% for AGIs $75k-100k, 2.2% for AGIs $100k-200k, 2.1% for AGIs over 200k)
Taxes paid: $7,262 (reported on 40.1% of returns)
43011:
$7,262
State:
$9,568
(% of AGI for various income ranges: 2.1% for AGIs below $25k, 2.9% for AGIs $25k-50k, 5.1% for AGIs $50k-75k, 5.8% for AGIs $75k-100k, 7.5% for AGIs $100k-200k, 6.6% for AGIs over 200k)
Earned income credit: $2,232 (reported on 13.3% of returns)
Here:
$2,232
State:
$2,285
(% of AGI for various income ranges: 5.6% for AGIs below $25k, 0.9% for AGIs $25k-50k)
Percentage of individuals using paid preparers for their 2012 taxes: 53.3%
Here:
53%
State:
51%
(% for various income ranges: 43.4% for AGIs below $25k, 56.5% for AGIs $25k-50k, 60.7% for AGIs $50k-75k, 57.9% for AGIs $75k-100k, 54.1% for AGIs $100k-200k, 80.0% for AGIs over 200k)
Averages for the 2004 tax year for zip code 43011, filed in 2005:
Average Adjusted Gross Income (AGI) in 2004: $44,711 (Individual Income Tax Returns)
Here:
$44,711
State:
$44,480
Salary/wage: $42,235 (reported on 87.2% of returns)
Here:
$42,235
State:
$39,198
(% of AGI for various income ranges: 119.3% for AGIs below $10k, 70.9% for AGIs $10k-25k, 83.8% for AGIs $25k-50k, 86.9% for AGIs $50k-75k, 85.1% for AGIs $75k-100k, 74.7% for AGIs over 100k)
Taxable interest for individuals: $909 (reported on 42.6% of returns)
This zip code:
$909
Ohio:
$1,532
(% of AGI for various income ranges: 4.3% for AGIs below $10k, 2.3% for AGIs $10k-25k, 1.1% for AGIs $25k-50k, 0.6% for AGIs $50k-75k, 0.6% for AGIs $75k-100k, 0.5% for AGIs over 100k)
Taxable dividends: $1,390 (reported on 20.6% of returns)
Here:
$1,390
State:
$3,496
(% of AGI for various income ranges: 1.0% for AGIs below $10k, 0.8% for AGIs $10k-25k, 0.5% for AGIs $25k-50k, 0.8% for AGIs $50k-75k, 0.4% for AGIs $75k-100k, 0.8% for AGIs over 100k)
Net capital gain/loss: +$4,379 (reported on 16.2% of returns)
Here:
+$4,379
State:
+$8,582
(% of AGI for various income ranges: -1.5% for AGIs below $10k, 0.6% for AGIs $10k-25k, 1.2% for AGIs $25k-50k, 1.3% for AGIs $50k-75k, 1.6% for AGIs $75k-100k, 2.9% for AGIs over 100k)
Profit/loss from business: +$9,344 (reported on 17.7% of returns)
Here:
+$9,344
State:
+$10,813
(% of AGI for various income ranges: -9.8% for AGIs below $10k, 10.3% for AGIs $10k-25k, 3.4% for AGIs $25k-50k, 2.6% for AGIs $50k-75k, 4.0% for AGIs $75k-100k, 3.6% for AGIs over 100k)
IRA payment deduction: $2,975 (reported on 2.6% of returns)
43011:
$2,975
Ohio:
$2,794
(% of AGI for various income ranges: 0.2% for AGIs $10k-25k, 0.2% for AGIs $25k-50k, 0.2% for AGIs $50k-75k, 0.4% for AGIs $75k-100k)
Self-employed pension: $7,800 (reported on 0.5% of returns)
Here:
$7,800
Ohio:
$13,981
Total itemized deductions: $15,450 (23% of AGI, reported on 45.1% of returns)
Here:
$15,450
State:
$17,503
Here:
22.8% of AGI
State:
20.8% of AGI
(% of AGI for various income ranges: 10.9% for AGIs below $10k, 10.0% for AGIs $10k-25k, 14.1% for AGIs $25k-50k, 16.9% for AGIs $50k-75k, 17.1% for AGIs $75k-100k, 16.5% for AGIs over 100k)
Charity contributions deductions: $2,049 (3% of AGI, reported on 34.6% of returns)
Here:
$2,049
State:
$3,087
Here:
2.9% of AGI
State:
3.4% of AGI
(% of AGI for various income ranges: 0.5% for AGIs below $10k, 0.8% for AGIs $10k-25k, 1.1% for AGIs $25k-50k, 1.8% for AGIs $50k-75k, 1.6% for AGIs $75k-100k, 2.2% for AGIs over 100k)
Total tax: $5,342 (reported on 81.3% of returns)
43011:
$5,342
State:
$6,781
(% of AGI for various income ranges: 3.4% for AGIs below $10k, 5.2% for AGIs $10k-25k, 7.3% for AGIs $25k-50k, 8.4% for AGIs $50k-75k, 10.0% for AGIs $75k-100k, 15.8% for AGIs over 100k)
Earned income credit: $1,560 (reported on 8.9% of returns)
Here:
$1,560
State:
$1,696
Percentage of individuals using paid preparers for their 2004 taxes: 54.3%
Here:
54%
State:
55%
(% for various income ranges: 47.0% for AGIs below $10k, 57.8% for AGIs $10k-25k, 57.0% for AGIs $25k-50k, 53.5% for AGIs $50k-75k, 48.9% for AGIs $75k-100k, 60.9% for AGIs over 100k)
Household received Food Stamps/SNAP in the past 12 months: 204 Household did not receive Food Stamps/SNAP in the past 12 months: 2,267
Women who had a birth in the past 12 months: 65 (62 now married, 3 unmarried) Women who did not have a birth in the past 12 months: 1,441 (742 now married, 697 unmarried)
Housing units in zip code 43011 with a mortgage: 1,574 (119 second mortgage, 2 home equity loan, 94 both second mortgage and home equity loan) Houses without a mortgage: 36
Median monthly owner costs for units with a mortgage: $1,590 Median monthly owner costs for units without a mortgage: $667
Residents with income below the poverty level in 2022:
This zip code:
4.3%
Whole state:
13.4%
Residents with income below 50% of the poverty level in 2022:
This zip code:
1.7%
Whole state:
7.0%
Median number of rooms in houses and condos:
Here:
6.6
State:
6.7
Median number of rooms in apartments:
Here:
5.1
State:
4.4
Notable locations in this zip code not listed on our city pages
Notable locations in zip code 43011: Wyandot Golf Course (A), Table Rock Golf Course (B), Otter Fork Swine Farm (C), Milford Township House (D), Central Ohio Joint Fire District (E). Display/hide their locations on the map
Churches in zip code 43011 include: Advent Church (A), Bennington Chapel (B), Milford Church (C), Mount Pleasant Community Church (D), School Land Church (E), Centerburg United Methodist Church (F), Centerburg Christian Church (G), Grace Lutheran Church (H). Display/hide their locations on the map
Cemeteries: Bloomfield Cemetery (1), Centerburg Cemetery (2), Robinson Cemetery (3), Preacher Daveys Graveyard (4), Mount Pleasant Methodist Episcopal Churchyard (5), Dowell Cemetery (6), Eastview Cemetery (7). Display/hide their locations on the map
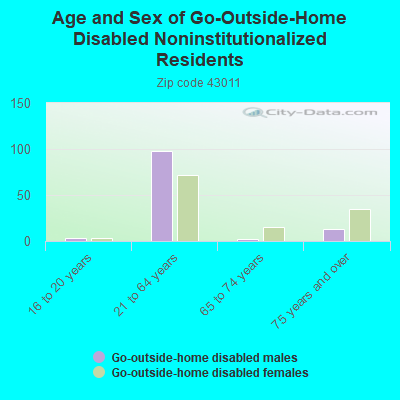
In group quarters: 128 (-1 institutionalized population)
Size of family households: 783 2-persons, 419 3-persons, 261 4-persons, 205 5-persons, 8 6-persons, 79 7-or-more-persons
Size of nonfamily households: 591 1-person, 108 2-persons, 5 3-persons
1,413 married couples with children.
98 single-parent households (23 men, 75 women).
98.6% of residents of 43011 zip code speak English at home.
0.5% of residents speak Spanish at home (60% very well, 40% well).
0.6% of residents speak other Indo-European language at home (80% very well, 20% well).
Foreign born population: 50 (0.7%) (51.5% of them are naturalized citizens)
This zip code:
0.7%
Whole state:
5.0%
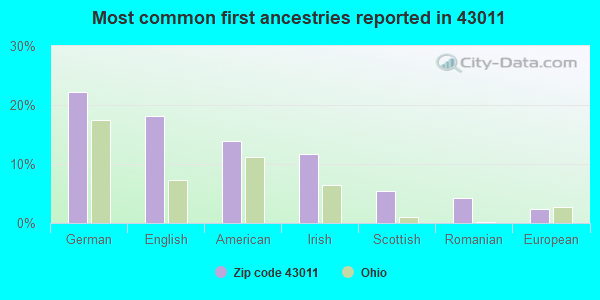
24%Latvia
22%German
18%English
14%American
12%Irish
5%Scottish
4%Romanian
2%European
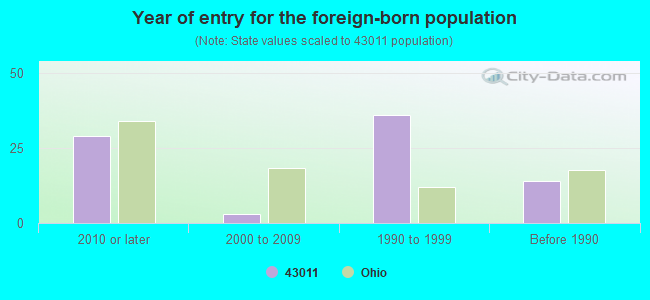
Year of entry for the foreign-born population
292010 or later
32000 to 2009
361990 to 1999
14Before 1990
Facilities with environmental interests located in this zip code:
CENTERBURG WTP (100 JOHNSONVILLE ROAD in CENTERBURG, OH)
STATE MASTER (Ohio general info) - PCS-OH0031585, National Pollutant Discharge Elimination System Permit, SDWIS-4200012, DRINKING WATER PROGRAM National Pollutant Discharge Elimination System NON-MAJOR (Tracking pollutant discharge elimination systems) - permit COMMUNITY WATER SYSTEM (SDWIS) - SDWIS-OH4200012 1, WATER TREATMENT PLANT Business SIC classification: WATER SUPPLY Organizations: VILLAGE OF CENTERBURG (CONTACT/OWNER)
Alternative names: CENTERBURG WATER PLANT
CENTERBURG HIGH SCHOOL (119 S PRESTON in CENTERBURG, OH)
(National Center for Education Statistics) - STATE ID-005298 STATE MASTER (Ohio general info) - AIR MAJOR Organizations: CENTERBURG LOCAL SD (SCHOOL DISTRICT)
CENTERBURG WWTP (27 NORTH HARTFORD AVENUE in CENTERBURG, OH)
STATE MASTER (Ohio general info) - PCS-OH0020915, National Pollutant Discharge Elimination System Permit National Pollutant Discharge Elimination System NON-MAJOR (Tracking pollutant discharge elimination systems) - permit National Pollutant Discharge Elimination System NON-MAJOR (Tracking pollutant discharge elimination systems) - permit Business SIC classification: SEWERAGE SYSTEMS Organizations: VILLAGE OF CENTERBURG (CONTACT/OWNER)
Alternative names: CENTERBURG, VILLAGE OF, VILLAGE OF CENTERBURG
CENTERBURG ELEMENTARY SCHOOL (207 S PRESTON ST in CENTERBURG, OH)
(Geographic Names Information System) (National Center for Education Statistics) - STATE ID-005280 Organizations: CENTERBURG LOCAL SD (SCHOOL DISTRICT)
CENTERBURG MIDDLE SCHOOL (3782 COLUMBUS ROAD in CENTERBURG, OH)
(National Center for Education Statistics) - STATE ID-000187
Housing units lacking complete plumbing facilities: 0.9% Housing units lacking complete kitchen facilities: 0.9%
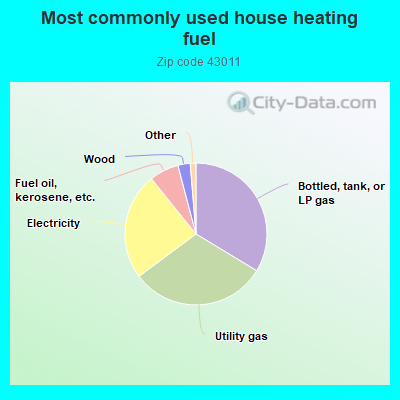
33.7%Bottled, tank, or LP gas
31.2%Utility gas
24.4%Electricity
6.7%Fuel oil, kerosene, etc.
2.8%Wood
0.7%Other fuel
0.6%No fuel used
Population in 1990: 4,437. Population change in the 1990s: +1,751 (+39.5%).
Place of birth for U.S.-born residents:
This state: 5,300
Northeast: 279
Midwest: 139
South: 796
West: 232
63% of the 43011 zip code residents lived in the same house 5 years ago. Out of people who lived in different houses, 40% lived in this county. Out of people who lived in different counties, 50% lived in Ohio.
96% of the 43011 zip code residents lived in the same house 1 year ago. Out of people who lived in different houses, 50% moved from this county. Out of people who lived in different houses, 48% moved from different county within same state. Out of people who lived in different houses, 16% moved from different state.
Private vs. public school enrollment:
Students in private schools in grades 1 to 8 (elementary and middle school): 81
Here:
9.5%
Ohio:
16.0%
Students in private schools in grades 9 to 12 (high school):
Here:
0.0%
Ohio:
13.1%
Students in private undergraduate colleges: 49
Here:
13.2%
Ohio:
22.3%
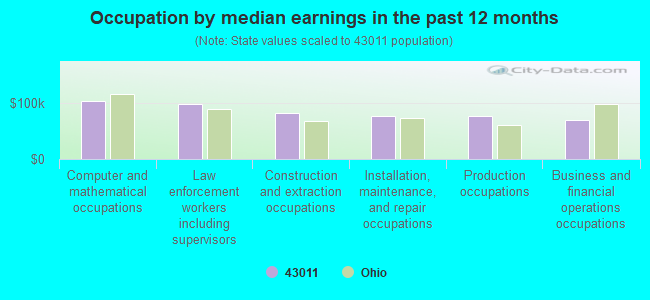
Occupation by median earnings in the past 12 months ($)
104,713Computer and mathematical occupations
97,956Law enforcement workers including supervisors
82,176Construction and extraction occupations
76,859Installation, maintenance, and repair occupations
76,256Production occupations
69,224Business and financial operations occupations
Companies with federal contracts located in this zip code:
HEALTH CARE AND RETIREMENT COR (0000) (212 FAIRVIEW AVE in CENTERBURG, OH) : $252,104 in 12 contractsfrom 1999 to 2006
Contracts for Nursing Home Care Contracts by Department of Veterans Affairs Signed by year:2000: $78,000; 2001: $24,000; 2002: $37,000; 2003: $900; 2004: $0; 2005: $69,854; 2006: $12,350.
Biggest contracts:
$39,292 with Department of Veterans Affairs for Nursing Home Care Contracts. Signed on 2005-04-01. Completion date: 2005-06-30.
$36,000, same as above.Signed on 2002-10-15. Completion date: 2003-09-15.
$30,000, same as above.Signed on 1999-10-15. Completion date: 2000-01-15.
$29,762, same as above.Signed on 2005-07-01. Completion date: 2005-09-30.
POLING/HOWES ENTERPRISES (5517 GILBERT ROAD in CENTERBURG, OH; small business) : $110,050 in 2 contractsin 1999
$110,050 with Department of Defense for Landscaping/Groundskeeping Services. Signed on 1999-11-04. Completion date: 2000-02-29.
$0, same as above.Signed on 1999-11-04. Completion date: 2000-02-29.
Top industries in this zip code by the number of employees in 2005:
Health Care and Social Assistance: Nursing Care Facilities (50-99 employees: 1 establishment, 20-49 employees: 1 establishment)
Professional, Scientific, and Technical Services: Offices of Lawyers (20-49: 1, 1-4: 1)
Wholesale Trade: Recyclable Material Merchant Wholesalers (20-49: 1)
2002 - 2018 National Fire Incident Reporting System (NFIRS) incidents
Based on the data from the years 2002 - 2018 the average number of fire incidents per year is 51. The highest number of reported fires - 76 took place in 2014, and the least - 29 in 2002. The data has an increasing trend.
When looking into fire subcategories, the most reports belonged to: Structure Fires (54.1%), and Outside Fires (38.5%).
Fire incident types reported to NFIRS in Zip Code 43011


 Nearest zip codes: 43013, 43031, 43334, 43317, 43074, 43050.


 Based on the data from the years 2002 - 2018 the average number of fire incidents per year is 51. The highest number of reported fires - 76 took place in 2014, and the least - 29 in 2002. The data has an increasing trend.
 When looking into fire subcategories, the most reports belonged to: Structure Fires (54.1%), and Outside Fires (38.5%).