Estimated zip code population in 2022: 1,401 Zip code population in 2010: 1,201 Zip code population in 2000: 979
Houses and condos: 521 Renter-occupied apartments: 60
% of renters here:
13%
State:
33%
March 2022 cost of living index in zip code 43013: 84.6 (less than average, U.S. average is 100)
Land area: 19.2 sq. mi. Water area: 0.0 sq. mi.
Population density: 73 people per square mile
(very low).
OSM Map
General Map
Google Map
MSN Map
OSM Map
General Map
Google Map
MSN Map
OSM Map
General Map
Google Map
MSN Map
OSM Map
General Map
Google Map
MSN Map
Please wait while loading the map...
Real estate property taxes paid for housing units in 2022:
This zip code:
1.3% ($5,030)
Ohio:
1.3% ($2,639)
Median real estate property taxes paid for housing units with mortgages in 2022: $5,374 (1.2%) Median real estate property taxes paid for housing units with no mortgage in 2022: $2,619 (0.9%)
Business Search- 14 Million verified businesses
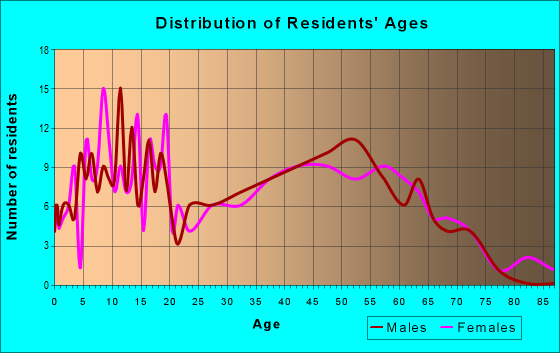
Males: 674
(48.1%)
Females: 727
(51.9%)
For population 25 years and over in 43013:
High school or higher: 98.8%
Bachelor's degree or higher: 39.5%
Graduate or professional degree: 4.5%
Unemployed: 4.0%
Mean travel time to work (commute): 31.7 minutes
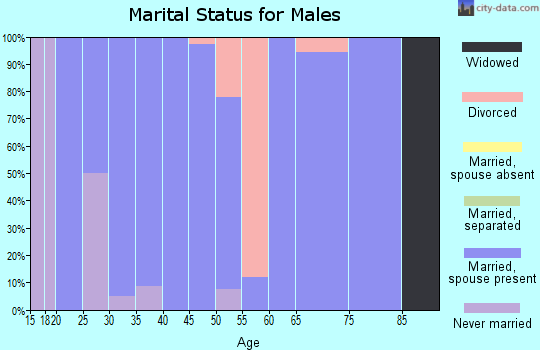
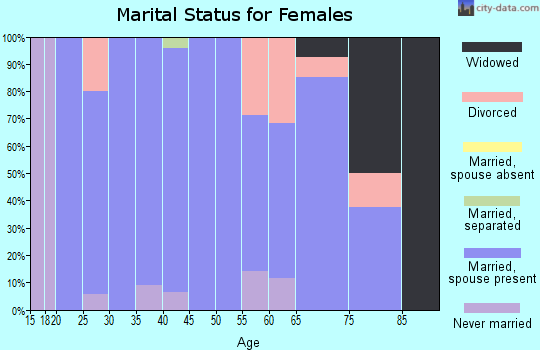
For population 15 years and over in 43013:
Never married: 17.7%
Now married: 72.1%
Separated: 0.7%
Widowed: 7.1%
Divorced: 2.4%
Zip code 43013 compared to state average:
Median household income above state average.
Median house value above state average.
Black race population percentage significantly below state average.
Hispanic race population percentage significantly below state average.
Foreign-born population percentage significantly below state average.
Renting percentage significantly below state average.
Length of stay since moving in significantly above state average.
Number of rooms per house above state average.
Number of college students significantly below state average.
Estimated median house/condo value in 2022: $385,930
43013:
$385,930
Ohio:
$204,100
Median resident age:
This zip code:
42.7 years
Ohio median age:
39.9 years
Average household size:
This zip code:
2.9 people
Ohio:
2.4 people
Averages for the 2020 tax year for zip code 43013, filed in 2021:
Average Adjusted Gross Income (AGI) in 2020: $62,849 (Individual Income Tax Returns)
Here:
$62,849
State:
$67,288
Salary/wage: $59,471 (reported on 81.4% of returns)
Here:
$59,471
State:
$55,628
(% of AGI for various income ranges: 1010.9% for AGIs below $25k, 3650.0% for AGIs $25k-50k, 7301.7% for AGIs $50k-75k, 9826.0% for AGIs $75k-100k, 20178.6% for AGIs $100k-200k)
Taxable interest for individuals: $353 (reported on 25.4% of returns)
This zip code:
$353
Ohio:
$1,518
(% of AGI for various income ranges: 4.5% for AGIs below $25k, 7.3% for AGIs $25k-50k, 6.0% for AGIs $75k-100k, 52.9% for AGIs $100k-200k)
Ordinary dividends: $1,240 (reported on 16.9% of returns)
Here:
$1,240
State:
$7,167
(% of AGI for various income ranges: 20.0% for AGIs $25k-50k, 110.0% for AGIs $50k-75k, 51.4% for AGIs $100k-200k)
Net capital gain/loss in AGI: +$6,067 (reported on 15.3% of returns)
Here:
+$6,067
State:
+$18,919
(% of AGI for various income ranges: 19.1% for AGIs below $25k, 141.7% for AGIs $50k-75k, 628.6% for AGIs $100k-200k)
Profit/loss from business: +$9,600 (reported on 16.9% of returns)
Here:
+$9,600
State:
+$13,744
(% of AGI for various income ranges: 277.3% for AGIs below $25k, 261.8% for AGIs $25k-50k, 734.0% for AGIs $75k-100k)
Taxable individual retirement arrangement distribution: $12,175 (reported on 6.8% of returns)
43013:
$12,175
Ohio:
$18,876
(% of AGI for various income ranges: 202.7% for AGIs below $25k, 440.0% for AGIs $50k-75k)
Total itemized deductions: $25,350 (reported on 6.8% of returns)
Here:
$25,350
State:
$33,869
(% of AGI for various income ranges: 431.8% for AGIs below $25k, 770.0% for AGIs $100k-200k)
Charity contributions: $8,633 (reported on 5.1% of returns)
Here:
$8,633
State:
$14,577
(% of AGI for various income ranges: 518.0% for AGIs $75k-100k)
Taxes paid: $6,850 (reported on 6.8% of returns)
43013:
$6,850
State:
$7,681
(% of AGI for various income ranges: 548.0% for AGIs $75k-100k)
Earned income credit: $2,414 (reported on 11.9% of returns)
Here:
$2,414
State:
$2,304
(% of AGI for various income ranges: 97.3% for AGIs below $25k, 56.4% for AGIs $25k-50k)
Percentage of individuals using paid preparers for their 2020 taxes: 93.2%
Here:
93%
State:
94%
(% for various income ranges: 93.8% for AGIs below $25k, 92.9% for AGIs $25k-50k, 90.0% for AGIs $50k-75k, 100.0% for AGIs $75k-100k, 91.7% for AGIs $100k-200k)
Averages for the 2012 tax year for zip code 43013, filed in 2013:
Average Adjusted Gross Income (AGI) in 2012: $52,059 (Individual Income Tax Returns)
Here:
$52,059
State:
$54,926
Salary/wage: $48,778 (reported on 83.3% of returns)
Here:
$48,778
State:
$45,869
(% of AGI for various income ranges: 80.7% for AGIs below $25k, 76.6% for AGIs $25k-50k, 77.7% for AGIs $50k-75k, 83.8% for AGIs $75k-100k, 75.4% for AGIs $100k-200k)
Taxable interest for individuals: $288 (reported on 31.5% of returns)
This zip code:
$288
Ohio:
$1,297
(% of AGI for various income ranges: 1.0% for AGIs below $25k, 0.2% for AGIs $50k-75k, 0.1% for AGIs $75k-100k)
Ordinary dividends: $1,356 (reported on 16.7% of returns)
Here:
$1,356
State:
$5,821
(% of AGI for various income ranges: 1.0% for AGIs below $25k, 0.3% for AGIs $25k-50k, 1.0% for AGIs $50k-75k, 0.2% for AGIs $100k-200k)
Net capital gain/loss in AGI: +$167 (reported on 11.1% of returns)
Here:
+$167
State:
+$11,232
(% of AGI for various income ranges: 0.2% for AGIs $25k-50k)
Profit/loss from business: +$6,690 (reported on 18.5% of returns)
Here:
+$6,690
State:
+$12,773
(% of AGI for various income ranges: 8.3% for AGIs below $25k, 5.1% for AGIs $25k-50k, 3.0% for AGIs $50k-75k)
Taxable individual retirement arrangement distribution: $7,267 (reported on 11.1% of returns)
43013:
$7,267
Ohio:
$14,511
(% of AGI for various income ranges: 8.8% for AGIs below $25k, 3.7% for AGIs $50k-75k)
Total itemized deductions: $17,965 (23% of AGI, reported on 37.0% of returns)
Here:
$17,965
State:
$21,278
Here:
22.7% of AGI
State:
18.8% of AGI
(% of AGI for various income ranges: 15.7% for AGIs $25k-50k, 10.8% for AGIs $50k-75k, 13.8% for AGIs $75k-100k, 15.0% for AGIs $100k-200k)
Charity contributions: $2,500 (reported on 27.8% of returns)
Here:
$2,500
State:
$3,943
(% of AGI for various income ranges: 0.8% for AGIs $25k-50k, 1.4% for AGIs $50k-75k, 1.7% for AGIs $75k-100k, 1.8% for AGIs $100k-200k)
Taxes paid: $6,615 (reported on 37.0% of returns)
43013:
$6,615
State:
$9,568
(% of AGI for various income ranges: 4.1% for AGIs $25k-50k, 4.1% for AGIs $50k-75k, 5.1% for AGIs $75k-100k, 6.5% for AGIs $100k-200k)
Earned income credit: $1,862 (reported on 14.8% of returns)
Here:
$1,862
State:
$2,285
(% of AGI for various income ranges: 4.7% for AGIs below $25k, 0.7% for AGIs $25k-50k)
Percentage of individuals using paid preparers for their 2012 taxes: 48.1%
Here:
48%
State:
51%
(% for various income ranges: 41.2% for AGIs below $25k, 46.7% for AGIs $25k-50k, 50.0% for AGIs $50k-75k, 50.0% for AGIs $75k-100k, 66.7% for AGIs $100k-200k)
Averages for the 2004 tax year for zip code 43013, filed in 2005:
Average Adjusted Gross Income (AGI) in 2004: $39,163 (Individual Income Tax Returns)
Here:
$39,163
State:
$44,480
Salary/wage: $38,041 (reported on 87.5% of returns)
Here:
$38,041
State:
$39,198
(% of AGI for various income ranges: 98.5% for AGIs below $10k, 82.3% for AGIs $10k-25k, 84.1% for AGIs $25k-50k, 85.7% for AGIs $50k-75k, 88.3% for AGIs $75k-100k, 81.8% for AGIs over 100k)
Taxable interest for individuals: $546 (reported on 38.4% of returns)
This zip code:
$546
Ohio:
$1,532
(% of AGI for various income ranges: 4.2% for AGIs below $10k, 1.5% for AGIs $10k-25k, 0.5% for AGIs $25k-50k, 0.5% for AGIs $50k-75k, 0.1% for AGIs $75k-100k, 0.2% for AGIs over 100k)
Taxable dividends: $921 (reported on 18.9% of returns)
Here:
$921
State:
$3,496
(% of AGI for various income ranges: 2.1% for AGIs $10k-25k, 0.7% for AGIs $25k-50k, 0.0% for AGIs $50k-75k, 0.1% for AGIs $75k-100k)
Net capital gain/loss: +$1,620 (reported on 13.3% of returns)
Here:
+$1,620
State:
+$8,582
(% of AGI for various income ranges: 3.8% for AGIs below $10k, 0.5% for AGIs $10k-25k, 1.0% for AGIs $25k-50k, 0.1% for AGIs $50k-75k, 0.7% for AGIs $75k-100k)
Profit/loss from business: +$4,495 (reported on 18.9% of returns)
Here:
+$4,495
State:
+$10,813
(% of AGI for various income ranges: 4.8% for AGIs $10k-25k, 3.9% for AGIs $25k-50k, 1.6% for AGIs $50k-75k, -0.1% for AGIs $75k-100k)
Total itemized deductions: $14,596 (25% of AGI, reported on 41.8% of returns)
Here:
$14,596
State:
$17,503
Here:
25.2% of AGI
State:
20.8% of AGI
(% of AGI for various income ranges: 13.8% for AGIs $10k-25k, 13.3% for AGIs $25k-50k, 16.7% for AGIs $50k-75k, 18.7% for AGIs $75k-100k, 17.5% for AGIs over 100k)
Charity contributions deductions: $2,331 (4% of AGI, reported on 32.2% of returns)
Here:
$2,331
State:
$3,087
Here:
4.0% of AGI
State:
3.4% of AGI
(% of AGI for various income ranges: 1.9% for AGIs $10k-25k, 1.2% for AGIs $25k-50k, 2.7% for AGIs $50k-75k, 1.7% for AGIs $75k-100k, 2.8% for AGIs over 100k)
Total tax: $3,946 (reported on 80.3% of returns)
43013:
$3,946
State:
$6,781
(% of AGI for various income ranges: 4.6% for AGIs below $10k, 4.4% for AGIs $10k-25k, 7.2% for AGIs $25k-50k, 7.7% for AGIs $50k-75k, 9.3% for AGIs $75k-100k, 12.8% for AGIs over 100k)
Earned income credit: $1,471 (reported on 9.6% of returns)
Here:
$1,471
State:
$1,696
Percentage of individuals using paid preparers for their 2004 taxes: 55.6%
Here:
56%
State:
55%
(% for various income ranges: 53.2% for AGIs below $10k, 57.5% for AGIs $10k-25k, 57.5% for AGIs $25k-50k, 54.9% for AGIs $50k-75k, 76.7% for AGIs $75k-100k)
Likely homosexual households (counted as self-reported same-sex unmarried-partner households)
Lesbian couples: 0.0% of all households
Gay men: 2.7% of all households
Household received Food Stamps/SNAP in the past 12 months: 18 Household did not receive Food Stamps/SNAP in the past 12 months: 458
Women who had a birth in the past 12 months: 10 (0 now married, 10 unmarried) Women who did not have a birth in the past 12 months: 309 (199 now married, 110 unmarried)
Housing units in zip code 43013 with a mortgage: 338 (26 second mortgage, 26 both second mortgage and home equity loan) Houses without a mortgage: 39
Median monthly owner costs for units with a mortgage: $2,764 Median monthly owner costs for units without a mortgage: $729
Residents with income below the poverty level in 2022:
This zip code:
7.3%
Whole state:
13.4%
Residents with income below 50% of the poverty level in 2022:
This zip code:
6.7%
Whole state:
7.0%
Median number of rooms in houses and condos:
Here:
10.0
State:
6.7
Median number of rooms in apartments:
Here:
5.7
State:
4.4
Notable locations in this zip code not listed on our city pages
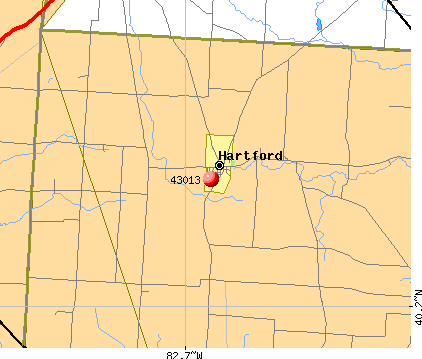
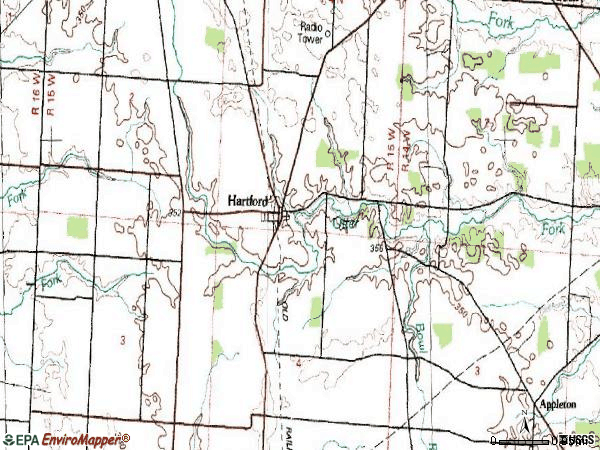
Notable locations in zip code 43013: Cramer Dairy Farm (A), Buttercrest Jersey Farm (B), Hartford Volunteer Fire Department (C). Display/hide their locations on the map
Size of family households: 100 2-persons, 94 3-persons, 167 4-persons, 18 5-persons, 7 6-persons
Size of nonfamily households: 78 1-person, 4 2-persons
324 married couples with children.
53 single-parent households (3 men, 50 women).
99.9% of residents of 43013 zip code speak English at home.
Foreign born population: 0 (0.0%)
:
0.0%
Whole state:
5.0%
64%German
13%American
10%English
7%Irish
3%Hungarian
1%Scottish
0%European
Year of entry for the foreign-born population
02010 or later
02000 to 2009
21990 to 1999
0Before 1990
Facilities with environmental interests located in this zip code:
AGRIGENERAL CO LP PULLET SITE 4 (10127 BENNER ROAD in CROTON, OH)
CRITERIA AND HAZARDOUS AIR POLLUTANT INVENTORY (Inventory of air pollution sources) STATE MASTER (Ohio general info) - AIR MAJOR, -45-8215-823-8, EPCRA, PCS-OH0131199, National Pollutant Discharge Elimination System Permit STATE MASTER (Ohio general info) - PCS-OH0096814, National Pollutant Discharge Elimination System Permit TRI REPORTER (Tracking of toxic chemicals releasing facilities) Business SIC classification: CHICKEN EGGS; POULTRY AND EGGS; FOOD PREPARATIONS Organizations: OHIO FRESH EGGS LLC (CONTACT/OWNER)
, AGRIGENERAL CO L P (CONTACT/OWNER)
Alternative names: AGRI GENERAL CO LP, AGRIGENERAL COMPANY LP, BUCKEYE EGG FARM, BUCKEYE EGG FARM - CROTON PULLET 4, BUCKEYE EGG FARM L.P., BUCKEYE EGG FARM L.P. PULLET 4, OHIO FRESH EGGS, OHIO FRESH EGGS-PULLET SITE 4
Housing units lacking complete plumbing facilities: 0.5% Housing units lacking complete kitchen facilities: 8.1%
55.6%Electricity
22.9%Utility gas
12.4%Bottled, tank, or LP gas
5.8%Fuel oil, kerosene, etc.
3.9%Wood
Population in 1990: 1,197.
Place of birth for U.S.-born residents:
This state: 1,156
Northeast: 17
Midwest: 180
South: 31
West: 10
67% of the 43013 zip code residents lived in the same house 5 years ago. Out of people who lived in different houses, 40% lived in this county. Out of people who lived in different counties, 50% lived in Ohio.
90% of the 43013 zip code residents lived in the same house 1 year ago. Out of people who lived in different houses, 18% moved from this county. Out of people who lived in different houses, 69% moved from different county within same state. Out of people who lived in different houses, 18% moved from different state.
Private vs. public school enrollment:
Students in private schools in grades 1 to 8 (elementary and middle school): 11
Here:
3.9%
Ohio:
16.0%
Students in private schools in grades 9 to 12 (high school): 2
Here:
7.3%
Ohio:
13.1%
Students in private undergraduate colleges: 1
Here:
19.5%
Ohio:
22.3%
Occupation by median earnings in the past 12 months ($)
134,185Installation, maintenance, and repair occupations
70,155Business and financial operations occupations
61,554Office and administrative support occupations
59,845Management occupations
57,801Transportation occupations
44,956Health technologists and technicians
Top industries in this zip code by the number of employees in 2005:
Construction: Other Heavy and Civil Engineering Construction (20-49 employees: 1 establishment)
Construction: Framing Contractors (5-9: 1)
Construction: Painting and Wall Covering Contractors (1-4: 2)
Arts, Entertainment, and Recreation: Golf Courses and Country Clubs (1-4: 1)
Construction: Plumbing, Heating, and Air-Conditioning Contractors (1-4: 1)
Home Mortgage Disclosure Act Aggregated Statistics For Year 2009 (Based on 2 partial tracts)
A) FHA, FSA/RHS & VA Home Purchase Loans
B) Conventional Home Purchase Loans
C) Refinancings
D) Home Improvement Loans
F) Non-occupant Loans on < 5 Family Dwellings (A B C & D)
G) Loans On Manufactured Home Dwelling (A B C & D)
Number
Average Value
Number
Average Value
Number
Average Value
Number
Average Value
Number
Average Value
Number
Average Value
LOANS ORIGINATED
9
$160,004
8
$209,921
73
$164,380
4
$33,870
1
$106,450
3
$76,427
APPLICATIONS APPROVED, NOT ACCEPTED
1
$69,230
2
$262,400
5
$162,280
0
$0
0
$0
0
$0
APPLICATIONS DENIED
3
$123,197
3
$203,840
25
$175,530
3
$81,387
1
$87,470
2
$96,215
APPLICATIONS WITHDRAWN
3
$134,487
2
$146,645
10
$227,563
1
$39,080
0
$0
0
$0
FILES CLOSED FOR INCOMPLETENESS
0
$0
0
$0
3
$170,343
0
$0
0
$0
0
$0
Aggregated Statistics For Year 2008 (Based on 2 partial tracts)
A) FHA, FSA/RHS & VA Home Purchase Loans
B) Conventional Home Purchase Loans
C) Refinancings
D) Home Improvement Loans
G) Loans On Manufactured Home Dwelling (A B C & D)
Number
Average Value
Number
Average Value
Number
Average Value
Number
Average Value
Number
Average Value
LOANS ORIGINATED
7
$158,610
7
$169,139
42
$175,368
4
$38,988
2
$85,605
APPLICATIONS APPROVED, NOT ACCEPTED
1
$164,880
2
$177,725
4
$85,792
1
$95,280
1
$66,250
APPLICATIONS DENIED
3
$120,963
4
$106,355
27
$195,253
3
$67,617
3
$79,153
APPLICATIONS WITHDRAWN
1
$205,830
0
$0
11
$199,263
1
$73,700
0
$0
FILES CLOSED FOR INCOMPLETENESS
1
$128,410
0
$0
3
$211,657
0
$0
0
$0
Aggregated Statistics For Year 2007 (Based on 2 partial tracts)
A) FHA, FSA/RHS & VA Home Purchase Loans
B) Conventional Home Purchase Loans
C) Refinancings
D) Home Improvement Loans
F) Non-occupant Loans on < 5 Family Dwellings (A B C & D)
G) Loans On Manufactured Home Dwelling (A B C & D)
Number
Average Value
Number
Average Value
Number
Average Value
Number
Average Value
Number
Average Value
Number
Average Value
LOANS ORIGINATED
3
$179,027
28
$151,392
47
$156,197
10
$67,629
2
$160,420
6
$83,868
APPLICATIONS APPROVED, NOT ACCEPTED
0
$0
2
$203,220
16
$168,630
3
$14,763
1
$93,420
1
$59,920
APPLICATIONS DENIED
3
$133,620
7
$187,749
47
$160,109
6
$49,750
1
$147,020
3
$80,023
APPLICATIONS WITHDRAWN
1
$80,020
3
$139,450
16
$175,376
1
$184,240
0
$0
1
$74,070
FILES CLOSED FOR INCOMPLETENESS
0
$0
1
$168,230
5
$235,454
0
$0
0
$0
0
$0
Aggregated Statistics For Year 2006 (Based on 2 partial tracts)
A) FHA, FSA/RHS & VA Home Purchase Loans
B) Conventional Home Purchase Loans
C) Refinancings
D) Home Improvement Loans
F) Non-occupant Loans on < 5 Family Dwellings (A B C & D)
G) Loans On Manufactured Home Dwelling (A B C & D)
Number
Average Value
Number
Average Value
Number
Average Value
Number
Average Value
Number
Average Value
Number
Average Value
LOANS ORIGINATED
3
$141,187
33
$144,673
60
$157,143
10
$53,150
5
$88,434
4
$102,262
APPLICATIONS APPROVED, NOT ACCEPTED
0
$0
3
$120,593
13
$130,270
2
$63,645
1
$80,400
0
$0
APPLICATIONS DENIED
1
$151,490
14
$121,151
54
$143,145
9
$81,388
2
$92,120
5
$88,434
APPLICATIONS WITHDRAWN
1
$125,800
8
$126,920
29
$155,990
3
$140,690
1
$195,030
2
$137,715
FILES CLOSED FOR INCOMPLETENESS
0
$0
1
$91,190
7
$193,171
1
$78,530
0
$0
0
$0
Aggregated Statistics For Year 2005 (Based on 2 partial tracts)
A) FHA, FSA/RHS & VA Home Purchase Loans
B) Conventional Home Purchase Loans
C) Refinancings
D) Home Improvement Loans
F) Non-occupant Loans on < 5 Family Dwellings (A B C & D)
G) Loans On Manufactured Home Dwelling (A B C & D)
Number
Average Value
Number
Average Value
Number
Average Value
Number
Average Value
Number
Average Value
Number
Average Value
LOANS ORIGINATED
2
$166,930
45
$171,981
74
$143,312
7
$36,210
5
$110,394
4
$121,058
APPLICATIONS APPROVED, NOT ACCEPTED
0
$0
6
$121,152
17
$132,854
2
$120,595
1
$43,550
1
$107,190
APPLICATIONS DENIED
1
$214,010
11
$132,977
62
$141,232
9
$47,683
1
$106,820
6
$75,928
APPLICATIONS WITHDRAWN
0
$0
8
$166,885
38
$150,721
5
$138,236
2
$148,695
3
$99,377
FILES CLOSED FOR INCOMPLETENESS
0
$0
3
$320,093
7
$127,824
0
$0
0
$0
0
$0
Aggregated Statistics For Year 2004 (Based on 2 partial tracts)
A) FHA, FSA/RHS & VA Home Purchase Loans
B) Conventional Home Purchase Loans
C) Refinancings
D) Home Improvement Loans
F) Non-occupant Loans on < 5 Family Dwellings (A B C & D)
G) Loans On Manufactured Home Dwelling (A B C & D)
Number
Average Value
Number
Average Value
Number
Average Value
Number
Average Value
Number
Average Value
Number
Average Value
LOANS ORIGINATED
4
$155,300
52
$164,090
83
$146,660
10
$63,572
3
$108,433
4
$113,985
APPLICATIONS APPROVED, NOT ACCEPTED
0
$0
4
$128,688
19
$121,239
2
$53,595
1
$106,450
1
$83,370
APPLICATIONS DENIED
1
$114,270
10
$106,226
54
$139,506
7
$61,307
1
$110,170
5
$80,396
APPLICATIONS WITHDRAWN
0
$0
2
$123,010
28
$138,791
1
$30,150
1
$38,340
1
$138,830
FILES CLOSED FOR INCOMPLETENESS
1
$77,420
1
$119,850
10
$172,440
0
$0
0
$0
0
$0
Aggregated Statistics For Year 2003 (Based on 2 partial tracts)
A) FHA, FSA/RHS & VA Home Purchase Loans
B) Conventional Home Purchase Loans
C) Refinancings
D) Home Improvement Loans
F) Non-occupant Loans on < 5 Family Dwellings (A B C & D)
Number
Average Value
Number
Average Value
Number
Average Value
Number
Average Value
Number
Average Value
LOANS ORIGINATED
2
$117,615
34
$153,521
168
$130,651
10
$35,582
3
$81,513
APPLICATIONS APPROVED, NOT ACCEPTED
0
$0
6
$128,223
24
$124,733
1
$21,960
0
$0
APPLICATIONS DENIED
0
$0
8
$134,225
47
$121,994
7
$23,076
1
$184,610
APPLICATIONS WITHDRAWN
0
$0
2
$142,740
31
$124,651
1
$16,750
1
$65,880
FILES CLOSED FOR INCOMPLETENESS
0
$0
1
$160,050
10
$133,136
0
$0
0
$0
Aggregated Statistics For Year 2002 (Based on 2 partial tracts)
A) FHA, FSA/RHS & VA Home Purchase Loans
B) Conventional Home Purchase Loans
C) Refinancings
D) Home Improvement Loans
F) Non-occupant Loans on < 5 Family Dwellings (A B C & D)
Number
Average Value
Number
Average Value
Number
Average Value
Number
Average Value
Number
Average Value
LOANS ORIGINATED
7
$143,616
38
$138,047
125
$125,515
7
$25,097
3
$122,577
APPLICATIONS APPROVED, NOT ACCEPTED
0
$0
4
$100,308
23
$113,521
4
$25,310
0
$0
APPLICATIONS DENIED
1
$236,720
7
$116,180
44
$114,443
7
$19,993
0
$0
APPLICATIONS WITHDRAWN
1
$211,040
4
$139,295
23
$130,124
0
$0
0
$0
FILES CLOSED FOR INCOMPLETENESS
0
$0
1
$128,780
8
$129,572
0
$0
0
$0
Aggregated Statistics For Year 2001 (Based on 2 partial tracts)
A) FHA, FSA/RHS & VA Home Purchase Loans
B) Conventional Home Purchase Loans
C) Refinancings
D) Home Improvement Loans
F) Non-occupant Loans on < 5 Family Dwellings (A B C & D)
Number
Average Value
Number
Average Value
Number
Average Value
Number
Average Value
Number
Average Value
LOANS ORIGINATED
6
$110,605
29
$124,404
109
$117,533
11
$26,358
3
$79,527
APPLICATIONS APPROVED, NOT ACCEPTED
1
$92,680
4
$122,268
22
$101,120
2
$27,355
1
$76,670
APPLICATIONS DENIED
0
$0
9
$84,159
41
$101,547
7
$18,983
3
$87,467
APPLICATIONS WITHDRAWN
0
$0
3
$126,423
20
$116,127
2
$30,335
0
$0
FILES CLOSED FOR INCOMPLETENESS
0
$0
0
$0
5
$116,276
0
$0
0
$0
Aggregated Statistics For Year 2000 (Based on 2 partial tracts)
A) FHA, FSA/RHS & VA Home Purchase Loans
B) Conventional Home Purchase Loans
C) Refinancings
D) Home Improvement Loans
F) Non-occupant Loans on < 5 Family Dwellings (A B C & D)
Number
Average Value
Number
Average Value
Number
Average Value
Number
Average Value
Number
Average Value
LOANS ORIGINATED
5
$120,742
34
$124,643
39
$91,456
10
$22,444
3
$115,010
APPLICATIONS APPROVED, NOT ACCEPTED
0
$0
4
$94,632
14
$93,024
4
$21,308
1
$54,710
APPLICATIONS DENIED
0
$0
9
$95,821
27
$81,167
6
$12,283
0
$0
APPLICATIONS WITHDRAWN
1
$69,230
3
$94,413
11
$76,470
2
$28,285
1
$81,140
FILES CLOSED FOR INCOMPLETENESS
0
$0
0
$0
3
$113,273
0
$0
1
$58,810
Aggregated Statistics For Year 1999 (Based on 1 partial tract)
A) FHA, FSA/RHS & VA Home Purchase Loans
B) Conventional Home Purchase Loans
C) Refinancings
D) Home Improvement Loans
F) Non-occupant Loans on < 5 Family Dwellings (A B C & D)
Detailed PMIC statistics for the following Tracts:7550.00
2002 - 2018 National Fire Incident Reporting System (NFIRS) incidents
Based on the data from the years 2002 - 2018 the average number of fire incidents per year is 19. The highest number of reported fire incidents - 36 took place in 2015, and the least - 6 in 2005. The data has a growing trend.
When looking into fire subcategories, the most reports belonged to: Structure Fires (61.6%), and Outside Fires (29.9%).
Fire incident types reported to NFIRS in Zip Code 43013


 Nearest zip codes: 43011, 43031, 43001, 43074, 43054, 43021.


 Based on the data from the years 2002 - 2018 the average number of fire incidents per year is 19. The highest number of reported fire incidents - 36 took place in 2015, and the least - 6 in 2005. The data has a growing trend.
 When looking into fire subcategories, the most reports belonged to: Structure Fires (61.6%), and Outside Fires (29.9%).