Estimated zip code population in 2022: 2,729 Zip code population in 2010: 3,104 Zip code population in 2000: 3,119
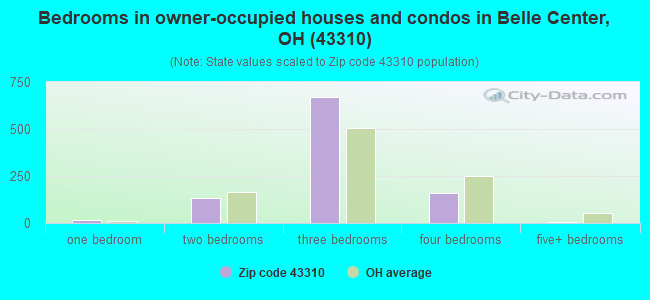
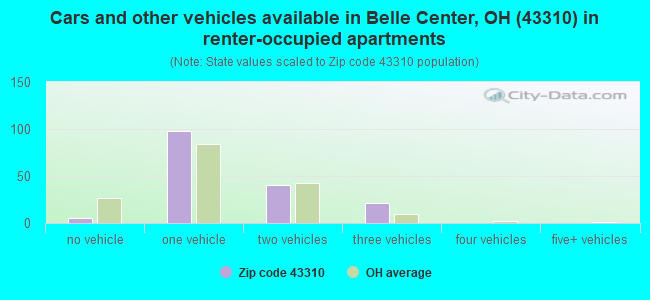
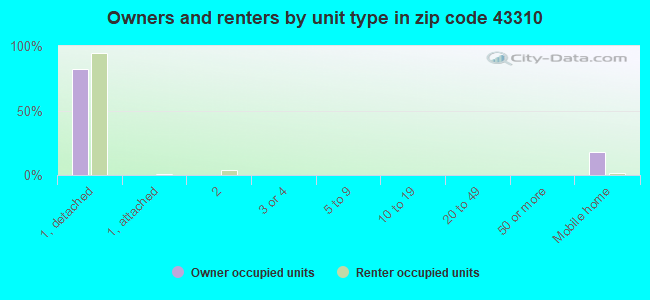
Houses and condos: 1,498 Renter-occupied apartments: 164
% of renters here:
14%
State:
33%
March 2022 cost of living index in zip code 43310: 83.4 (less than average, U.S. average is 100)
Land area: 64.1 sq. mi. Water area: 0.8 sq. mi.
Population density: 43 people per square mile
(very low).
OSM Map
General Map
Google Map
MSN Map
OSM Map
General Map
Google Map
MSN Map
OSM Map
General Map
Google Map
MSN Map
OSM Map
General Map
Google Map
MSN Map
Please wait while loading the map...
Real estate property taxes paid for housing units in 2022:
This zip code:
1.1% ($1,717)
Ohio:
1.3% ($2,639)
Median real estate property taxes paid for housing units with mortgages in 2022: $1,800 (1.1%) Median real estate property taxes paid for housing units with no mortgage in 2022: $1,390 (0.9%)
Business Search- 14 Million verified businesses
Males: 1,402
(51.4%)
Females: 1,326
(48.6%)
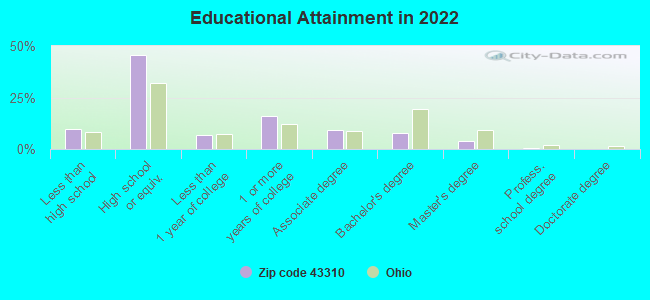
For population 25 years and over in 43310:
High school or higher: 88.4%
Bachelor's degree or higher: 12.3%
Graduate or professional degree: 4.7%
Unemployed: 1.6%
Mean travel time to work (commute): 29.7 minutes
For population 15 years and over in 43310:
Never married: 20.3%
Now married: 66.3%
Separated: 0.3%
Widowed: 3.1%
Divorced: 10.0%
Zip code 43310 compared to state average:
Unemployed percentage below state average.
Black race population percentage significantly below state average.
Hispanic race population percentage significantly below state average.
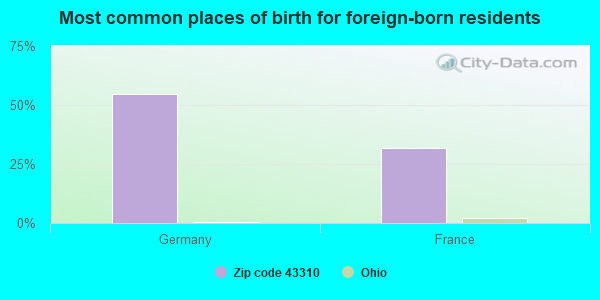
Foreign-born population percentage significantly below state average.
Renting percentage significantly below state average.
Length of stay since moving in significantly above state average.
Percentage of population with a bachelor's degree or higher significantly below state average.
Averages for the 2020 tax year for zip code 43310, filed in 2021:
Average Adjusted Gross Income (AGI) in 2020: $64,085 (Individual Income Tax Returns)
Here:
$64,085
State:
$67,288
Salary/wage: $50,411 (reported on 75.2% of returns)
Here:
$50,411
State:
$55,628
(% of AGI for various income ranges: 1067.9% for AGIs below $25k, 3532.5% for AGIs $25k-50k, 6147.6% for AGIs $50k-75k, 7985.8% for AGIs $75k-100k, 13817.7% for AGIs $100k-200k)
Taxable interest for individuals: $552 (reported on 32.3% of returns)
This zip code:
$552
Ohio:
$1,518
(% of AGI for various income ranges: 14.6% for AGIs below $25k, 13.1% for AGIs $25k-50k, 23.3% for AGIs $50k-75k, 20.8% for AGIs $75k-100k, 47.7% for AGIs $100k-200k)
Ordinary dividends: $3,500 (reported on 19.9% of returns)
Here:
$3,500
State:
$7,167
(% of AGI for various income ranges: 20.0% for AGIs below $25k, 32.5% for AGIs $25k-50k, 44.8% for AGIs $50k-75k, 88.3% for AGIs $75k-100k, 264.6% for AGIs $100k-200k)
Net capital gain/loss in AGI: +$11,527 (reported on 13.7% of returns)
Here:
+$11,527
State:
+$18,919
(% of AGI for various income ranges: 11.8% for AGIs below $25k, 47.5% for AGIs $25k-50k, 97.6% for AGIs $50k-75k, 120.8% for AGIs $75k-100k, 548.5% for AGIs $100k-200k)
Profit/loss from business: +$24,559 (reported on 13.7% of returns)
Here:
+$24,559
State:
+$13,744
(% of AGI for various income ranges: 149.3% for AGIs below $25k, 285.0% for AGIs $25k-50k, 286.7% for AGIs $50k-75k, 120.8% for AGIs $75k-100k, 2558.5% for AGIs $100k-200k)
Taxable individual retirement arrangement distribution: $22,645 (reported on 13.7% of returns)
43310:
$22,645
Ohio:
$18,876
(% of AGI for various income ranges: 64.6% for AGIs below $25k, 157.2% for AGIs $25k-50k, 411.0% for AGIs $50k-75k, 880.0% for AGIs $75k-100k, 1830.0% for AGIs $100k-200k)
Total itemized deductions: $28,140 (reported on 3.1% of returns)
Here:
$28,140
State:
$33,869
(% of AGI for various income ranges: 1082.3% for AGIs $100k-200k)
Charity contributions: $11,633 (reported on 1.9% of returns)
Here:
$11,633
State:
$14,577
(% of AGI for various income ranges: 268.5% for AGIs $100k-200k)
Taxes paid: $6,400 (reported on 2.5% of returns)
43310:
$6,400
State:
$7,681
(% of AGI for various income ranges: 196.9% for AGIs $100k-200k)
Earned income credit: $2,106 (reported on 10.6% of returns)
Here:
$2,106
State:
$2,304
(% of AGI for various income ranges: 71.4% for AGIs below $25k, 49.4% for AGIs $25k-50k)
Percentage of individuals using paid preparers for their 2020 taxes: 95.7%
Here:
96%
State:
94%
(% for various income ranges: 95.0% for AGIs below $25k, 95.5% for AGIs $25k-50k, 96.9% for AGIs $50k-75k, 94.4% for AGIs $75k-100k, 95.5% for AGIs $100k-200k, 100.0% for AGIs over 200k)
Averages for the 2012 tax year for zip code 43310, filed in 2013:
Average Adjusted Gross Income (AGI) in 2012: $47,725 (Individual Income Tax Returns)
Here:
$47,725
State:
$54,926
Salary/wage: $40,933 (reported on 77.8% of returns)
Here:
$40,933
State:
$45,869
(% of AGI for various income ranges: 60.7% for AGIs below $25k, 69.9% for AGIs $25k-50k, 73.4% for AGIs $50k-75k, 74.4% for AGIs $75k-100k, 57.2% for AGIs $100k-200k)
Taxable interest for individuals: $656 (reported on 31.6% of returns)
This zip code:
$656
Ohio:
$1,297
(% of AGI for various income ranges: 1.1% for AGIs below $25k, 0.5% for AGIs $25k-50k, 0.3% for AGIs $50k-75k, 0.2% for AGIs $75k-100k, 0.4% for AGIs $100k-200k)
Ordinary dividends: $1,678 (reported on 17.1% of returns)
Here:
$1,678
State:
$5,821
(% of AGI for various income ranges: 1.6% for AGIs below $25k, 0.4% for AGIs $25k-50k, 0.6% for AGIs $50k-75k, 0.2% for AGIs $75k-100k, 0.7% for AGIs $100k-200k)
Net capital gain/loss in AGI: +$2,561 (reported on 11.4% of returns)
Here:
+$2,561
State:
+$11,232
(% of AGI for various income ranges: 1.0% for AGIs below $25k, 0.5% for AGIs $25k-50k, 0.5% for AGIs $50k-75k, 0.3% for AGIs $75k-100k, 0.8% for AGIs $100k-200k)
Profit/loss from business: +$15,152 (reported on 14.6% of returns)
Here:
+$15,152
State:
+$12,773
(% of AGI for various income ranges: 9.0% for AGIs below $25k, 6.1% for AGIs $25k-50k, 3.9% for AGIs $50k-75k, 3.2% for AGIs $75k-100k, 3.5% for AGIs $100k-200k)
Taxable individual retirement arrangement distribution: $16,956 (reported on 10.1% of returns)
43310:
$16,956
Ohio:
$14,511
(% of AGI for various income ranges: 3.5% for AGIs below $25k, 2.5% for AGIs $25k-50k, 2.8% for AGIs $50k-75k, 4.0% for AGIs $75k-100k, 4.8% for AGIs $100k-200k)
Total itemized deductions: $18,022 (21% of AGI, reported on 22.8% of returns)
Here:
$18,022
State:
$21,278
Here:
21.0% of AGI
State:
18.8% of AGI
(% of AGI for various income ranges: 8.0% for AGIs below $25k, 5.1% for AGIs $25k-50k, 8.4% for AGIs $50k-75k, 8.3% for AGIs $75k-100k, 11.6% for AGIs $100k-200k)
Charity contributions: $4,131 (reported on 16.5% of returns)
Here:
$4,131
State:
$3,943
(% of AGI for various income ranges: 0.9% for AGIs $25k-50k, 0.9% for AGIs $50k-75k, 1.1% for AGIs $75k-100k, 2.8% for AGIs $100k-200k)
Taxes paid: $5,981 (reported on 22.8% of returns)
43310:
$5,981
State:
$9,568
(% of AGI for various income ranges: 1.1% for AGIs below $25k, 1.2% for AGIs $25k-50k, 2.5% for AGIs $50k-75k, 2.9% for AGIs $75k-100k, 4.8% for AGIs $100k-200k)
Earned income credit: $2,167 (reported on 11.4% of returns)
Here:
$2,167
State:
$2,285
(% of AGI for various income ranges: 3.8% for AGIs below $25k, 0.8% for AGIs $25k-50k)
Percentage of individuals using paid preparers for their 2012 taxes: 62.0%
Here:
62%
State:
51%
(% for various income ranges: 51.8% for AGIs below $25k, 66.7% for AGIs $25k-50k, 64.3% for AGIs $50k-75k, 71.4% for AGIs $75k-100k, 73.3% for AGIs $100k-200k)
Averages for the 2004 tax year for zip code 43310, filed in 2005:
Average Adjusted Gross Income (AGI) in 2004: $42,049 (Individual Income Tax Returns)
Here:
$42,049
State:
$44,480
Salary/wage: $37,862 (reported on 84.3% of returns)
Here:
$37,862
State:
$39,198
(% of AGI for various income ranges: 88.9% for AGIs below $10k, 65.2% for AGIs $10k-25k, 79.1% for AGIs $25k-50k, 83.5% for AGIs $50k-75k, 87.6% for AGIs $75k-100k, 49.5% for AGIs over 100k)
Taxable interest for individuals: $839 (reported on 45.3% of returns)
This zip code:
$839
Ohio:
$1,532
(% of AGI for various income ranges: 3.1% for AGIs below $10k, 2.3% for AGIs $10k-25k, 1.2% for AGIs $25k-50k, 0.6% for AGIs $50k-75k, 0.3% for AGIs $75k-100k, 0.7% for AGIs over 100k)
Taxable dividends: $839 (reported on 18.8% of returns)
Here:
$839
State:
$3,496
(% of AGI for various income ranges: 2.0% for AGIs below $10k, 0.5% for AGIs $10k-25k, 0.7% for AGIs $25k-50k, 0.3% for AGIs $50k-75k, 0.1% for AGIs $75k-100k, 0.1% for AGIs over 100k)
Net capital gain/loss: +$2,593 (reported on 13.0% of returns)
Here:
+$2,593
State:
+$8,582
(% of AGI for various income ranges: -2.0% for AGIs below $10k, -0.2% for AGIs $10k-25k, 1.1% for AGIs $25k-50k, 0.9% for AGIs $50k-75k, 0.4% for AGIs $75k-100k, 1.5% for AGIs over 100k)
Profit/loss from business: +$11,995 (reported on 14.0% of returns)
Here:
+$11,995
State:
+$10,813
(% of AGI for various income ranges: -6.4% for AGIs below $10k, 7.7% for AGIs $10k-25k, 5.0% for AGIs $25k-50k, 2.4% for AGIs $50k-75k, 1.7% for AGIs $75k-100k, 6.8% for AGIs over 100k)
IRA payment deduction: $3,179 (reported on 1.8% of returns)
43310:
$3,179
Ohio:
$2,794
Total itemized deductions: $14,329 (21% of AGI, reported on 28.5% of returns)
Here:
$14,329
State:
$17,503
Here:
20.7% of AGI
State:
20.8% of AGI
(% of AGI for various income ranges: 6.5% for AGIs $10k-25k, 7.2% for AGIs $25k-50k, 9.1% for AGIs $50k-75k, 12.7% for AGIs $75k-100k, 14.2% for AGIs over 100k)
Charity contributions deductions: $2,592 (4% of AGI, reported on 20.3% of returns)
Here:
$2,592
State:
$3,087
Here:
3.5% of AGI
State:
3.4% of AGI
(% of AGI for various income ranges: 0.4% for AGIs $10k-25k, 0.7% for AGIs $25k-50k, 0.8% for AGIs $50k-75k, 1.3% for AGIs $75k-100k, 3.4% for AGIs over 100k)
Total tax: $5,287 (reported on 81.1% of returns)
43310:
$5,287
State:
$6,781
(% of AGI for various income ranges: 2.2% for AGIs below $10k, 4.4% for AGIs $10k-25k, 7.3% for AGIs $25k-50k, 9.6% for AGIs $50k-75k, 10.6% for AGIs $75k-100k, 19.4% for AGIs over 100k)
Earned income credit: $1,489 (reported on 8.9% of returns)
Here:
$1,489
State:
$1,696
Percentage of individuals using paid preparers for their 2004 taxes: 60.7%
Here:
61%
State:
55%
(% for various income ranges: 47.1% for AGIs below $10k, 66.0% for AGIs $10k-25k, 61.5% for AGIs $25k-50k, 61.6% for AGIs $50k-75k, 68.1% for AGIs $75k-100k, 59.7% for AGIs over 100k)
Household received Food Stamps/SNAP in the past 12 months: 115 Household did not receive Food Stamps/SNAP in the past 12 months: 1,035
Women who had a birth in the past 12 months: 70 (50 now married, 19 unmarried) Women who did not have a birth in the past 12 months: 524 (301 now married, 222 unmarried)
Housing units in zip code 43310 with a mortgage: 578 (64 second mortgage, 5 home equity loan, 31 both second mortgage and home equity loan) Median monthly owner costs for units with a mortgage: $1,160 Median monthly owner costs for units without a mortgage: $555
Residents with income below the poverty level in 2022:
This zip code:
9.0%
Whole state:
13.4%
Residents with income below 50% of the poverty level in 2022:
This zip code:
4.3%
Whole state:
7.0%
Median number of rooms in houses and condos:
Here:
6.6
State:
6.7
Median number of rooms in apartments:
Here:
6.3
State:
4.4
Notable locations in this zip code not listed on our city pages
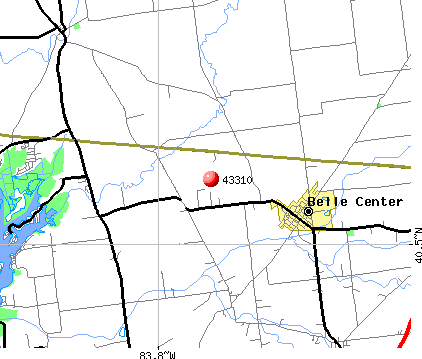
Notable locations in zip code 43310: Long Island Golf Course (A), Diamond D Ranch (B), Upper Scioto Valley Ambulance District Roundhead Station (C), Belle Center - McDonald - Richland - Taylor Creek Townships Ambulance District (D), Roundhead Volunteer Fire Department (E), Richland Township Fire Department (F). Display/hide their locations on the map
Churches in zip code 43310 include: Pleasant Hill Methodist Church (A), Belle Center Church of Christ (B), Belle Center United Methodist Church (C), New Richland Baptist Church (D), Reform Presbyterian Church (E). Display/hide their locations on the map
Cemeteries: Fairview Cemetery (1), Fry Cemetery (2), Hinkle Cemetery (3), Old Roundhead Cemetery (4), New Roundhead Cemetery (5), Pleasant Hill Cemetery (6), Johnston Cemetery (7). Display/hide their locations on the map
324 married couples with children.
94 single-parent households (86 men, 8 women).
99.0% of residents of 43310 zip code speak English at home.
0.1% of residents speak Spanish at home (100% very well).
0.9% of residents speak other Indo-European language at home (100% very well).
Foreign born population: 22 (0.8%) (68.6% of them are naturalized citizens)
This zip code:
0.8%
Whole state:
5.0%
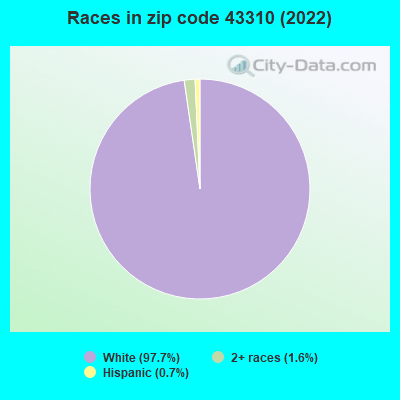
55%Germany
32%France
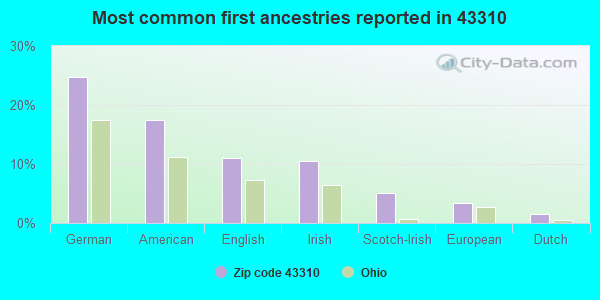
25%German
18%American
11%English
10%Irish
5%Scotch-Irish
3%European
1%Dutch
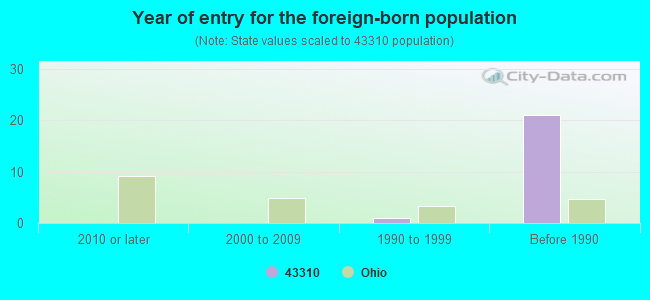
Year of entry for the foreign-born population
02010 or later
02000 to 2009
11990 to 1999
21Before 1990
Facilities with environmental interests located in this zip code:
BELLE CENTER GRAIN (BOX 96 in BELLE CENTER, OH)
AIR MINOR (AIRS/AFS) Business SIC classification: GRAIN AND FIELD BEANS
Housing units lacking complete plumbing facilities: 3.3% Housing units lacking complete kitchen facilities: 6.9%
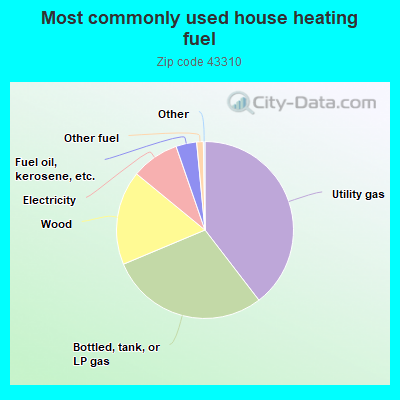
39.7%Utility gas
29.2%Bottled, tank, or LP gas
17.3%Wood
8.8%Electricity
3.8%Fuel oil, kerosene, etc.
1.2%Other fuel
Population in 1990: 2,057. Population change in the 1990s: +1,062 (+51.6%).
Place of birth for U.S.-born residents:
This state: 2,408
Northeast: 50
Midwest: 46
South: 178
West: 14
68% of the 43310 zip code residents lived in the same house 5 years ago. Out of people who lived in different houses, 52% lived in this county. Out of people who lived in different counties, 50% lived in Ohio.
92% of the 43310 zip code residents lived in the same house 1 year ago. Out of people who lived in different houses, 61% moved from this county. Out of people who lived in different houses, 28% moved from different county within same state. Out of people who lived in different houses, 8% moved from different state. Out of people who lived in different houses, 2% moved from abroad.
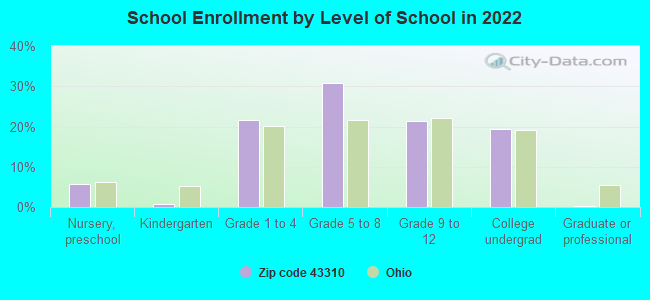
Private vs. public school enrollment:
Students in private schools in grades 1 to 8 (elementary and middle school): 2
Here:
1.1%
Ohio:
16.0%
Students in private schools in grades 9 to 12 (high school):
Here:
0.0%
Ohio:
13.1%
Students in private undergraduate colleges: 14
Here:
13.7%
Ohio:
22.3%
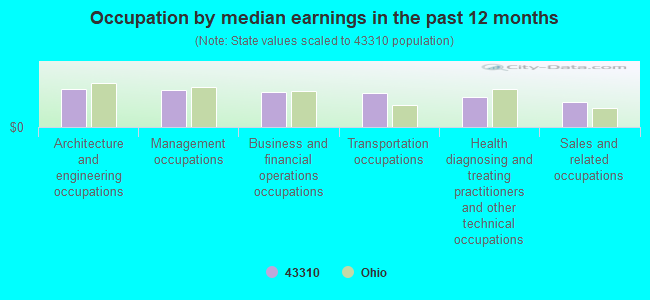
Occupation by median earnings in the past 12 months ($)
91,546Architecture and engineering occupations
89,151Management occupations
85,498Business and financial operations occupations
83,597Transportation occupations
73,982Health diagnosing and treating practitioners and other technical occupations
60,698Sales and related occupations
Top industries in this zip code by the number of employees in 2005:
Construction: Highway, Street, and Bridge Construction (250-499 employees: 1 establishment, 1-4 employees: 1 establishment)
Accommodation and Food Services: Snack and Nonalcoholic Beverage Bars (10-19: 1)
Construction: Plumbing, Heating, and Air-Conditioning Contractors (10-19: 1)
Administrative and Support and Waste Management and Remediation Services: Landscaping Services (5-9: 1, 1-4: 1)
Construction: Other Foundation, Structure, and Building Exterior Contractors (5-9: 1)
People in group quarters in 2010:
9 people in group homes intended for adults
People in group quarters in 2000:
8 people in homes for the mentally retarded
Fatal accident statistics in 2014:
Fatal accident count: 2
Vehicles involved in fatal accidents: 4
Fatal accidents caused by drunken drivers: 0
Fatalities: 2
Persons involved in fatal accidents: 4
Pedestrians involved in fatal accidents: 0
Fatal accident statistics in 2011:
Fatal accident count: 2
Vehicles involved in fatal accidents: 3
Fatal accidents caused by drunken drivers: 0
Fatalities: 2
Persons involved in fatal accidents: 7
Pedestrians involved in fatal accidents: 0
2002 - 2018 National Fire Incident Reporting System (NFIRS) incidents
Based on the data from the years 2002 - 2018 the average number of fire incidents per year is 22. The highest number of reported fire incidents - 41 took place in 2009, and the least - 12 in 2002. The data has an increasing trend.
When looking into fire subcategories, the most incidents belonged to: Outside Fires (57.4%), and Structure Fires (34.8%).
Fire incident types reported to NFIRS in Zip Code 43310

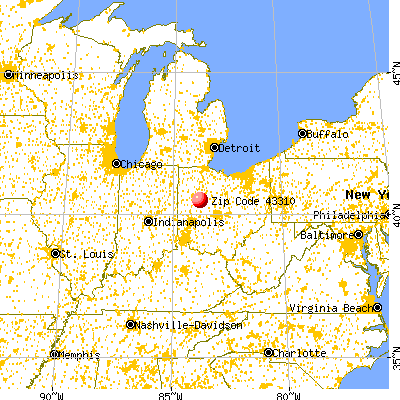


 Nearest zip codes: 43324, 43348, 43331, 43347, 45859, 45812.


 Based on the data from the years 2002 - 2018 the average number of fire incidents per year is 22. The highest number of reported fire incidents - 41 took place in 2009, and the least - 12 in 2002. The data has an increasing trend.
 When looking into fire subcategories, the most incidents belonged to: Outside Fires (57.4%), and Structure Fires (34.8%).