Estimated zip code population in 2022: 4,240 Zip code population in 2010: 4,485 Zip code population in 2000: 5,450
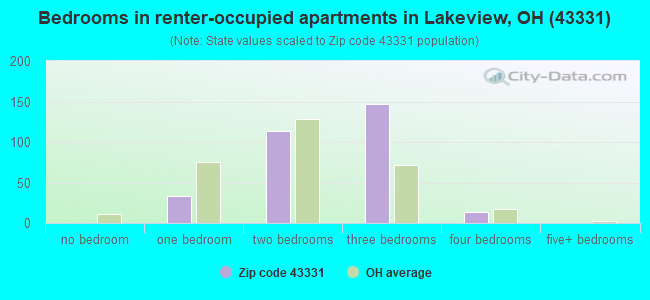
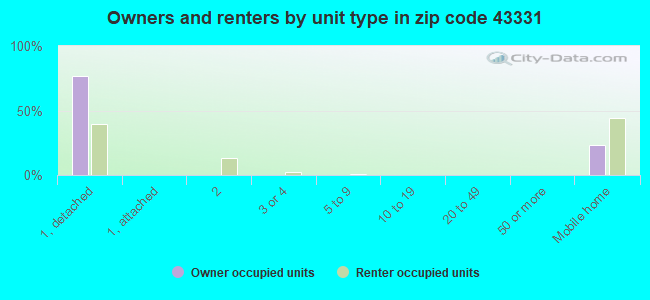
Houses and condos: 3,819 Renter-occupied apartments: 309
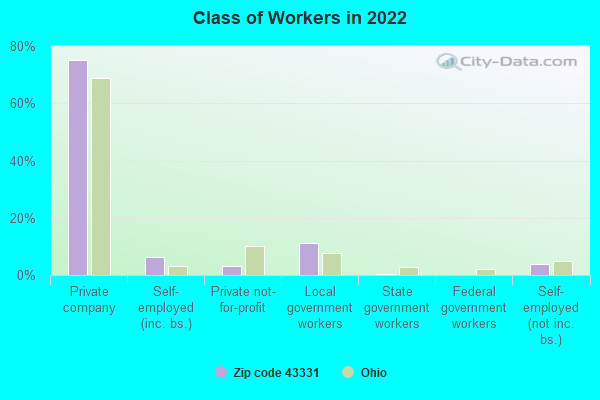
% of renters here:
15%
State:
33%
March 2022 cost of living index in zip code 43331: 78.2 (low, U.S. average is 100)
Land area: 31.1 sq. mi. Water area: 4.7 sq. mi.
Population density: 137 people per square mile
(very low).
OSM Map
General Map
Google Map
MSN Map
OSM Map
General Map
Google Map
MSN Map
OSM Map
General Map
Google Map
MSN Map
OSM Map
General Map
Google Map
MSN Map
Please wait while loading the map...
Real estate property taxes paid for housing units in 2022:
This zip code:
1.0% ($1,610)
Ohio:
1.3% ($2,639)
Median real estate property taxes paid for housing units with mortgages in 2022: $2,043 (1.0%) Median real estate property taxes paid for housing units with no mortgage in 2022: $988 (1.0%)
Averages for the 2020 tax year for zip code 43331, filed in 2021:
Average Adjusted Gross Income (AGI) in 2020: $51,927 (Individual Income Tax Returns)
Here:
$51,927
State:
$67,288
Salary/wage: $40,864 (reported on 79.0% of returns)
Here:
$40,864
State:
$55,628
(% of AGI for various income ranges: 998.3% for AGIs below $25k, 3371.1% for AGIs $25k-50k, 5611.1% for AGIs $50k-75k, 9280.8% for AGIs $75k-100k, 13730.8% for AGIs $100k-200k)
Taxable interest for individuals: $967 (reported on 23.3% of returns)
This zip code:
$967
Ohio:
$1,518
(% of AGI for various income ranges: 9.8% for AGIs below $25k, 10.4% for AGIs $25k-50k, 11.5% for AGIs $50k-75k, 35.0% for AGIs $75k-100k, 144.2% for AGIs $100k-200k)
Ordinary dividends: $3,506 (reported on 14.6% of returns)
Here:
$3,506
State:
$7,167
(% of AGI for various income ranges: 11.1% for AGIs below $25k, 23.7% for AGIs $25k-50k, 33.3% for AGIs $50k-75k, 70.8% for AGIs $75k-100k, 104.2% for AGIs $100k-200k)
Net capital gain/loss in AGI: +$12,452 (reported on 11.4% of returns)
Here:
+$12,452
State:
+$18,919
(% of AGI for various income ranges: 10.4% for AGIs below $25k, 26.3% for AGIs $25k-50k, 61.5% for AGIs $50k-75k, 240.8% for AGIs $75k-100k, 865.8% for AGIs $100k-200k)
Profit/loss from business: +$9,727 (reported on 11.9% of returns)
Here:
+$9,727
State:
+$13,744
(% of AGI for various income ranges: 72.6% for AGIs below $25k, 81.7% for AGIs $25k-50k, 191.1% for AGIs $50k-75k, 192.5% for AGIs $75k-100k, 796.7% for AGIs $100k-200k)
Taxable individual retirement arrangement distribution: $18,684 (reported on 11.4% of returns)
43331:
$18,684
Ohio:
$18,876
(% of AGI for various income ranges: 79.4% for AGIs below $25k, 159.8% for AGIs $25k-50k, 240.7% for AGIs $50k-75k, 679.2% for AGIs $75k-100k, 1601.7% for AGIs $100k-200k)
Total itemized deductions: $27,100 (reported on 2.7% of returns)
Here:
$27,100
State:
$33,869
(% of AGI for various income ranges: 73.3% for AGIs $25k-50k, 1025.0% for AGIs $100k-200k)
Charity contributions: $11,525 (reported on 1.8% of returns)
Here:
$11,525
State:
$14,577
(% of AGI for various income ranges: 384.2% for AGIs $100k-200k)
Taxes paid: $7,050 (reported on 2.7% of returns)
43331:
$7,050
State:
$7,681
(% of AGI for various income ranges: 22.8% for AGIs $25k-50k, 250.0% for AGIs $100k-200k)
Earned income credit: $2,120 (reported on 16.0% of returns)
Here:
$2,120
State:
$2,304
(% of AGI for various income ranges: 84.2% for AGIs below $25k, 54.8% for AGIs $25k-50k)
Percentage of individuals using paid preparers for their 2020 taxes: 96.8%
Here:
97%
State:
94%
(% for various income ranges: 94.3% for AGIs below $25k, 97.1% for AGIs $25k-50k, 97.2% for AGIs $50k-75k, 100.0% for AGIs $75k-100k, 100.0% for AGIs $100k-200k, 100.0% for AGIs over 200k)
Averages for the 2012 tax year for zip code 43331, filed in 2013:
Average Adjusted Gross Income (AGI) in 2012: $41,050 (Individual Income Tax Returns)
Here:
$41,050
State:
$54,926
Salary/wage: $33,109 (reported on 80.4% of returns)
Here:
$33,109
State:
$45,869
(% of AGI for various income ranges: 67.9% for AGIs below $25k, 75.9% for AGIs $25k-50k, 77.7% for AGIs $50k-75k, 71.1% for AGIs $75k-100k, 38.8% for AGIs $100k-200k)
Taxable interest for individuals: $922 (reported on 21.5% of returns)
This zip code:
$922
Ohio:
$1,297
(% of AGI for various income ranges: 0.6% for AGIs below $25k, 0.3% for AGIs $25k-50k, 0.3% for AGIs $50k-75k, 0.1% for AGIs $75k-100k, 1.0% for AGIs $100k-200k)
Ordinary dividends: $2,166 (reported on 13.6% of returns)
Here:
$2,166
State:
$5,821
(% of AGI for various income ranges: 0.5% for AGIs below $25k, 0.3% for AGIs $25k-50k, 0.2% for AGIs $50k-75k, 0.8% for AGIs $75k-100k, 1.5% for AGIs $100k-200k)
Net capital gain/loss in AGI: +$24,211 (reported on 8.9% of returns)
Here:
+$24,211
State:
+$11,232
(% of AGI for various income ranges: 0.4% for AGIs $25k-50k, 0.8% for AGIs $75k-100k, 19.2% for AGIs $100k-200k)
Profit/loss from business: +$5,908 (reported on 11.7% of returns)
Here:
+$5,908
State:
+$12,773
(% of AGI for various income ranges: 5.5% for AGIs below $25k, 1.4% for AGIs $25k-50k, 0.2% for AGIs $50k-75k, 2.0% for AGIs $100k-200k)
Taxable individual retirement arrangement distribution: $12,932 (reported on 8.9% of returns)
43331:
$12,932
Ohio:
$14,511
(% of AGI for various income ranges: 2.8% for AGIs below $25k, 2.4% for AGIs $25k-50k, 4.0% for AGIs $50k-75k, 6.8% for AGIs $75k-100k)
Total itemized deductions: $18,205 (19% of AGI, reported on 17.3% of returns)
Here:
$18,205
State:
$21,278
Here:
19.5% of AGI
State:
18.8% of AGI
(% of AGI for various income ranges: 4.6% for AGIs below $25k, 4.5% for AGIs $25k-50k, 8.0% for AGIs $50k-75k, 9.5% for AGIs $75k-100k, 11.0% for AGIs $100k-200k)
Charity contributions: $3,000 (reported on 11.2% of returns)
Here:
$3,000
State:
$3,943
(% of AGI for various income ranges: 0.4% for AGIs $25k-50k, 0.7% for AGIs $50k-75k, 1.3% for AGIs $75k-100k, 1.5% for AGIs $100k-200k)
Taxes paid: $7,141 (reported on 17.3% of returns)
43331:
$7,141
State:
$9,568
(% of AGI for various income ranges: 1.0% for AGIs below $25k, 1.2% for AGIs $25k-50k, 2.5% for AGIs $50k-75k, 2.8% for AGIs $75k-100k, 6.2% for AGIs $100k-200k)
Earned income credit: $2,093 (reported on 20.1% of returns)
Here:
$2,093
State:
$2,285
(% of AGI for various income ranges: 6.2% for AGIs below $25k, 0.7% for AGIs $25k-50k)
Percentage of individuals using paid preparers for their 2012 taxes: 53.3%
Here:
53%
State:
51%
(% for various income ranges: 47.4% for AGIs below $25k, 56.7% for AGIs $25k-50k, 58.1% for AGIs $50k-75k, 64.3% for AGIs $75k-100k, 58.3% for AGIs $100k-200k)
Averages for the 2004 tax year for zip code 43331, filed in 2005:
Average Adjusted Gross Income (AGI) in 2004: $31,584 (Individual Income Tax Returns)
Here:
$31,584
State:
$44,480
Salary/wage: $29,616 (reported on 84.9% of returns)
Here:
$29,616
State:
$39,198
(% of AGI for various income ranges: 111.7% for AGIs below $10k, 70.8% for AGIs $10k-25k, 82.7% for AGIs $25k-50k, 83.0% for AGIs $50k-75k, 85.7% for AGIs $75k-100k, 64.5% for AGIs over 100k)
Taxable interest for individuals: $766 (reported on 33.1% of returns)
This zip code:
$766
Ohio:
$1,532
(% of AGI for various income ranges: 3.5% for AGIs below $10k, 1.5% for AGIs $10k-25k, 0.5% for AGIs $25k-50k, 0.7% for AGIs $50k-75k, 0.2% for AGIs $75k-100k, 1.1% for AGIs over 100k)
Taxable dividends: $1,252 (reported on 14.4% of returns)
Here:
$1,252
State:
$3,496
(% of AGI for various income ranges: 2.4% for AGIs below $10k, 0.9% for AGIs $10k-25k, 0.5% for AGIs $25k-50k, 0.6% for AGIs $50k-75k, 0.1% for AGIs $75k-100k, 0.6% for AGIs over 100k)
Net capital gain/loss: +$2,259 (reported on 9.9% of returns)
Here:
+$2,259
State:
+$8,582
(% of AGI for various income ranges: -1.5% for AGIs below $10k, 0.1% for AGIs $10k-25k, 0.4% for AGIs $25k-50k, 0.4% for AGIs $50k-75k, 0.6% for AGIs $75k-100k, 3.5% for AGIs over 100k)
Profit/loss from business: +$5,827 (reported on 11.0% of returns)
Here:
+$5,827
State:
+$10,813
(% of AGI for various income ranges: -0.7% for AGIs below $10k, 3.6% for AGIs $10k-25k, 1.8% for AGIs $25k-50k, 0.3% for AGIs $50k-75k, 0.6% for AGIs $75k-100k, 5.6% for AGIs over 100k)
IRA payment deduction: $2,550 (reported on 0.9% of returns)
43331:
$2,550
Ohio:
$2,794
Total itemized deductions: $12,598 (21% of AGI, reported on 19.9% of returns)
Here:
$12,598
State:
$17,503
Here:
20.9% of AGI
State:
20.8% of AGI
(% of AGI for various income ranges: 8.4% for AGIs below $10k, 4.9% for AGIs $10k-25k, 6.3% for AGIs $25k-50k, 9.0% for AGIs $50k-75k, 11.5% for AGIs $75k-100k, 10.4% for AGIs over 100k)
Charity contributions deductions: $1,791 (3% of AGI, reported on 13.3% of returns)
Here:
$1,791
State:
$3,087
Here:
2.8% of AGI
State:
3.4% of AGI
(% of AGI for various income ranges: 0.3% for AGIs $10k-25k, 0.4% for AGIs $25k-50k, 0.9% for AGIs $50k-75k, 1.1% for AGIs $75k-100k, 1.6% for AGIs over 100k)
Total tax: $3,947 (reported on 73.6% of returns)
43331:
$3,947
State:
$6,781
(% of AGI for various income ranges: 2.3% for AGIs below $10k, 4.0% for AGIs $10k-25k, 7.8% for AGIs $25k-50k, 9.8% for AGIs $50k-75k, 11.5% for AGIs $75k-100k, 17.7% for AGIs over 100k)
Earned income credit: $1,697 (reported on 17.2% of returns)
Here:
$1,697
State:
$1,696
Percentage of individuals using paid preparers for their 2004 taxes: 56.3%
Here:
56%
State:
55%
(% for various income ranges: 47.1% for AGIs below $10k, 58.0% for AGIs $10k-25k, 58.8% for AGIs $25k-50k, 58.2% for AGIs $50k-75k, 54.6% for AGIs $75k-100k, 77.0% for AGIs over 100k)
Household received Food Stamps/SNAP in the past 12 months: 218 Household did not receive Food Stamps/SNAP in the past 12 months: 1,865
Women who had a birth in the past 12 months: 28 (6 now married, 21 unmarried) Women who did not have a birth in the past 12 months: 666 (364 now married, 301 unmarried)
Housing units in zip code 43331 with a mortgage: 892 (26 second mortgage, 26 both second mortgage and home equity loan) Median monthly owner costs for units with a mortgage: $1,214 Median monthly owner costs for units without a mortgage: $457
Residents with income below the poverty level in 2022:
This zip code:
10.5%
Whole state:
13.4%
Residents with income below 50% of the poverty level in 2022:
This zip code:
3.2%
Whole state:
7.0%
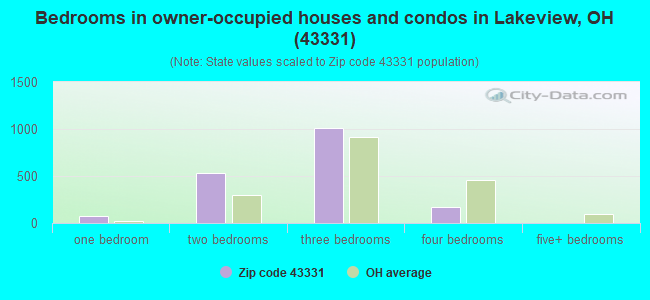
Median number of rooms in houses and condos:
Here:
5.4
State:
6.7
Median number of rooms in apartments:
Here:
5.0
State:
4.4
Notable locations in this zip code not listed on our city pages
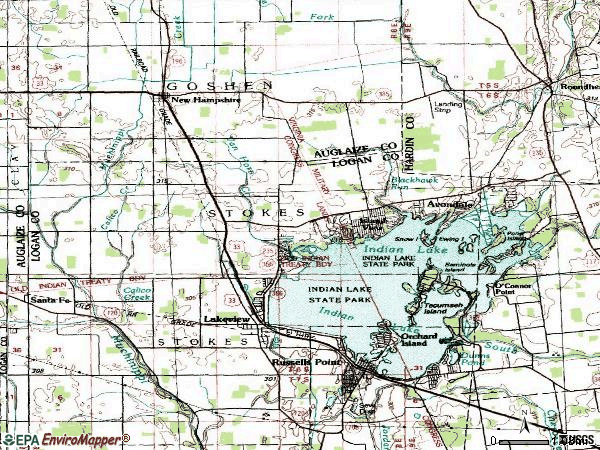
Streams, rivers, and creeks: Calico Creek (A), Blackhawk Run (B), Little Muchinippi Creek (C), Willow Creek (D), Van Horn Creek (E). Display/hide their locations on the map
In group quarters: 39 (-1 institutionalized population)
Size of family households: 885 2-persons, 273 3-persons, 124 4-persons, 92 5-persons, 13 6-persons
Size of nonfamily households: 598 1-person, 89 2-persons, 13 3-persons
265 married couples with children.
284 single-parent households (75 men, 209 women).
97.9% of residents of 43331 zip code speak English at home.
1.8% of residents speak Spanish at home (100% very well).
0.4% of residents speak other Indo-European language at home (100% very well).
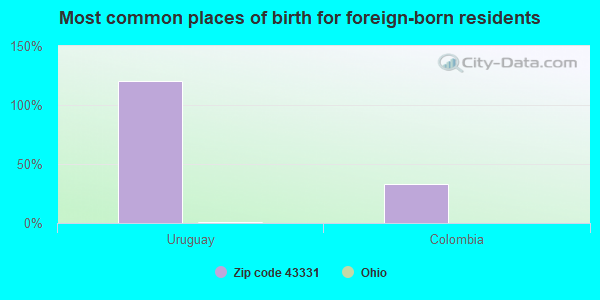
Foreign born population: 30 (0.7%) (100.0% of them are naturalized citizens)
This zip code:
0.7%
Whole state:
5.0%
120%Uruguay
33%Colombia
27%German
17%American
11%English
4%Irish
3%European
2%French
2%Greek
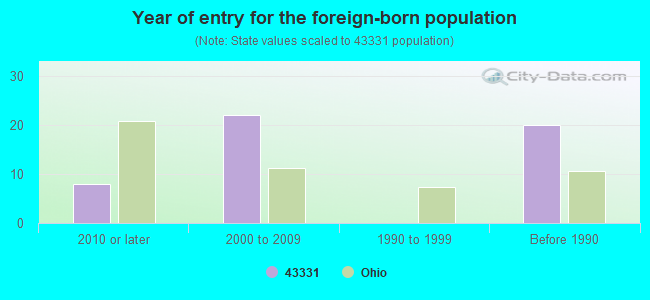
Year of entry for the foreign-born population
82010 or later
222000 to 2009
01990 to 1999
20Before 1990
Facilities with environmental interests located in this zip code:
BP OIL CO (13627 ST RTE 235 N in LAKEVIEW, OH)
(Resource Conservation and Recovery Act (tracking hazardous waste)) Organizations: BP OIL COMPANY (CONTACT/OWNER)
Housing units lacking complete plumbing facilities: 3.3% Housing units lacking complete kitchen facilities: 2.3%
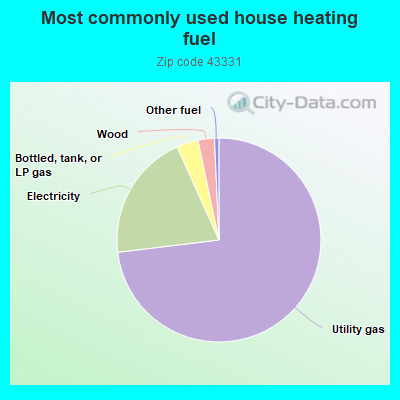
73.0%Utility gas
20.2%Electricity
3.4%Bottled, tank, or LP gas
2.6%Wood
0.7%Other fuel
Population in 1990: 5,722.
Place of birth for U.S.-born residents:
This state: 3,805
Northeast: 43
Midwest: 130
South: 159
West: 44
57% of the 43331 zip code residents lived in the same house 5 years ago. Out of people who lived in different houses, 48% lived in this county. Out of people who lived in different counties, 50% lived in Ohio.
91% of the 43331 zip code residents lived in the same house 1 year ago. Out of people who lived in different houses, 58% moved from this county. Out of people who lived in different houses, 20% moved from different county within same state. Out of people who lived in different houses, 21% moved from different state.
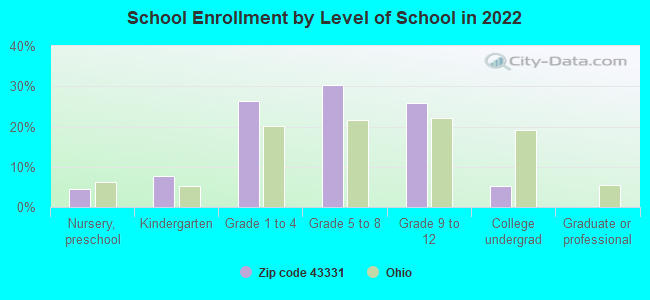
Private vs. public school enrollment:
Students in private schools in grades 1 to 8 (elementary and middle school): 21
Here:
6.8%
Ohio:
16.0%
Students in private schools in grades 9 to 12 (high school): 4
Here:
2.8%
Ohio:
13.1%
Students in private undergraduate colleges: 10
Here:
35.4%
Ohio:
22.3%
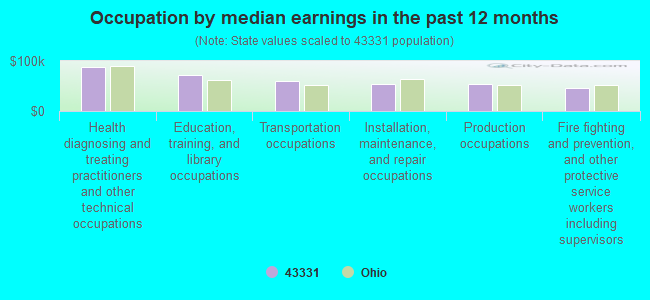
Occupation by median earnings in the past 12 months ($)
88,884Health diagnosing and treating practitioners and other technical occupations
71,163Education, training, and library occupations
59,218Transportation occupations
53,685Installation, maintenance, and repair occupations
53,316Production occupations
46,812Fire fighting and prevention, and other protective service workers including supervisors
Companies with federal contracts located in this zip code:
UNITED TOOL AND MACHINE, INC (490 N MAIN ST in LAKEVIEW, OH; small business) : $5,699,032 in 71 contractsfrom 1999 to 2006
Contracts for Vehicular Brake, Steering, Axle, Wheel, and Track Components, Vehicular Furniture and Accessories, Bushings, Rings, Shims, and Spacers, Miscellaneous Vehicular Components, and moreby Defense Logistics Agency Signed by year:2000: $1,355,922; 2001: $880,680; 2002: $952,093; 2003: $72,731; 2004: $1,467,098; 2005: $329,696; 2006: $449,082.
Biggest contracts:
$474,642 with Defense Logistics Agency for Vehicular Brake, Steering, Axle, Wheel, and Track Components. Signed on 2001-09-24. Completion date: 2001-09-24.
$402,620, same as above.Signed on 2004-02-07. Completion date: 2004-10-15.
$402,620, same as above.Signed on 2004-10-01. Completion date: 2005-09-30.
$334,789, same as above.Signed on 2006-05-26. Completion date: 2006-11-17.
Top industries in this zip code by the number of employees in 2005:
Health Care and Social Assistance: Nursing Care Facilities (50-99 employees: 1 establishment, 20-49 employees: 1 establishment)
Other Services (except Public Administration): Civic and Social Organizations (20-49: 1, 10-19: 1, 1-4: 1)
Finance and Insurance: Commercial Banking (20-49: 1, 1-4: 1)
Accommodation and Food Services: Full-Service Restaurants (5-9: 2, 1-4: 3)
Accommodation and Food Services: Limited-Service Restaurants (5-9: 2, 1-4: 1)
People in group quarters in 2010:
30 people in nursing facilities/skilled-nursing facilities
6 people in emergency and transitional shelters (with sleeping facilities) for people experiencing homelessness
People in group quarters in 2000:
71 people in nursing homes
Fatal accident statistics in 2014:
Fatal accident count: 1
Vehicles involved in fatal accidents: 1
Fatal accidents caused by drunken drivers: 1
Fatalities: 1
Persons involved in fatal accidents: 1
Pedestrians involved in fatal accidents: 0
Fatal accident statistics in 2012:
Fatal accident count: 1
Vehicles involved in fatal accidents: 1
Fatal accidents caused by drunken drivers: 1
Fatalities: 1
Persons involved in fatal accidents: 1
Pedestrians involved in fatal accidents: 0
Home Mortgage Disclosure Act Aggregated Statistics For Year 2003 (Based on 2 partial tracts)
A) FHA, FSA/RHS & VA Home Purchase Loans
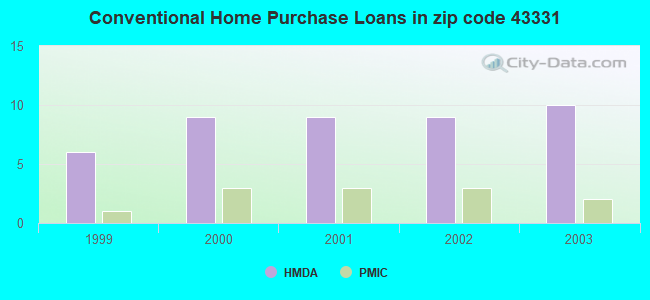
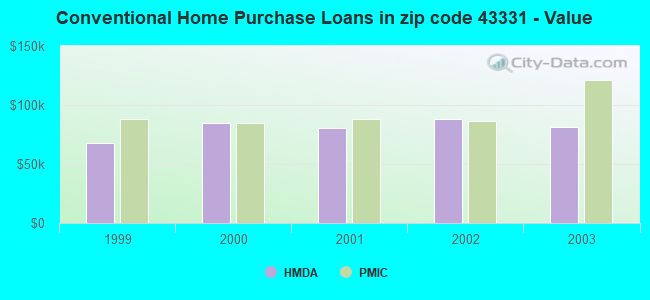
B) Conventional Home Purchase Loans
C) Refinancings
D) Home Improvement Loans
F) Non-occupant Loans on < 5 Family Dwellings (A B C & D)
Number
Average Value
Number
Average Value
Number
Average Value
Number
Average Value
Number
Average Value
LOANS ORIGINATED
0
$0
10
$81,220
46
$95,432
2
$11,015
3
$53,427
APPLICATIONS APPROVED, NOT ACCEPTED
0
$0
2
$72,050
4
$91,492
0
$0
0
$0
APPLICATIONS DENIED
1
$51,250
5
$59,212
14
$85,520
2
$17,310
0
$0
APPLICATIONS WITHDRAWN
0
$0
1
$78,460
7
$102,123
0
$0
0
$0
FILES CLOSED FOR INCOMPLETENESS
0
$0
0
$0
1
$113,750
0
$0
0
$0
Aggregated Statistics For Year 2002 (Based on 2 partial tracts)
A) FHA, FSA/RHS & VA Home Purchase Loans
B) Conventional Home Purchase Loans
C) Refinancings
D) Home Improvement Loans
F) Non-occupant Loans on < 5 Family Dwellings (A B C & D)
Number
Average Value
Number
Average Value
Number
Average Value
Number
Average Value
Number
Average Value
LOANS ORIGINATED
1
$116,220
9
$88,247
45
$87,682
2
$22,930
2
$127,010
APPLICATIONS APPROVED, NOT ACCEPTED
0
$0
1
$69,690
7
$98,141
0
$0
0
$0
APPLICATIONS DENIED
0
$0
2
$59,235
19
$80,502
1
$8,770
0
$0
APPLICATIONS WITHDRAWN
0
$0
1
$84,750
12
$86,586
0
$0
0
$0
FILES CLOSED FOR INCOMPLETENESS
0
$0
0
$0
2
$117,010
0
$0
0
$0
Aggregated Statistics For Year 2001 (Based on 2 partial tracts)
A) FHA, FSA/RHS & VA Home Purchase Loans
B) Conventional Home Purchase Loans
C) Refinancings
D) Home Improvement Loans
F) Non-occupant Loans on < 5 Family Dwellings (A B C & D)
Number
Average Value
Number
Average Value
Number
Average Value
Number
Average Value
Number
Average Value
LOANS ORIGINATED
1
$65,640
9
$80,203
30
$82,532
3
$33,420
3
$43,987
APPLICATIONS APPROVED, NOT ACCEPTED
0
$0
1
$44,060
5
$73,914
0
$0
0
$0
APPLICATIONS DENIED
0
$0
3
$76,357
16
$76,193
2
$22,815
1
$49,460
APPLICATIONS WITHDRAWN
0
$0
0
$0
8
$94,388
1
$7,190
0
$0
FILES CLOSED FOR INCOMPLETENESS
0
$0
0
$0
1
$103,860
0
$0
0
$0
Aggregated Statistics For Year 2000 (Based on 2 partial tracts)
A) FHA, FSA/RHS & VA Home Purchase Loans
B) Conventional Home Purchase Loans
C) Refinancings
D) Home Improvement Loans
F) Non-occupant Loans on < 5 Family Dwellings (A B C & D)
Number
Average Value
Number
Average Value
Number
Average Value
Number
Average Value
Number
Average Value
LOANS ORIGINATED
1
$106,110
9
$84,400
15
$60,831
3
$19,633
2
$37,765
APPLICATIONS APPROVED, NOT ACCEPTED
0
$0
1
$50,800
3
$73,733
1
$13,260
0
$0
APPLICATIONS DENIED
1
$53,500
4
$44,342
10
$69,463
4
$15,175
0
$0
APPLICATIONS WITHDRAWN
0
$0
1
$105,210
4
$85,255
0
$0
0
$0
FILES CLOSED FOR INCOMPLETENESS
0
$0
0
$0
1
$51,700
0
$0
0
$0
Aggregated Statistics For Year 1999 (Based on 1 partial tract)
A) FHA, FSA/RHS & VA Home Purchase Loans
B) Conventional Home Purchase Loans
C) Refinancings
D) Home Improvement Loans
F) Non-occupant Loans on < 5 Family Dwellings (A B C & D)
Detailed PMIC statistics for the following Tracts:0401.00
2002 - 2018 National Fire Incident Reporting System (NFIRS) incidents
According to the data from the years 2002 - 2018 the average number of fire incidents per year is 27. The highest number of fire incidents - 44 took place in 2009, and the least - 8 in 2002. The data has a growing trend.
When looking into fire subcategories, the most reports belonged to: Structure Fires (65.1%), and Outside Fires (24.2%).
Fire incident types reported to NFIRS in Zip Code 43331

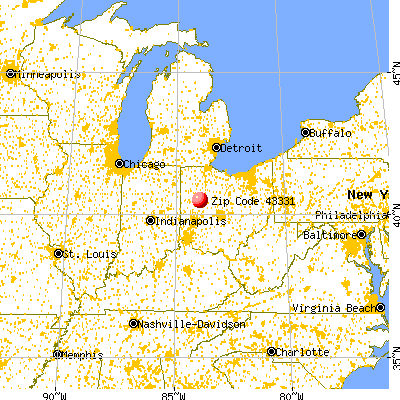


 Nearest zip codes: 45870, 43348, 43333, 45896, 43324, 43310.


 According to the data from the years 2002 - 2018 the average number of fire incidents per year is 27. The highest number of fire incidents - 44 took place in 2009, and the least - 8 in 2002. The data has a growing trend.
 When looking into fire subcategories, the most reports belonged to: Structure Fires (65.1%), and Outside Fires (24.2%).