Estimated zip code population in 2022: 849 Zip code population in 2010: 920 Zip code population in 2000: 980
Houses and condos: 333 Renter-occupied apartments: 16
% of renters here:
5%
State:
33%
March 2022 cost of living index in zip code 43345: 83.9 (less than average, U.S. average is 100)
Land area: 29.2 sq. mi. Water area: 0.0 sq. mi.
Population density: 29 people per square mile
(very low).
OSM Map
General Map
Google Map
MSN Map
OSM Map
General Map
Google Map
MSN Map
OSM Map
General Map
Google Map
MSN Map
OSM Map
General Map
Google Map
MSN Map
Please wait while loading the map...
Real estate property taxes paid for housing units in 2022:
This zip code:
1.0% ($1,890)
Ohio:
1.3% ($2,639)
Median real estate property taxes paid for housing units with mortgages in 2022: $2,044 (1.8%) Median real estate property taxes paid for housing units with no mortgage in 2022: $1,592 (1.1%)
Business Search- 14 Million verified businesses
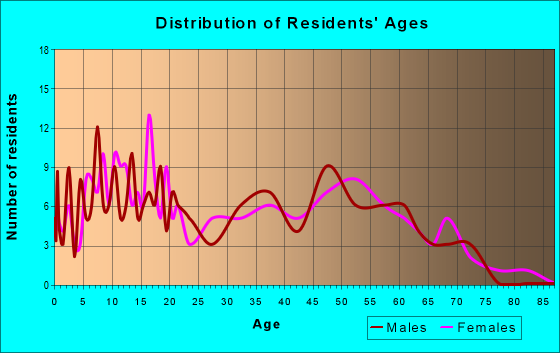
Males: 449
(52.9%)
Females: 400
(47.1%)
For population 25 years and over in 43345:
High school or higher: 97.6%
Bachelor's degree or higher: 23.0%
Graduate or professional degree: 8.1%
Unemployed: 0.8%
Mean travel time to work (commute): 21.1 minutes
For population 15 years and over in 43345:
Never married: 10.4%
Now married: 71.9%
Separated: 0.2%
Widowed: 4.8%
Divorced: 12.8%
Zip code 43345 compared to state average:
Unemployed percentage significantly below state average.
Black race population percentage significantly below state average.
Hispanic race population percentage significantly below state average.
Foreign-born population percentage significantly below state average.
Renting percentage significantly below state average.
Length of stay since moving in significantly above state average.
Number of rooms per house above state average.
Number of college students significantly below state average.
Percentage of population with a bachelor's degree or higher below state average.
Estimated median house/condo value in 2022: $191,406
43345:
$191,406
Ohio:
$204,100
According to our research of Ohio and other state lists, there was 1 registered sex offender living in 43345 zip code as of June 08, 2024. The ratio of all residents to sex offenders in zip code 43345 is 803 to 1. The ratio of registered sex offenders to all residents in this zip code is lower than the state average.
Median resident age:
This zip code:
38.4 years
Ohio median age:
39.9 years
Average household size:
This zip code:
2.7 people
Ohio:
2.4 people
Averages for the 2020 tax year for zip code 43345, filed in 2021:
Average Adjusted Gross Income (AGI) in 2020: $56,589 (Individual Income Tax Returns)
Here:
$56,589
State:
$67,288
Salary/wage: $48,603 (reported on 79.5% of returns)
Here:
$48,603
State:
$55,628
(% of AGI for various income ranges: 1138.6% for AGIs below $25k, 3991.1% for AGIs $25k-50k, 5381.4% for AGIs $50k-75k, 8520.0% for AGIs $75k-100k, 18156.7% for AGIs $100k-200k)
Taxable interest for individuals: $636 (reported on 25.0% of returns)
This zip code:
$636
Ohio:
$1,518
(% of AGI for various income ranges: 4.3% for AGIs below $25k, 16.7% for AGIs $25k-50k, 24.3% for AGIs $50k-75k, 116.7% for AGIs $100k-200k)
Ordinary dividends: $1,267 (reported on 13.6% of returns)
Here:
$1,267
State:
$7,167
(% of AGI for various income ranges: 11.4% for AGIs below $25k, 24.3% for AGIs $50k-75k, 170.0% for AGIs $100k-200k)
Net capital gain/loss in AGI: +$2,250 (reported on 9.1% of returns)
Here:
+$2,250
State:
+$18,919
(% of AGI for various income ranges: 128.6% for AGIs $50k-75k)
Profit/loss from business: +$7,300 (reported on 9.1% of returns)
Here:
+$7,300
State:
+$13,744
(% of AGI for various income ranges: 417.1% for AGIs $50k-75k)
Taxable individual retirement arrangement distribution: $13,500 (reported on 6.8% of returns)
43345:
$13,500
Ohio:
$18,876
(% of AGI for various income ranges: 450.0% for AGIs $25k-50k)
Earned income credit: $2,260 (reported on 11.4% of returns)
Here:
$2,260
State:
$2,304
(% of AGI for various income ranges: 161.4% for AGIs below $25k)
Percentage of individuals using paid preparers for their 2020 taxes: 93.2%
Here:
93%
State:
94%
(% for various income ranges: 90.9% for AGIs below $25k, 92.3% for AGIs $25k-50k, 88.9% for AGIs $50k-75k, 100.0% for AGIs $75k-100k, 100.0% for AGIs $100k-200k)
Averages for the 2012 tax year for zip code 43345, filed in 2013:
Average Adjusted Gross Income (AGI) in 2012: $53,520 (Individual Income Tax Returns)
Here:
$53,520
State:
$54,926
Salary/wage: $39,651 (reported on 87.5% of returns)
Here:
$39,651
State:
$45,869
(% of AGI for various income ranges: 70.0% for AGIs below $25k, 85.3% for AGIs $25k-50k, 83.1% for AGIs $50k-75k, 82.2% for AGIs $75k-100k, 34.5% for AGIs $100k-200k)
Taxable interest for individuals: $791 (reported on 27.5% of returns)
This zip code:
$791
Ohio:
$1,297
(% of AGI for various income ranges: 1.2% for AGIs below $25k, 0.2% for AGIs $25k-50k, 0.5% for AGIs $50k-75k, 0.5% for AGIs $100k-200k)
Ordinary dividends: $1,167 (reported on 15.0% of returns)
Here:
$1,167
State:
$5,821
(% of AGI for various income ranges: 0.3% for AGIs $25k-50k, 1.5% for AGIs $75k-100k)
Net capital gain/loss in AGI: +$2,233 (reported on 7.5% of returns)
Here:
+$2,233
State:
+$11,232
(% of AGI for various income ranges: 3.7% for AGIs below $25k)
Profit/loss from business: +$4,840 (reported on 12.5% of returns)
Here:
+$4,840
State:
+$12,773
(% of AGI for various income ranges: 6.3% for AGIs $25k-50k)
Total itemized deductions: $14,770 (17% of AGI, reported on 25.0% of returns)
Here:
$14,770
State:
$21,278
Here:
17.4% of AGI
State:
18.8% of AGI
(% of AGI for various income ranges: 8.5% for AGIs $25k-50k, 14.2% for AGIs $50k-75k, 7.0% for AGIs $100k-200k)
Charity contributions: $2,833 (reported on 15.0% of returns)
Here:
$2,833
State:
$3,943
(% of AGI for various income ranges: 2.3% for AGIs $25k-50k, 2.2% for AGIs $75k-100k)
Taxes paid: $5,860 (reported on 25.0% of returns)
43345:
$5,860
State:
$9,568
(% of AGI for various income ranges: 2.3% for AGIs $25k-50k, 5.5% for AGIs $50k-75k, 3.4% for AGIs $100k-200k)
Earned income credit: $1,714 (reported on 17.5% of returns)
Here:
$1,714
State:
$2,285
(% of AGI for various income ranges: 3.8% for AGIs below $25k, 1.3% for AGIs $25k-50k)
Percentage of individuals using paid preparers for their 2012 taxes: 75.0%
Here:
75%
State:
51%
(% for various income ranges: 71.4% for AGIs below $25k, 72.7% for AGIs $25k-50k, 85.7% for AGIs $50k-75k, 75.0% for AGIs $75k-100k, 75.0% for AGIs $100k-200k)
Averages for the 2004 tax year for zip code 43345, filed in 2005:
Average Adjusted Gross Income (AGI) in 2004: $37,109 (Individual Income Tax Returns)
Here:
$37,109
State:
$44,480
Salary/wage: $35,282 (reported on 89.3% of returns)
Here:
$35,282
State:
$39,198
(% of AGI for various income ranges: 98.7% for AGIs below $10k, 77.6% for AGIs $10k-25k, 87.1% for AGIs $25k-50k, 89.9% for AGIs $50k-75k, 88.1% for AGIs $75k-100k, 66.6% for AGIs over 100k)
Taxable interest for individuals: $367 (reported on 37.6% of returns)
This zip code:
$367
Ohio:
$1,532
(% of AGI for various income ranges: 3.0% for AGIs below $10k, 0.9% for AGIs $10k-25k, 0.3% for AGIs $25k-50k, 0.1% for AGIs $50k-75k, 0.0% for AGIs $75k-100k, 0.8% for AGIs over 100k)
Taxable dividends: $431 (reported on 13.2% of returns)
Here:
$431
State:
$3,496
(% of AGI for various income ranges: 0.7% for AGIs below $10k, 0.1% for AGIs $25k-50k, 0.2% for AGIs $50k-75k, 0.3% for AGIs over 100k)
Net capital gain/loss: +$265 (reported on 7.7% of returns)
Here:
+$265
State:
+$8,582
Profit/loss from business: +$1,904 (reported on 11.8% of returns)
Here:
+$1,904
State:
+$10,813
Total itemized deductions: $12,582 (20% of AGI, reported on 24.9% of returns)
Here:
$12,582
State:
$17,503
Here:
20.4% of AGI
State:
20.8% of AGI
(% of AGI for various income ranges: 7.9% for AGIs $25k-50k, 10.8% for AGIs $50k-75k, 11.4% for AGIs $75k-100k, 9.7% for AGIs over 100k)
Charity contributions deductions: $1,949 (3% of AGI, reported on 17.9% of returns)
Here:
$1,949
State:
$3,087
Here:
3.1% of AGI
State:
3.4% of AGI
Total tax: $4,011 (reported on 79.8% of returns)
43345:
$4,011
State:
$6,781
(% of AGI for various income ranges: 1.7% for AGIs below $10k, 4.1% for AGIs $10k-25k, 6.8% for AGIs $25k-50k, 9.3% for AGIs $50k-75k, 10.1% for AGIs $75k-100k, 15.7% for AGIs over 100k)
Earned income credit: $1,509 (reported on 12.5% of returns)
Here:
$1,509
State:
$1,696
Percentage of individuals using paid preparers for their 2004 taxes: 65.8%
Here:
66%
State:
55%
(% for various income ranges: 55.7% for AGIs below $10k, 66.0% for AGIs $10k-25k, 67.1% for AGIs $25k-50k, 73.8% for AGIs $50k-75k, 100.0% for AGIs $75k-100k)
Household received Food Stamps/SNAP in the past 12 months: 2 Household did not receive Food Stamps/SNAP in the past 12 months: 314
Women who had a birth in the past 12 months: 32 (20 now married, 12 unmarried) Women who did not have a birth in the past 12 months: 149 (117 now married, 31 unmarried)
Housing units in zip code 43345 with a mortgage: 228 (24 second mortgage, 24 both second mortgage and home equity loan) Houses without a mortgage: 1
Median monthly owner costs for units with a mortgage: $1,310 Median monthly owner costs for units without a mortgage: $435
Residents with income below the poverty level in 2022:
This zip code:
1.6%
Whole state:
13.4%
Residents with income below 50% of the poverty level in 2022:
This zip code:
1.6%
Whole state:
7.0%
Median number of rooms in houses and condos:
Here:
8.5
State:
6.7
Median number of rooms in apartments:
Here:
6.0
State:
4.4
Notable locations in this zip code not listed on our city pages
Size of family households: 93 2-persons, 23 3-persons, 78 4-persons, 18 5-persons, 9 6-persons, 19 7-or-more-persons
Size of nonfamily households: 68 1-person, 3 2-persons, 1 3-persons
188 married couples with children.
40 single-parent households (35 men, 5 women).
92.0% of residents of 43345 zip code speak English at home.
0.8% of residents speak Spanish at home (100% very well).
6.8% of residents speak other Indo-European language at home (98% very well, 2% well).
Foreign born population: 10 (1.2%) (0.0% of them are naturalized citizens)
:
1.2%
Whole state:
5.0%
70%Honduras
10%Bolivia
40%German
24%American
4%English
2%Italian
2%Irish
2%Norwegian
0%European
Year of entry for the foreign-born population
02010 or later
12000 to 2009
61990 to 1999
0Before 1990
Facilities with environmental interests located in this zip code:
BORDEN CHEMICAL SMITH-DOUGLASS DIV (PO BOX 32 WEST HALE ST in RIDGEWAY, OH)
(Resource Conservation and Recovery Act (tracking hazardous waste))
Housing units lacking complete plumbing facilities: 9.5% Housing units lacking complete kitchen facilities: 8.0%
40.6%Bottled, tank, or LP gas
27.1%Wood
20.6%Utility gas
8.1%Electricity
4.2%Other fuel
Population in 1990: 857. Population change in the 1990s: +123 (+14.4%).
Place of birth for U.S.-born residents:
This state: 784
Northeast: 6
Midwest: 34
South: 3
West: 10
68% of the 43345 zip code residents lived in the same house 5 years ago. Out of people who lived in different houses, 64% lived in this county. Out of people who lived in different counties, 50% lived in Ohio.
100% of the 43345 zip code residents lived in the same house 1 year ago.
Private vs. public school enrollment:
Students in private schools in grades 1 to 8 (elementary and middle school):
Here:
0.0%
Ohio:
16.0%
Students in private schools in grades 9 to 12 (high school): 3
Here:
8.3%
Ohio:
13.1%
Students in private undergraduate colleges: 2
Here:
59.3%
Ohio:
22.3%
Occupation by median earnings in the past 12 months ($)
90,891Business and financial operations occupations
70,642Installation, maintenance, and repair occupations
69,051Production occupations
43,492Office and administrative support occupations
40,425Material moving occupations
36,178Management occupations
Top industries in this zip code by the number of employees in 2005:
Wholesale Trade: Farm and Garden Machinery and Equipment Merchant Wholesalers (1-4 employees: 1 establishment)
Construction: Residential Remodelers (1-4: 1)
Other Services (except Public Administration): Religious Organizations (1-4: 1)
Fatal accident statistics in 2011:
Fatal accident count: 1
Vehicles involved in fatal accidents: 1
Fatal accidents caused by drunken drivers: 0
Fatalities: 1
Persons involved in fatal accidents: 1
Pedestrians involved in fatal accidents: 0
Fatal accident statistics in 2010:
Fatal accident count: 1
Vehicles involved in fatal accidents: 2
Fatal accidents caused by drunken drivers: 0
Fatalities: 1
Persons involved in fatal accidents: 6
Pedestrians involved in fatal accidents: 0
2002 - 2018 National Fire Incident Reporting System (NFIRS) incidents
Based on the data from the years 2002 - 2018 the average number of fires per year is 9. The highest number of reported fires - 20 took place in 2018, and the least - 2 in 2014. The data has a rising trend.
When looking into fire subcategories, the most reports belonged to: Structure Fires (50.6%), and Outside Fires (37.2%).
Fire incident types reported to NFIRS in Zip Code 43345


 Nearest zip codes: 43347, 43358, 43340, 43326, 43360, 43310.


 Based on the data from the years 2002 - 2018 the average number of fires per year is 9. The highest number of reported fires - 20 took place in 2018, and the least - 2 in 2014. The data has a rising trend.
 When looking into fire subcategories, the most reports belonged to: Structure Fires (50.6%), and Outside Fires (37.2%).