Estimated zip code population in 2022: 1,192 Zip code population in 2010: 1,831 Zip code population in 2000: 1,748
Houses and condos: 647 Renter-occupied apartments: 83
% of renters here:
17%
State:
33%
March 2022 cost of living index in zip code 43760: 81.0 (low, U.S. average is 100)
Land area: 34.7 sq. mi. Water area: 0.1 sq. mi.
Population density: 34 people per square mile
(very low).
OSM Map
General Map
Google Map
MSN Map
OSM Map
General Map
Google Map
MSN Map
OSM Map
General Map
Google Map
MSN Map
OSM Map
General Map
Google Map
MSN Map
Please wait while loading the map...
Real estate property taxes paid for housing units in 2022:
This zip code:
0.7% ($1,280)
Ohio:
1.3% ($2,639)
Median real estate property taxes paid for housing units with mortgages in 2022: $1,619 (0.6%) Median real estate property taxes paid for housing units with no mortgage in 2022: $510 (0.2%)
Business Search- 14 Million verified businesses
Males: 690
(57.9%)
Females: 501
(42.1%)
For population 25 years and over in 43760:
High school or higher: 85.5%
Bachelor's degree or higher: 10.8%
Graduate or professional degree: 5.1%
Unemployed: 4.1%
Mean travel time to work (commute): 38.5 minutes
For population 15 years and over in 43760:
Never married: 27.1%
Now married: 53.9%
Separated: 0.0%
Widowed: 2.1%
Divorced: 16.9%
Zip code 43760 compared to state average:
Black race population percentage significantly below state average.
Hispanic race population percentage significantly below state average.
Foreign-born population percentage significantly below state average.
Renting percentage below state average.
Length of stay since moving in significantly above state average.
House age below state average.
Number of college students below state average.
Percentage of population with a bachelor's degree or higher significantly below state average.
Averages for the 2020 tax year for zip code 43760, filed in 2021:
Average Adjusted Gross Income (AGI) in 2020: $56,357 (Individual Income Tax Returns)
Here:
$56,357
State:
$67,288
Salary/wage: $48,696 (reported on 81.6% of returns)
Here:
$48,696
State:
$55,628
(% of AGI for various income ranges: 1106.7% for AGIs below $25k, 3625.6% for AGIs $25k-50k, 6686.7% for AGIs $50k-75k, 9340.0% for AGIs $75k-100k, 17280.0% for AGIs $100k-200k)
Taxable interest for individuals: $424 (reported on 19.5% of returns)
This zip code:
$424
Ohio:
$1,518
(% of AGI for various income ranges: 7.6% for AGIs below $25k, 5.6% for AGIs $25k-50k, 15.0% for AGIs $50k-75k, 40.0% for AGIs $100k-200k)
Ordinary dividends: $1,889 (reported on 10.3% of returns)
Here:
$1,889
State:
$7,167
(% of AGI for various income ranges: 6.2% for AGIs below $25k, 68.3% for AGIs $50k-75k, 107.1% for AGIs $100k-200k)
Net capital gain/loss in AGI: +$6,578 (reported on 10.3% of returns)
Here:
+$6,578
State:
+$18,919
(% of AGI for various income ranges: 3.8% for AGIs below $25k, 65.0% for AGIs $50k-75k, 722.9% for AGIs $100k-200k)
Profit/loss from business: +$11,973 (reported on 17.2% of returns)
Here:
+$11,973
State:
+$13,744
(% of AGI for various income ranges: 203.3% for AGIs below $25k, 89.4% for AGIs $25k-50k, 535.0% for AGIs $50k-75k, 808.6% for AGIs $100k-200k)
Taxable individual retirement arrangement distribution: $18,850 (reported on 4.6% of returns)
43760:
$18,850
Ohio:
$18,876
(% of AGI for various income ranges: 628.3% for AGIs $50k-75k)
Total itemized deductions: $25,700 (reported on 2.3% of returns)
Here:
$25,700
State:
$33,869
(% of AGI for various income ranges: 428.3% for AGIs $50k-75k)
Taxes paid: $7,650 (reported on 2.3% of returns)
43760:
$7,650
State:
$7,681
(% of AGI for various income ranges: 127.5% for AGIs $50k-75k)
Earned income credit: $2,406 (reported on 18.4% of returns)
Here:
$2,406
State:
$2,304
(% of AGI for various income ranges: 97.1% for AGIs below $25k, 100.6% for AGIs $25k-50k)
Percentage of individuals using paid preparers for their 2020 taxes: 94.3%
Here:
94%
State:
94%
(% for various income ranges: 89.7% for AGIs below $25k, 95.2% for AGIs $25k-50k, 100.0% for AGIs $50k-75k, 100.0% for AGIs $75k-100k, 92.3% for AGIs $100k-200k)
Averages for the 2012 tax year for zip code 43760, filed in 2013:
Average Adjusted Gross Income (AGI) in 2012: $40,568 (Individual Income Tax Returns)
Here:
$40,568
State:
$54,926
Salary/wage: $37,105 (reported on 85.1% of returns)
Here:
$37,105
State:
$45,869
(% of AGI for various income ranges: 74.1% for AGIs below $25k, 80.7% for AGIs $25k-50k, 83.5% for AGIs $50k-75k, 82.4% for AGIs $75k-100k, 65.7% for AGIs $100k-200k)
Taxable interest for individuals: $473 (reported on 20.3% of returns)
This zip code:
$473
Ohio:
$1,297
(% of AGI for various income ranges: 0.2% for AGIs below $25k, 0.2% for AGIs $25k-50k, 0.5% for AGIs $50k-75k, 0.2% for AGIs $100k-200k)
Ordinary dividends: $1,012 (reported on 10.8% of returns)
Here:
$1,012
State:
$5,821
(% of AGI for various income ranges: 0.4% for AGIs below $25k, 0.4% for AGIs $50k-75k, 0.8% for AGIs $75k-100k)
Net capital gain/loss in AGI: +$680 (reported on 6.8% of returns)
Here:
+$680
State:
+$11,232
(% of AGI for various income ranges: 0.9% for AGIs $75k-100k)
Profit/loss from business: +$7,025 (reported on 16.2% of returns)
Here:
+$7,025
State:
+$12,773
(% of AGI for various income ranges: 8.8% for AGIs below $25k, 3.7% for AGIs $25k-50k, 3.0% for AGIs $50k-75k)
Taxable individual retirement arrangement distribution: $9,960 (reported on 6.8% of returns)
43760:
$9,960
Ohio:
$14,511
(% of AGI for various income ranges: 6.2% for AGIs below $25k, 3.4% for AGIs $50k-75k)
Total itemized deductions: $16,494 (23% of AGI, reported on 24.3% of returns)
Here:
$16,494
State:
$21,278
Here:
23.3% of AGI
State:
18.8% of AGI
(% of AGI for various income ranges: 9.0% for AGIs $25k-50k, 10.7% for AGIs $50k-75k, 13.1% for AGIs $75k-100k, 13.6% for AGIs $100k-200k)
Charity contributions: $3,000 (reported on 13.5% of returns)
Here:
$3,000
State:
$3,943
(% of AGI for various income ranges: 1.2% for AGIs below $25k, 1.3% for AGIs $50k-75k, 1.1% for AGIs $75k-100k, 1.8% for AGIs $100k-200k)
Taxes paid: $5,061 (reported on 24.3% of returns)
43760:
$5,061
State:
$9,568
(% of AGI for various income ranges: 1.6% for AGIs $25k-50k, 3.3% for AGIs $50k-75k, 4.3% for AGIs $75k-100k, 5.4% for AGIs $100k-200k)
Earned income credit: $2,200 (reported on 21.6% of returns)
Here:
$2,200
State:
$2,285
(% of AGI for various income ranges: 6.6% for AGIs below $25k, 1.3% for AGIs $25k-50k)
Percentage of individuals using paid preparers for their 2012 taxes: 51.4%
Here:
51%
State:
51%
(% for various income ranges: 48.4% for AGIs below $25k, 52.4% for AGIs $25k-50k, 58.3% for AGIs $50k-75k, 50.0% for AGIs $75k-100k, 50.0% for AGIs $100k-200k)
Averages for the 2004 tax year for zip code 43760, filed in 2005:
Average Adjusted Gross Income (AGI) in 2004: $33,905 (Individual Income Tax Returns)
Here:
$33,905
State:
$44,480
Salary/wage: $32,934 (reported on 86.0% of returns)
Here:
$32,934
State:
$39,198
(% of AGI for various income ranges: 92.4% for AGIs below $10k, 76.2% for AGIs $10k-25k, 85.9% for AGIs $25k-50k, 87.9% for AGIs $50k-75k, 88.1% for AGIs $75k-100k, 69.2% for AGIs over 100k)
Taxable interest for individuals: $646 (reported on 30.9% of returns)
This zip code:
$646
Ohio:
$1,532
(% of AGI for various income ranges: 4.3% for AGIs below $10k, 0.9% for AGIs $10k-25k, 0.5% for AGIs $25k-50k, 0.6% for AGIs $50k-75k, 0.2% for AGIs $75k-100k, 0.4% for AGIs over 100k)
Taxable dividends: $2,681 (reported on 11.7% of returns)
Here:
$2,681
State:
$3,496
(% of AGI for various income ranges: 0.8% for AGIs $10k-25k, 0.5% for AGIs $25k-50k, 0.0% for AGIs $50k-75k, 4.3% for AGIs $75k-100k)
Net capital gain/loss: +$2,017 (reported on 7.5% of returns)
Here:
+$2,017
State:
+$8,582
Profit/loss from business: +$6,043 (reported on 17.9% of returns)
Here:
+$6,043
State:
+$10,813
(% of AGI for various income ranges: 21.1% for AGIs below $10k, 10.6% for AGIs $10k-25k, 3.0% for AGIs $25k-50k, 1.1% for AGIs $50k-75k)
Total itemized deductions: $16,404 (27% of AGI, reported on 24.9% of returns)
Here:
$16,404
State:
$17,503
Here:
26.6% of AGI
State:
20.8% of AGI
(% of AGI for various income ranges: 8.6% for AGIs $10k-25k, 7.6% for AGIs $25k-50k, 13.9% for AGIs $50k-75k, 13.6% for AGIs $75k-100k, 24.1% for AGIs over 100k)
Charity contributions deductions: $2,046 (3% of AGI, reported on 16.8% of returns)
Here:
$2,046
State:
$3,087
Here:
3.1% of AGI
State:
3.4% of AGI
(% of AGI for various income ranges: 1.2% for AGIs $10k-25k, 0.8% for AGIs $25k-50k, 1.1% for AGIs $50k-75k, 0.7% for AGIs $75k-100k, 1.9% for AGIs over 100k)
Total tax: $3,566 (reported on 74.5% of returns)
43760:
$3,566
State:
$6,781
(% of AGI for various income ranges: 4.0% for AGIs below $10k, 4.0% for AGIs $10k-25k, 6.6% for AGIs $25k-50k, 7.2% for AGIs $50k-75k, 9.6% for AGIs $75k-100k, 15.2% for AGIs over 100k)
Earned income credit: $1,832 (reported on 18.4% of returns)
Here:
$1,832
State:
$1,696
Percentage of individuals using paid preparers for their 2004 taxes: 58.8%
Here:
59%
State:
55%
(% for various income ranges: 51.6% for AGIs below $10k, 61.0% for AGIs $10k-25k, 64.0% for AGIs $25k-50k, 58.3% for AGIs $50k-75k, 50.0% for AGIs $75k-100k, 55.0% for AGIs over 100k)
Household received Food Stamps/SNAP in the past 12 months: 48 Household did not receive Food Stamps/SNAP in the past 12 months: 449
Women who had a birth in the past 12 months: 14 (0 now married, 14 unmarried) Women who did not have a birth in the past 12 months: 230 (152 now married, 77 unmarried)
Housing units in zip code 43760 with a mortgage: 280 (59 second mortgage, 55 both second mortgage and home equity loan) Median monthly owner costs for units with a mortgage: $1,089 Median monthly owner costs for units without a mortgage: $289
Residents with income below the poverty level in 2022:
This zip code:
1.2%
Whole state:
13.4%
Residents with income below 50% of the poverty level in 2022:
This zip code:
0.2%
Whole state:
7.0%
Median number of rooms in houses and condos:
Here:
5.5
State:
6.7
Median number of rooms in apartments:
Here:
3.2
State:
4.4
Notable locations in this zip code not listed on our city pages
Size of family households: 130 2-persons, 46 3-persons, 53 4-persons, 64 6-persons
Size of nonfamily households: 199 1-person, 3 2-persons
103 married couples with children.
26 single-parent households (26 men).
95.0% of residents of 43760 zip code speak English at home.
1.8% of residents speak Spanish at home (100% very well).
2.5% of residents speak other Indo-European language at home (100% very well).
Foreign born population: 0 (0.0%)
:
0.0%
Whole state:
5.0%
24%German
15%American
12%Italian
Housing units lacking complete plumbing facilities: 15.0% Housing units lacking complete kitchen facilities: 21.1%
36.3%Utility gas
27.3%Bottled, tank, or LP gas
16.4%Wood
11.1%Fuel oil, kerosene, etc.
7.6%Electricity
1.6%Other fuel
Population in 1990: 1,550. Population change in the 1990s: +198 (+12.8%).
Place of birth for U.S.-born residents:
This state: 1,039
Midwest: 45
South: 103
67% of the 43760 zip code residents lived in the same house 5 years ago. Out of people who lived in different houses, 51% lived in this county. Out of people who lived in different counties, 50% lived in Ohio.
95% of the 43760 zip code residents lived in the same house 1 year ago. Out of people who lived in different houses, 34% moved from different county within same state. Out of people who lived in different houses, 82% moved from different state.
Private vs. public school enrollment:
Students in private schools in grades 1 to 8 (elementary and middle school): 20
Here:
19.9%
Ohio:
16.0%
Students in private schools in grades 9 to 12 (high school):
Here:
0.0%
Ohio:
13.1%
Students in private undergraduate colleges: 25
Here:
100.0%
Ohio:
22.3%
Occupation by median earnings in the past 12 months ($)
51,189Sales and related occupations
42,627Office and administrative support occupations
37,054Material moving occupations
35,994Production occupations
Top industries in this zip code by the number of employees in 2005:
Other Services (except Public Administration): General Automotive Repair (10-19 employees: 1 establishment, 1-4 employees: 1 establishment)
Educational Services: Elementary and Secondary Schools (10-19: 1)
Professional, Scientific, and Technical Services: Title Abstract and Settlement Offices (1-4: 1)
Fatal accident statistics in 2012:
Fatal accident count: 1
Vehicles involved in fatal accidents: 2
Fatal accidents caused by drunken drivers: 0
Fatalities: 2
Persons involved in fatal accidents: 2
Pedestrians involved in fatal accidents: 0
Home Mortgage Disclosure Act Aggregated Statistics For Year 2009 (Based on 2 partial tracts)
A) FHA, FSA/RHS & VA Home Purchase Loans
B) Conventional Home Purchase Loans
C) Refinancings
D) Home Improvement Loans
F) Non-occupant Loans on < 5 Family Dwellings (A B C & D)
G) Loans On Manufactured Home Dwelling (A B C & D)
Number
Average Value
Number
Average Value
Number
Average Value
Number
Average Value
Number
Average Value
Number
Average Value
LOANS ORIGINATED
3
$132,670
3
$106,890
14
$137,231
1
$87,670
1
$57,670
0
$0
APPLICATIONS APPROVED, NOT ACCEPTED
0
$0
0
$0
1
$172,220
0
$0
0
$0
0
$0
APPLICATIONS DENIED
0
$0
1
$45,480
6
$142,460
1
$8,010
0
$0
1
$103,600
APPLICATIONS WITHDRAWN
0
$0
0
$0
1
$143,380
0
$0
0
$0
0
$0
FILES CLOSED FOR INCOMPLETENESS
0
$0
0
$0
1
$72,620
0
$0
0
$0
0
$0
Aggregated Statistics For Year 2008 (Based on 2 partial tracts)
A) FHA, FSA/RHS & VA Home Purchase Loans
B) Conventional Home Purchase Loans
C) Refinancings
D) Home Improvement Loans
G) Loans On Manufactured Home Dwelling (A B C & D)
Number
Average Value
Number
Average Value
Number
Average Value
Number
Average Value
Number
Average Value
LOANS ORIGINATED
1
$149,610
2
$135,815
7
$133,513
1
$48,510
1
$92,290
APPLICATIONS APPROVED, NOT ACCEPTED
0
$0
1
$48,770
2
$112,850
0
$0
0
$0
APPLICATIONS DENIED
0
$0
1
$95,050
7
$127,384
1
$56,250
1
$58,380
APPLICATIONS WITHDRAWN
0
$0
0
$0
2
$161,625
0
$0
0
$0
FILES CLOSED FOR INCOMPLETENESS
0
$0
0
$0
0
$0
0
$0
0
$0
Aggregated Statistics For Year 2007 (Based on 2 partial tracts)
A) FHA, FSA/RHS & VA Home Purchase Loans
B) Conventional Home Purchase Loans
C) Refinancings
D) Home Improvement Loans
F) Non-occupant Loans on < 5 Family Dwellings (A B C & D)
G) Loans On Manufactured Home Dwelling (A B C & D)
Number
Average Value
Number
Average Value
Number
Average Value
Number
Average Value
Number
Average Value
Number
Average Value
LOANS ORIGINATED
1
$90,420
4
$139,752
9
$108,729
2
$33,330
1
$129,140
1
$132,340
APPLICATIONS APPROVED, NOT ACCEPTED
0
$0
1
$78,230
3
$120,210
0
$0
0
$0
0
$0
APPLICATIONS DENIED
0
$0
1
$84,820
11
$117,513
1
$80,010
0
$0
1
$86,950
APPLICATIONS WITHDRAWN
0
$0
0
$0
3
$126,053
0
$0
0
$0
0
$0
FILES CLOSED FOR INCOMPLETENESS
0
$0
0
$0
1
$121,310
0
$0
0
$0
0
$0
Aggregated Statistics For Year 2006 (Based on 2 partial tracts)
A) FHA, FSA/RHS & VA Home Purchase Loans
B) Conventional Home Purchase Loans
C) Refinancings
D) Home Improvement Loans
F) Non-occupant Loans on < 5 Family Dwellings (A B C & D)
G) Loans On Manufactured Home Dwelling (A B C & D)
Number
Average Value
Number
Average Value
Number
Average Value
Number
Average Value
Number
Average Value
Number
Average Value
LOANS ORIGINATED
1
$91,760
6
$126,468
12
$111,828
2
$25,675
2
$66,885
2
$60,340
APPLICATIONS APPROVED, NOT ACCEPTED
0
$0
1
$63,900
3
$107,333
0
$0
0
$0
0
$0
APPLICATIONS DENIED
0
$0
2
$100,970
13
$114,215
2
$75,470
0
$0
1
$69,150
APPLICATIONS WITHDRAWN
0
$0
1
$100,930
5
$134,818
0
$0
0
$0
0
$0
FILES CLOSED FOR INCOMPLETENESS
0
$0
2
$94,030
1
$83,220
0
$0
0
$0
0
$0
Aggregated Statistics For Year 2005 (Based on 2 partial tracts)
B) Conventional Home Purchase Loans
C) Refinancings
D) Home Improvement Loans
F) Non-occupant Loans on < 5 Family Dwellings (A B C & D)
G) Loans On Manufactured Home Dwelling (A B C & D)
Number
Average Value
Number
Average Value
Number
Average Value
Number
Average Value
Number
Average Value
LOANS ORIGINATED
7
$106,724
10
$117,961
3
$63,160
1
$104,040
1
$55,710
APPLICATIONS APPROVED, NOT ACCEPTED
1
$79,660
4
$97,122
0
$0
0
$0
0
$0
APPLICATIONS DENIED
2
$77,385
15
$116,596
2
$50,240
0
$0
1
$75,560
APPLICATIONS WITHDRAWN
1
$135,280
6
$137,090
1
$71,110
0
$0
0
$0
FILES CLOSED FOR INCOMPLETENESS
1
$38,270
1
$44,770
0
$0
0
$0
0
$0
Aggregated Statistics For Year 2004 (Based on 2 partial tracts)
A) FHA, FSA/RHS & VA Home Purchase Loans
B) Conventional Home Purchase Loans
C) Refinancings
D) Home Improvement Loans
F) Non-occupant Loans on < 5 Family Dwellings (A B C & D)
G) Loans On Manufactured Home Dwelling (A B C & D)
Number
Average Value
Number
Average Value
Number
Average Value
Number
Average Value
Number
Average Value
Number
Average Value
LOANS ORIGINATED
1
$69,950
7
$107,791
17
$109,884
2
$35,825
1
$72,450
2
$68,310
APPLICATIONS APPROVED, NOT ACCEPTED
0
$0
1
$70,220
3
$125,047
0
$0
0
$0
0
$0
APPLICATIONS DENIED
0
$0
2
$135,950
15
$107,115
2
$36,625
0
$0
1
$77,070
APPLICATIONS WITHDRAWN
0
$0
1
$45,390
7
$122,579
0
$0
0
$0
0
$0
FILES CLOSED FOR INCOMPLETENESS
0
$0
0
$0
1
$243,590
0
$0
0
$0
0
$0
Aggregated Statistics For Year 2003 (Based on 2 partial tracts)
A) FHA, FSA/RHS & VA Home Purchase Loans
B) Conventional Home Purchase Loans
C) Refinancings
D) Home Improvement Loans
F) Non-occupant Loans on < 5 Family Dwellings (A B C & D)
Number
Average Value
Number
Average Value
Number
Average Value
Number
Average Value
Number
Average Value
LOANS ORIGINATED
1
$134,120
6
$130,207
34
$108,028
1
$39,430
1
$83,040
APPLICATIONS APPROVED, NOT ACCEPTED
0
$0
0
$0
4
$106,555
0
$0
0
$0
APPLICATIONS DENIED
0
$0
1
$95,320
15
$113,647
1
$12,910
0
$0
APPLICATIONS WITHDRAWN
0
$0
1
$96,920
7
$108,847
0
$0
0
$0
FILES CLOSED FOR INCOMPLETENESS
0
$0
0
$0
2
$97,100
0
$0
0
$0
Aggregated Statistics For Year 2002 (Based on 2 partial tracts)
A) FHA, FSA/RHS & VA Home Purchase Loans
B) Conventional Home Purchase Loans
C) Refinancings
D) Home Improvement Loans
F) Non-occupant Loans on < 5 Family Dwellings (A B C & D)
Number
Average Value
Number
Average Value
Number
Average Value
Number
Average Value
Number
Average Value
LOANS ORIGINATED
2
$97,055
5
$101,762
25
$104,390
1
$11,570
1
$39,960
APPLICATIONS APPROVED, NOT ACCEPTED
0
$0
1
$64,880
5
$74,458
0
$0
0
$0
APPLICATIONS DENIED
0
$0
1
$66,570
11
$108,224
1
$17,980
0
$0
APPLICATIONS WITHDRAWN
0
$0
0
$0
6
$118,993
0
$0
0
$0
FILES CLOSED FOR INCOMPLETENESS
0
$0
0
$0
2
$139,195
0
$0
0
$0
Aggregated Statistics For Year 2001 (Based on 2 partial tracts)
A) FHA, FSA/RHS & VA Home Purchase Loans
B) Conventional Home Purchase Loans
C) Refinancings
D) Home Improvement Loans
Number
Average Value
Number
Average Value
Number
Average Value
Number
Average Value
LOANS ORIGINATED
1
$157,890
6
$110,212
21
$95,895
2
$28,615
APPLICATIONS APPROVED, NOT ACCEPTED
0
$0
1
$26,610
6
$90,053
1
$16,380
APPLICATIONS DENIED
0
$0
1
$51,260
14
$98,167
2
$12,460
APPLICATIONS WITHDRAWN
0
$0
0
$0
7
$116,717
0
$0
FILES CLOSED FOR INCOMPLETENESS
0
$0
0
$0
1
$136,440
0
$0
Aggregated Statistics For Year 2000 (Based on 2 partial tracts)
A) FHA, FSA/RHS & VA Home Purchase Loans
B) Conventional Home Purchase Loans
C) Refinancings
D) Home Improvement Loans
F) Non-occupant Loans on < 5 Family Dwellings (A B C & D)
Number
Average Value
Number
Average Value
Number
Average Value
Number
Average Value
Number
Average Value
LOANS ORIGINATED
2
$97,720
6
$80,412
9
$72,248
2
$16,285
1
$34,800
APPLICATIONS APPROVED, NOT ACCEPTED
0
$0
1
$31,510
3
$66,543
0
$0
0
$0
APPLICATIONS DENIED
0
$0
2
$61,275
8
$68,641
2
$12,860
0
$0
APPLICATIONS WITHDRAWN
0
$0
1
$30,530
2
$107,645
0
$0
0
$0
FILES CLOSED FOR INCOMPLETENESS
0
$0
0
$0
1
$35,330
0
$0
0
$0
Aggregated Statistics For Year 1999 (Based on 1 partial tract)
Detailed PMIC statistics for the following Tracts:7589.00
2002 - 2018 National Fire Incident Reporting System (NFIRS) incidents
Based on the data from the years 2002 - 2018 the average number of fire incidents per year is 14. The highest number of reported fire incidents - 27 took place in 2009, and the least - 5 in 2015. The data has a rising trend.
When looking into fire subcategories, the most reports belonged to: Structure Fires (47.8%), and Outside Fires (37.9%).
Fire incident types reported to NFIRS in Zip Code 43760

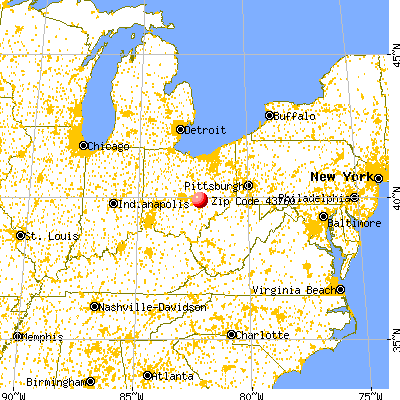


 Nearest zip codes: 43738, 43740, 43746, 43735, 43739, 43721.


 Based on the data from the years 2002 - 2018 the average number of fire incidents per year is 14. The highest number of reported fire incidents - 27 took place in 2009, and the least - 5 in 2015. The data has a rising trend.
 When looking into fire subcategories, the most reports belonged to: Structure Fires (47.8%), and Outside Fires (37.9%).