Estimated zip code population in 2022: 2,645 Zip code population in 2010: 2,025 Zip code population in 2000: 1,727
Houses and condos: 851 Renter-occupied apartments: 63
% of renters here:
7%
State:
33%
March 2022 cost of living index in zip code 43739: 83.8 (less than average, U.S. average is 100)
Land area: 31.9 sq. mi. Water area: 0.1 sq. mi.
Population density: 83 people per square mile
(very low).
OSM Map
General Map
Google Map
MSN Map
OSM Map
General Map
Google Map
MSN Map
OSM Map
General Map
Google Map
MSN Map
OSM Map
General Map
Google Map
MSN Map
Please wait while loading the map...
Real estate property taxes paid for housing units in 2022:
This zip code:
0.9% ($2,880)
Ohio:
1.3% ($2,639)
Median real estate property taxes paid for housing units with mortgages in 2022: $3,288 (0.9%) Median real estate property taxes paid for housing units with no mortgage in 2022: $2,232 (1.3%)
Business Search- 14 Million verified businesses
Males: 1,547
(58.5%)
Females: 1,098
(41.5%)
For population 25 years and over in 43739:
High school or higher: 92.7%
Bachelor's degree or higher: 22.6%
Graduate or professional degree: 5.9%
Unemployed: 1.2%
Mean travel time to work (commute): 29.5 minutes
For population 15 years and over in 43739:
Never married: 28.7%
Now married: 59.7%
Separated: 0.7%
Widowed: 3.1%
Divorced: 7.8%
Zip code 43739 compared to state average:
Median house value above state average.
Unemployed percentage significantly below state average.
Black race population percentage significantly below state average.
Hispanic race population percentage significantly below state average.
Foreign-born population percentage significantly below state average.
Renting percentage significantly below state average.
Length of stay since moving in significantly below state average.
Number of rooms per house above state average.
Number of college students below state average.
Percentage of population with a bachelor's degree or higher below state average.
Estimated median house/condo value in 2022: $312,330
43739:
$312,330
Ohio:
$204,100
According to our research of Ohio and other state lists, there was 1 registered sex offender living in 43739 zip code as of May 28, 2024. The ratio of all residents to sex offenders in zip code 43739 is 2,481 to 1. The ratio of registered sex offenders to all residents in this zip code is much lower than the state average.
Median resident age:
This zip code:
36.4 years
Ohio median age:
39.9 years
Average household size:
This zip code:
3.1 people
Ohio:
2.4 people
Averages for the 2020 tax year for zip code 43739, filed in 2021:
Average Adjusted Gross Income (AGI) in 2020: $60,112 (Individual Income Tax Returns)
Here:
$60,112
State:
$67,288
Salary/wage: $55,224 (reported on 84.5% of returns)
Here:
$55,224
State:
$55,628
(% of AGI for various income ranges: 1223.2% for AGIs below $25k, 3627.6% for AGIs $25k-50k, 6332.0% for AGIs $50k-75k, 9378.9% for AGIs $75k-100k, 17776.9% for AGIs $100k-200k)
Taxable interest for individuals: $383 (reported on 21.8% of returns)
This zip code:
$383
Ohio:
$1,518
(% of AGI for various income ranges: 6.4% for AGIs below $25k, 7.1% for AGIs $25k-50k, 19.3% for AGIs $50k-75k, 10.0% for AGIs $75k-100k, 19.2% for AGIs $100k-200k)
Ordinary dividends: $1,454 (reported on 11.8% of returns)
Here:
$1,454
State:
$7,167
(% of AGI for various income ranges: 18.6% for AGIs $25k-50k, 43.3% for AGIs $50k-75k, 65.4% for AGIs $100k-200k)
Net capital gain/loss in AGI: +$5,931 (reported on 11.8% of returns)
Here:
+$5,931
State:
+$18,919
(% of AGI for various income ranges: 9.5% for AGIs below $25k, 11.9% for AGIs $25k-50k, 140.0% for AGIs $50k-75k, 121.1% for AGIs $75k-100k, 312.3% for AGIs $100k-200k)
Profit/loss from business: +$11,176 (reported on 15.5% of returns)
Here:
+$11,176
State:
+$13,744
(% of AGI for various income ranges: 155.9% for AGIs below $25k, 138.1% for AGIs $25k-50k, 301.3% for AGIs $50k-75k, 75.6% for AGIs $75k-100k, 574.6% for AGIs $100k-200k)
Taxable individual retirement arrangement distribution: $14,229 (reported on 6.4% of returns)
43739:
$14,229
Ohio:
$18,876
(% of AGI for various income ranges: 268.6% for AGIs $25k-50k, 480.0% for AGIs $75k-100k)
Total itemized deductions: $27,600 (reported on 5.5% of returns)
Here:
$27,600
State:
$33,869
(% of AGI for various income ranges: 436.7% for AGIs $50k-75k, 770.0% for AGIs $100k-200k)
Charity contributions: $9,833 (reported on 2.7% of returns)
Here:
$9,833
State:
$14,577
(% of AGI for various income ranges: 327.8% for AGIs $75k-100k)
Taxes paid: $7,033 (reported on 5.5% of returns)
43739:
$7,033
State:
$7,681
(% of AGI for various income ranges: 105.3% for AGIs $50k-75k, 203.1% for AGIs $100k-200k)
Earned income credit: $2,143 (reported on 12.7% of returns)
Here:
$2,143
State:
$2,304
(% of AGI for various income ranges: 93.6% for AGIs below $25k, 44.8% for AGIs $25k-50k)
Percentage of individuals using paid preparers for their 2020 taxes: 95.5%
Here:
95%
State:
94%
(% for various income ranges: 93.5% for AGIs below $25k, 96.2% for AGIs $25k-50k, 95.2% for AGIs $50k-75k, 100.0% for AGIs $75k-100k, 105.6% for AGIs $100k-200k, 0.0% for AGIs over 200k)
Averages for the 2012 tax year for zip code 43739, filed in 2013:
Average Adjusted Gross Income (AGI) in 2012: $47,477 (Individual Income Tax Returns)
Here:
$47,477
State:
$54,926
Salary/wage: $43,915 (reported on 87.2% of returns)
Here:
$43,915
State:
$45,869
(% of AGI for various income ranges: 70.5% for AGIs below $25k, 80.1% for AGIs $25k-50k, 82.5% for AGIs $50k-75k, 84.9% for AGIs $75k-100k, 80.0% for AGIs $100k-200k)
Taxable interest for individuals: $355 (reported on 23.4% of returns)
This zip code:
$355
Ohio:
$1,297
(% of AGI for various income ranges: 0.6% for AGIs below $25k, 0.1% for AGIs $25k-50k, 0.1% for AGIs $50k-75k, 0.2% for AGIs $100k-200k)
Ordinary dividends: $762 (reported on 13.8% of returns)
Here:
$762
State:
$5,821
(% of AGI for various income ranges: 0.4% for AGIs below $25k, 0.2% for AGIs $25k-50k, 0.3% for AGIs $50k-75k, 0.3% for AGIs $100k-200k)
Net capital gain/loss in AGI: +$2,444 (reported on 9.6% of returns)
Here:
+$2,444
State:
+$11,232
(% of AGI for various income ranges: 0.3% for AGIs $25k-50k, 0.6% for AGIs $50k-75k, 1.5% for AGIs $75k-100k)
Profit/loss from business: +$9,561 (reported on 19.1% of returns)
Here:
+$9,561
State:
+$12,773
(% of AGI for various income ranges: 12.4% for AGIs below $25k, 4.7% for AGIs $25k-50k, 2.8% for AGIs $50k-75k, 5.3% for AGIs $75k-100k)
Taxable individual retirement arrangement distribution: $10,329 (reported on 7.4% of returns)
43739:
$10,329
Ohio:
$14,511
(% of AGI for various income ranges: 4.2% for AGIs $25k-50k, 3.3% for AGIs $75k-100k)
Total itemized deductions: $17,200 (23% of AGI, reported on 29.8% of returns)
Here:
$17,200
State:
$21,278
Here:
22.6% of AGI
State:
18.8% of AGI
(% of AGI for various income ranges: 8.2% for AGIs below $25k, 7.3% for AGIs $25k-50k, 10.7% for AGIs $50k-75k, 12.1% for AGIs $75k-100k, 13.7% for AGIs $100k-200k)
Charity contributions: $3,118 (reported on 18.1% of returns)
Here:
$3,118
State:
$3,943
(% of AGI for various income ranges: 0.6% for AGIs $25k-50k, 1.2% for AGIs $50k-75k, 1.5% for AGIs $75k-100k, 1.8% for AGIs $100k-200k)
Taxes paid: $5,922 (reported on 28.7% of returns)
43739:
$5,922
State:
$9,568
(% of AGI for various income ranges: 2.3% for AGIs $25k-50k, 3.1% for AGIs $50k-75k, 3.9% for AGIs $75k-100k, 6.0% for AGIs $100k-200k)
Earned income credit: $2,100 (reported on 18.1% of returns)
Here:
$2,100
State:
$2,285
(% of AGI for various income ranges: 6.6% for AGIs below $25k, 0.9% for AGIs $25k-50k)
Percentage of individuals using paid preparers for their 2012 taxes: 56.4%
Here:
56%
State:
51%
(% for various income ranges: 51.5% for AGIs below $25k, 55.6% for AGIs $25k-50k, 56.2% for AGIs $50k-75k, 70.0% for AGIs $75k-100k, 62.5% for AGIs $100k-200k)
Averages for the 2004 tax year for zip code 43739, filed in 2005:
Average Adjusted Gross Income (AGI) in 2004: $37,617 (Individual Income Tax Returns)
Here:
$37,617
State:
$44,480
Salary/wage: $36,275 (reported on 88.4% of returns)
Here:
$36,275
State:
$39,198
(% of AGI for various income ranges: 120.6% for AGIs below $10k, 76.9% for AGIs $10k-25k, 86.0% for AGIs $25k-50k, 92.3% for AGIs $50k-75k, 87.1% for AGIs $75k-100k, 64.5% for AGIs over 100k)
Taxable interest for individuals: $671 (reported on 38.3% of returns)
This zip code:
$671
Ohio:
$1,532
(% of AGI for various income ranges: 2.9% for AGIs below $10k, 0.7% for AGIs $10k-25k, 1.2% for AGIs $25k-50k, 0.4% for AGIs $50k-75k, 0.1% for AGIs $75k-100k, 0.2% for AGIs over 100k)
Taxable dividends: $801 (reported on 15.7% of returns)
Here:
$801
State:
$3,496
(% of AGI for various income ranges: 3.5% for AGIs below $10k, 0.5% for AGIs $10k-25k, 0.4% for AGIs $25k-50k, 0.1% for AGIs $50k-75k, 0.1% for AGIs $75k-100k, 0.3% for AGIs over 100k)
Net capital gain/loss: +$1,020 (reported on 11.7% of returns)
Here:
+$1,020
State:
+$8,582
(% of AGI for various income ranges: -2.2% for AGIs below $10k, 0.1% for AGIs $10k-25k, 0.3% for AGIs $25k-50k, 0.0% for AGIs $50k-75k, 0.2% for AGIs $75k-100k, 1.7% for AGIs over 100k)
Profit/loss from business: +$4,796 (reported on 17.6% of returns)
Here:
+$4,796
State:
+$10,813
(% of AGI for various income ranges: 2.9% for AGIs below $10k, 8.3% for AGIs $10k-25k, 2.8% for AGIs $25k-50k, 1.2% for AGIs $50k-75k, 1.0% for AGIs $75k-100k)
IRA payment deduction: $2,923 (reported on 1.5% of returns)
43739:
$2,923
Ohio:
$2,794
Total itemized deductions: $14,122 (23% of AGI, reported on 33.1% of returns)
Here:
$14,122
State:
$17,503
Here:
23.4% of AGI
State:
20.8% of AGI
(% of AGI for various income ranges: 7.8% for AGIs $10k-25k, 11.7% for AGIs $25k-50k, 13.3% for AGIs $50k-75k, 16.0% for AGIs $75k-100k, 13.9% for AGIs over 100k)
Charity contributions deductions: $2,032 (3% of AGI, reported on 25.2% of returns)
Here:
$2,032
State:
$3,087
Here:
3.3% of AGI
State:
3.4% of AGI
(% of AGI for various income ranges: 2.8% for AGIs below $10k, 1.3% for AGIs $25k-50k, 1.4% for AGIs $50k-75k, 1.8% for AGIs $75k-100k, 1.5% for AGIs over 100k)
Total tax: $4,056 (reported on 76.4% of returns)
43739:
$4,056
State:
$6,781
(% of AGI for various income ranges: 2.1% for AGIs below $10k, 4.4% for AGIs $10k-25k, 6.6% for AGIs $25k-50k, 8.0% for AGIs $50k-75k, 9.6% for AGIs $75k-100k, 15.5% for AGIs over 100k)
Earned income credit: $1,829 (reported on 14.2% of returns)
Here:
$1,829
State:
$1,696
Percentage of individuals using paid preparers for their 2004 taxes: 57.5%
Here:
58%
State:
55%
(% for various income ranges: 45.1% for AGIs below $10k, 57.3% for AGIs $10k-25k, 63.3% for AGIs $25k-50k, 61.0% for AGIs $50k-75k, 50.0% for AGIs $75k-100k, 66.7% for AGIs over 100k)
Household received Food Stamps/SNAP in the past 12 months: 49 Household did not receive Food Stamps/SNAP in the past 12 months: 795
Women who had a birth in the past 12 months: 59 (45 now married, 14 unmarried) Women who did not have a birth in the past 12 months: 441 (200 now married, 241 unmarried)
Housing units in zip code 43739 with a mortgage: 553 (42 second mortgage, 28 both second mortgage and home equity loan) Houses without a mortgage: 9
Median monthly owner costs for units with a mortgage: $1,837 Median monthly owner costs for units without a mortgage: $537
Residents with income below the poverty level in 2022:
This zip code:
1.9%
Whole state:
13.4%
Residents with income below 50% of the poverty level in 2022:
This zip code:
1.1%
Whole state:
7.0%
Median number of rooms in houses and condos:
Here:
7.6
State:
6.7
Median number of rooms in apartments:
Here:
6.4
State:
4.4
Notable locations in this zip code not listed on our city pages
Cemeteries: Highland Cemetery (1), Cedar Hill Cemetery (2), Goodhope Lutheran Cemetery (3), Hopewell Methodist Episcopal Cemetery (4), Saint Pauls Lutheran Cemetery (5). Display/hide their locations on the map
Size of family households: 213 2-persons, 150 3-persons, 185 4-persons, 89 5-persons, 34 6-persons, 30 7-or-more-persons
Size of nonfamily households: 111 1-person, 19 2-persons
485 married couples with children.
12 single-parent households (1 men, 11 women).
97.5% of residents of 43739 zip code speak English at home.
0.2% of residents speak Spanish at home (100% very well).
1.8% of residents speak other Indo-European language at home (100% very well).
Foreign born population: 14 (0.5%) (0.0% of them are naturalized citizens)
:
0.5%
Whole state:
5.0%
28%English
15%German
14%Irish
12%Italian
5%American
2%Latvian
0%Scottish
Year of entry for the foreign-born population
162010 or later
02000 to 2009
01990 to 1999
0Before 1990
Housing units lacking complete plumbing facilities: 0.4% Housing units lacking complete kitchen facilities: 0.4%
45.1%Bottled, tank, or LP gas
25.0%Utility gas
21.9%Electricity
3.9%Wood
2.3%Other fuel
1.2%Fuel oil, kerosene, etc.
1.1%Solar energy
Population in 1990: 1,632. Population change in the 1990s: +95 (+5.8%).
Place of birth for U.S.-born residents:
This state: 2,362
Northeast: 105
Midwest: 26
South: 116
West: 17
68% of the 43739 zip code residents lived in the same house 5 years ago. Out of people who lived in different houses, 38% lived in this county. Out of people who lived in different counties, 50% lived in Ohio.
85% of the 43739 zip code residents lived in the same house 1 year ago. Out of people who lived in different houses, 80% moved from this county. Out of people who lived in different houses, 12% moved from different county within same state.
Private vs. public school enrollment:
Students in private schools in grades 1 to 8 (elementary and middle school): 66
Here:
30.4%
Ohio:
16.0%
Students in private schools in grades 9 to 12 (high school):
Here:
0.0%
Ohio:
13.1%
Students in private undergraduate colleges:
Here:
0.0%
Ohio:
22.3%
Occupation by median earnings in the past 12 months ($)
113,550Installation, maintenance, and repair occupations
66,844Health diagnosing and treating practitioners and other technical occupations
55,547Construction and extraction occupations
50,593Transportation occupations
50,591Sales and related occupations
48,345Management occupations
Top industries in this zip code by the number of employees in 2005:
Administrative and Support and Waste Management and Remediation Services: Solid Waste Landfill (20-49 employees: 1 establishment)
Mining: Industrial Sand Mining (20-49: 1)
Construction: Framing Contractors (5-9: 1)
Management of Companies and Enterprises: Corporate, Subsidiary, and Regional Managing Offices (5-9: 1)
Construction: Plumbing, Heating, and Air-Conditioning Contractors (1-4: 2)
Wholesale Trade: Farm and Garden Machinery and Equipment Merchant Wholesalers (1-4: 2)
Fatal accident statistics in 2011:
Fatal accident count: 1
Vehicles involved in fatal accidents: 1
Fatal accidents caused by drunken drivers: 0
Fatalities: 1
Persons involved in fatal accidents: 2
Pedestrians involved in fatal accidents: 0
Fatal accident statistics in 2010:
Fatal accident count: 1
Vehicles involved in fatal accidents: 1
Fatal accidents caused by drunken drivers: 1
Fatalities: 1
Persons involved in fatal accidents: 1
Pedestrians involved in fatal accidents: 0
Home Mortgage Disclosure Act Aggregated Statistics For Year 2009 (Based on 2 partial tracts)
A) FHA, FSA/RHS & VA Home Purchase Loans
B) Conventional Home Purchase Loans
C) Refinancings
D) Home Improvement Loans
F) Non-occupant Loans on < 5 Family Dwellings (A B C & D)
G) Loans On Manufactured Home Dwelling (A B C & D)
Number
Average Value
Number
Average Value
Number
Average Value
Number
Average Value
Number
Average Value
Number
Average Value
LOANS ORIGINATED
3
$124,917
2
$150,965
13
$139,153
1
$82,540
1
$54,300
0
$0
APPLICATIONS APPROVED, NOT ACCEPTED
0
$0
0
$0
1
$162,150
0
$0
0
$0
0
$0
APPLICATIONS DENIED
0
$0
1
$42,820
6
$134,137
1
$7,540
0
$0
1
$97,540
APPLICATIONS WITHDRAWN
0
$0
0
$0
1
$135,000
0
$0
0
$0
0
$0
FILES CLOSED FOR INCOMPLETENESS
0
$0
0
$0
1
$68,380
0
$0
0
$0
0
$0
Aggregated Statistics For Year 2008 (Based on 2 partial tracts)
A) FHA, FSA/RHS & VA Home Purchase Loans
B) Conventional Home Purchase Loans
C) Refinancings
D) Home Improvement Loans
G) Loans On Manufactured Home Dwelling (A B C & D)
Number
Average Value
Number
Average Value
Number
Average Value
Number
Average Value
Number
Average Value
LOANS ORIGINATED
1
$140,870
2
$127,880
6
$146,663
1
$45,670
1
$86,900
APPLICATIONS APPROVED, NOT ACCEPTED
0
$0
1
$45,920
1
$212,520
0
$0
0
$0
APPLICATIONS DENIED
0
$0
1
$89,500
6
$139,932
1
$52,960
1
$54,970
APPLICATIONS WITHDRAWN
0
$0
0
$0
2
$152,180
0
$0
0
$0
FILES CLOSED FOR INCOMPLETENESS
0
$0
0
$0
0
$0
0
$0
0
$0
Aggregated Statistics For Year 2007 (Based on 2 partial tracts)
A) FHA, FSA/RHS & VA Home Purchase Loans
B) Conventional Home Purchase Loans
C) Refinancings
D) Home Improvement Loans
F) Non-occupant Loans on < 5 Family Dwellings (A B C & D)
G) Loans On Manufactured Home Dwelling (A B C & D)
Number
Average Value
Number
Average Value
Number
Average Value
Number
Average Value
Number
Average Value
Number
Average Value
LOANS ORIGINATED
1
$85,140
4
$131,588
8
$115,172
2
$31,385
1
$121,590
1
$124,610
APPLICATIONS APPROVED, NOT ACCEPTED
0
$0
1
$73,660
3
$113,187
0
$0
0
$0
0
$0
APPLICATIONS DENIED
0
$0
1
$79,860
10
$121,711
1
$75,340
0
$0
1
$81,870
APPLICATIONS WITHDRAWN
0
$0
0
$0
3
$118,690
0
$0
0
$0
0
$0
FILES CLOSED FOR INCOMPLETENESS
0
$0
0
$0
1
$114,220
0
$0
0
$0
0
$0
Aggregated Statistics For Year 2006 (Based on 2 partial tracts)
A) FHA, FSA/RHS & VA Home Purchase Loans
B) Conventional Home Purchase Loans
C) Refinancings
D) Home Improvement Loans
F) Non-occupant Loans on < 5 Family Dwellings (A B C & D)
G) Loans On Manufactured Home Dwelling (A B C & D)
Number
Average Value
Number
Average Value
Number
Average Value
Number
Average Value
Number
Average Value
Number
Average Value
LOANS ORIGINATED
1
$86,400
6
$119,080
11
$114,867
1
$48,350
1
$125,950
1
$113,630
APPLICATIONS APPROVED, NOT ACCEPTED
0
$0
1
$60,170
2
$151,595
0
$0
0
$0
0
$0
APPLICATIONS DENIED
0
$0
2
$95,070
12
$116,503
2
$71,060
0
$0
1
$65,110
APPLICATIONS WITHDRAWN
0
$0
1
$95,030
5
$126,940
0
$0
0
$0
0
$0
FILES CLOSED FOR INCOMPLETENESS
0
$0
1
$177,070
1
$78,350
0
$0
0
$0
0
$0
Aggregated Statistics For Year 2005 (Based on 2 partial tracts)
B) Conventional Home Purchase Loans
C) Refinancings
D) Home Improvement Loans
F) Non-occupant Loans on < 5 Family Dwellings (A B C & D)
G) Loans On Manufactured Home Dwelling (A B C & D)
Number
Average Value
Number
Average Value
Number
Average Value
Number
Average Value
Number
Average Value
LOANS ORIGINATED
6
$117,237
9
$123,410
2
$89,205
1
$97,960
1
$52,460
APPLICATIONS APPROVED, NOT ACCEPTED
1
$75,000
4
$91,448
0
$0
0
$0
0
$0
APPLICATIONS DENIED
2
$72,865
14
$117,625
2
$47,305
0
$0
1
$71,150
APPLICATIONS WITHDRAWN
1
$127,380
6
$129,080
1
$66,960
0
$0
0
$0
FILES CLOSED FOR INCOMPLETENESS
1
$36,030
1
$42,150
0
$0
0
$0
0
$0
Aggregated Statistics For Year 2004 (Based on 2 partial tracts)
A) FHA, FSA/RHS & VA Home Purchase Loans
B) Conventional Home Purchase Loans
C) Refinancings
D) Home Improvement Loans
F) Non-occupant Loans on < 5 Family Dwellings (A B C & D)
G) Loans On Manufactured Home Dwelling (A B C & D)
Number
Average Value
Number
Average Value
Number
Average Value
Number
Average Value
Number
Average Value
Number
Average Value
LOANS ORIGINATED
1
$65,870
6
$118,410
16
$109,930
2
$33,730
1
$68,210
2
$64,315
APPLICATIONS APPROVED, NOT ACCEPTED
0
$0
1
$66,120
3
$117,740
0
$0
0
$0
0
$0
APPLICATIONS DENIED
0
$0
2
$128,005
14
$108,060
2
$34,485
0
$0
1
$72,570
APPLICATIONS WITHDRAWN
0
$0
1
$42,740
7
$115,417
0
$0
0
$0
0
$0
FILES CLOSED FOR INCOMPLETENESS
0
$0
0
$0
1
$229,360
0
$0
0
$0
0
$0
Aggregated Statistics For Year 2003 (Based on 2 partial tracts)
A) FHA, FSA/RHS & VA Home Purchase Loans
B) Conventional Home Purchase Loans
C) Refinancings
D) Home Improvement Loans
F) Non-occupant Loans on < 5 Family Dwellings (A B C & D)
Number
Average Value
Number
Average Value
Number
Average Value
Number
Average Value
Number
Average Value
LOANS ORIGINATED
1
$126,290
6
$122,600
32
$108,073
1
$37,120
1
$78,190
APPLICATIONS APPROVED, NOT ACCEPTED
0
$0
0
$0
4
$100,330
0
$0
0
$0
APPLICATIONS DENIED
0
$0
1
$89,750
14
$114,651
1
$12,150
0
$0
APPLICATIONS WITHDRAWN
0
$0
1
$91,260
6
$119,568
0
$0
0
$0
FILES CLOSED FOR INCOMPLETENESS
0
$0
0
$0
2
$91,425
0
$0
0
$0
Aggregated Statistics For Year 2002 (Based on 2 partial tracts)
A) FHA, FSA/RHS & VA Home Purchase Loans
B) Conventional Home Purchase Loans
C) Refinancings
D) Home Improvement Loans
F) Non-occupant Loans on < 5 Family Dwellings (A B C & D)
Number
Average Value
Number
Average Value
Number
Average Value
Number
Average Value
Number
Average Value
LOANS ORIGINATED
2
$91,385
4
$119,770
24
$102,386
1
$10,890
1
$37,630
APPLICATIONS APPROVED, NOT ACCEPTED
0
$0
1
$61,090
4
$87,635
0
$0
0
$0
APPLICATIONS DENIED
0
$0
1
$62,680
11
$101,901
1
$16,930
0
$0
APPLICATIONS WITHDRAWN
0
$0
0
$0
6
$112,040
0
$0
0
$0
FILES CLOSED FOR INCOMPLETENESS
0
$0
0
$0
2
$131,065
0
$0
0
$0
Aggregated Statistics For Year 2001 (Based on 2 partial tracts)
A) FHA, FSA/RHS & VA Home Purchase Loans
B) Conventional Home Purchase Loans
C) Refinancings
D) Home Improvement Loans
Number
Average Value
Number
Average Value
Number
Average Value
Number
Average Value
LOANS ORIGINATED
1
$148,660
6
$103,772
20
$94,807
2
$26,940
APPLICATIONS APPROVED, NOT ACCEPTED
0
$0
1
$25,060
6
$84,792
1
$15,420
APPLICATIONS DENIED
0
$0
1
$48,270
13
$99,542
2
$11,730
APPLICATIONS WITHDRAWN
0
$0
0
$0
7
$109,897
0
$0
FILES CLOSED FOR INCOMPLETENESS
0
$0
0
$0
1
$128,470
0
$0
Aggregated Statistics For Year 2000 (Based on 2 partial tracts)
A) FHA, FSA/RHS & VA Home Purchase Loans
B) Conventional Home Purchase Loans
C) Refinancings
D) Home Improvement Loans
F) Non-occupant Loans on < 5 Family Dwellings (A B C & D)
Number
Average Value
Number
Average Value
Number
Average Value
Number
Average Value
Number
Average Value
LOANS ORIGINATED
2
$92,010
5
$90,856
9
$68,027
2
$15,335
1
$32,770
APPLICATIONS APPROVED, NOT ACCEPTED
0
$0
1
$29,670
3
$62,653
0
$0
0
$0
APPLICATIONS DENIED
0
$0
2
$57,695
7
$73,864
1
$24,220
0
$0
APPLICATIONS WITHDRAWN
0
$0
1
$28,740
2
$101,355
0
$0
0
$0
FILES CLOSED FOR INCOMPLETENESS
0
$0
0
$0
1
$33,270
0
$0
0
$0
Aggregated Statistics For Year 1999 (Based on 1 partial tract)
Detailed PMIC statistics for the following Tracts:7589.00
2002 - 2018 National Fire Incident Reporting System (NFIRS) incidents
Based on the data from the years 2002 - 2018 the average number of fires per year is 29. The highest number of reported fire incidents - 49 took place in 2016, and the least - 18 in 2006. The data has an increasing trend.
When looking into fire subcategories, the most incidents belonged to: Structure Fires (46.9%), and Outside Fires (34.1%).
Fire incident types reported to NFIRS in Zip Code 43739

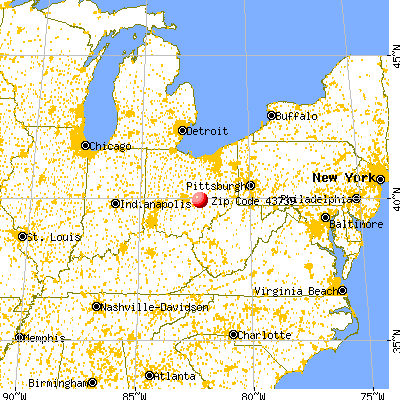


 Nearest zip codes: 43721, 43740, 43760, 43783, 43076, 43056.


 Based on the data from the years 2002 - 2018 the average number of fires per year is 29. The highest number of reported fire incidents - 49 took place in 2016, and the least - 18 in 2006. The data has an increasing trend.
 When looking into fire subcategories, the most incidents belonged to: Structure Fires (46.9%), and Outside Fires (34.1%).