Estimated zip code population in 2022: 2,322 Zip code population in 2010: 2,476 Zip code population in 2000: 2,556
Houses and condos: 1,251 Renter-occupied apartments: 199
% of renters here:
22%
State:
33%
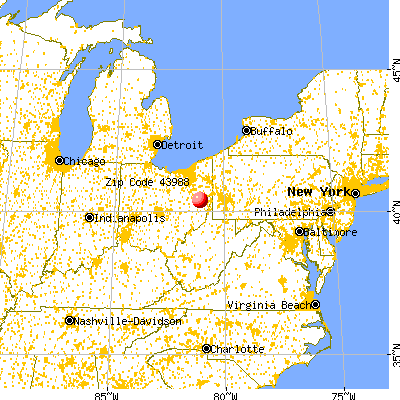
March 2022 cost of living index in zip code 43988: 81.5 (low, U.S. average is 100)
Land area: 52.1 sq. mi. Water area: 0.6 sq. mi.
Population density: 45 people per square mile
(very low).
OSM Map
General Map
Google Map
MSN Map
OSM Map
General Map
Google Map
MSN Map
OSM Map
General Map
Google Map
MSN Map
OSM Map
General Map
Google Map
MSN Map
Please wait while loading the map...
Real estate property taxes paid for housing units in 2022:
This zip code:
1.1% ($1,430)
Ohio:
1.3% ($2,639)
Median real estate property taxes paid for housing units with mortgages in 2022: $1,382 (1.1%) Median real estate property taxes paid for housing units with no mortgage in 2022: $1,516 (0.9%)
Business Search- 14 Million verified businesses
Males: 1,116
(48.1%)
Females: 1,206
(51.9%)
For population 25 years and over in 43988:
High school or higher: 80.1%
Bachelor's degree or higher: 16.3%
Graduate or professional degree: 5.9%
Unemployed: 4.1%
Mean travel time to work (commute): 30.4 minutes
For population 15 years and over in 43988:
Never married: 20.1%
Now married: 65.2%
Separated: 0.6%
Widowed: 5.5%
Divorced: 8.5%
Zip code 43988 compared to state average:
Median house value below state average.
Black race population percentage significantly below state average.
Hispanic race population percentage below state average.
Foreign-born population percentage significantly below state average.
Length of stay since moving in above state average.
Number of college students below state average.
Percentage of population with a bachelor's degree or higher below state average.
Estimated median house/condo value in 2022: $131,724
43988:
$131,724
Ohio:
$204,100
According to our research of Ohio and other state lists, there were 4 registered sex offenders living in 43988 zip code as of May 28, 2024. The ratio of all residents to sex offenders in zip code 43988 is 558 to 1. The ratio of registered sex offenders to all residents in this zip code is near the state average.
Median resident age:
This zip code:
39.9 years
Ohio median age:
39.9 years
Average household size:
This zip code:
2.5 people
Ohio:
2.4 people
Averages for the 2020 tax year for zip code 43988, filed in 2021:
Average Adjusted Gross Income (AGI) in 2020: $52,450 (Individual Income Tax Returns)
Here:
$52,450
State:
$67,288
Salary/wage: $43,731 (reported on 70.3% of returns)
Here:
$43,731
State:
$55,628
(% of AGI for various income ranges: 1086.5% for AGIs below $25k, 3253.5% for AGIs $25k-50k, 6662.0% for AGIs $50k-75k, 9964.0% for AGIs $75k-100k, 14855.7% for AGIs $100k-200k)
Taxable interest for individuals: $804 (reported on 24.8% of returns)
This zip code:
$804
Ohio:
$1,518
(% of AGI for various income ranges: 15.7% for AGIs below $25k, 12.5% for AGIs $25k-50k, 25.0% for AGIs $50k-75k, 118.0% for AGIs $75k-100k, 80.0% for AGIs $100k-200k)
Ordinary dividends: $3,117 (reported on 11.9% of returns)
Here:
$3,117
State:
$7,167
(% of AGI for various income ranges: 12.6% for AGIs below $25k, 51.5% for AGIs $25k-50k, 164.0% for AGIs $75k-100k, 228.6% for AGIs $100k-200k)
Net capital gain/loss in AGI: +$7,220 (reported on 9.9% of returns)
Here:
+$7,220
State:
+$18,919
(% of AGI for various income ranges: 43.0% for AGIs $25k-50k, 178.0% for AGIs $75k-100k, 781.4% for AGIs $100k-200k)
Profit/loss from business: +$16,688 (reported on 16.8% of returns)
Here:
+$16,688
State:
+$13,744
(% of AGI for various income ranges: 177.0% for AGIs below $25k, 417.5% for AGIs $25k-50k, 637.0% for AGIs $50k-75k, 1916.0% for AGIs $75k-100k)
Taxable individual retirement arrangement distribution: $10,862 (reported on 7.9% of returns)
43988:
$10,862
Ohio:
$18,876
(% of AGI for various income ranges: 180.0% for AGIs $25k-50k, 1018.0% for AGIs $75k-100k)
Earned income credit: $2,238 (reported on 15.8% of returns)
Here:
$2,238
State:
$2,304
(% of AGI for various income ranges: 99.1% for AGIs below $25k, 65.0% for AGIs $25k-50k)
Percentage of individuals using paid preparers for their 2020 taxes: 92.1%
Here:
92%
State:
94%
(% for various income ranges: 91.7% for AGIs below $25k, 92.9% for AGIs $25k-50k, 87.5% for AGIs $50k-75k, 100.0% for AGIs $75k-100k, 91.7% for AGIs $100k-200k)
Averages for the 2012 tax year for zip code 43988, filed in 2013:
Average Adjusted Gross Income (AGI) in 2012: $49,506 (Individual Income Tax Returns)
Here:
$49,506
State:
$54,926
Salary/wage: $35,148 (reported on 76.7% of returns)
Here:
$35,148
State:
$45,869
(% of AGI for various income ranges: 65.8% for AGIs below $25k, 71.9% for AGIs $25k-50k, 72.4% for AGIs $50k-75k, 68.6% for AGIs $75k-100k, 69.7% for AGIs $100k-200k)
Taxable interest for individuals: $518 (reported on 27.2% of returns)
This zip code:
$518
Ohio:
$1,297
(% of AGI for various income ranges: 0.4% for AGIs below $25k, 0.3% for AGIs $25k-50k, 0.3% for AGIs $50k-75k, 0.1% for AGIs $75k-100k, 0.6% for AGIs $100k-200k)
Ordinary dividends: $2,538 (reported on 12.6% of returns)
Here:
$2,538
State:
$5,821
(% of AGI for various income ranges: 0.6% for AGIs below $25k, 0.2% for AGIs $25k-50k, 0.5% for AGIs $50k-75k, 0.6% for AGIs $75k-100k, 2.3% for AGIs $100k-200k)
Net capital gain/loss in AGI: +$10,871 (reported on 13.6% of returns)
Here:
+$10,871
State:
+$11,232
(% of AGI for various income ranges: 1.8% for AGIs below $25k, 1.7% for AGIs $25k-50k, 3.7% for AGIs $50k-75k, 10.9% for AGIs $100k-200k)
Profit/loss from business: +$8,650 (reported on 15.5% of returns)
Here:
+$8,650
State:
+$12,773
(% of AGI for various income ranges: 13.0% for AGIs below $25k, 8.3% for AGIs $25k-50k)
Taxable individual retirement arrangement distribution: $8,843 (reported on 6.8% of returns)
43988:
$8,843
Ohio:
$14,511
(% of AGI for various income ranges: 1.5% for AGIs below $25k, 2.9% for AGIs $25k-50k, 3.7% for AGIs $75k-100k)
Total itemized deductions: $19,071 (15% of AGI, reported on 13.6% of returns)
Here:
$19,071
State:
$21,278
Here:
15.0% of AGI
State:
18.8% of AGI
(% of AGI for various income ranges: 5.9% for AGIs below $25k, 4.9% for AGIs $50k-75k, 6.6% for AGIs $75k-100k, 16.5% for AGIs $100k-200k)
Charity contributions: $5,312 (reported on 7.8% of returns)
Here:
$5,312
State:
$3,943
(% of AGI for various income ranges: 0.8% for AGIs $50k-75k, 4.1% for AGIs $100k-200k)
Taxes paid: $7,521 (reported on 13.6% of returns)
43988:
$7,521
State:
$9,568
(% of AGI for various income ranges: 1.3% for AGIs below $25k, 1.2% for AGIs $50k-75k, 2.0% for AGIs $75k-100k, 8.4% for AGIs $100k-200k)
Earned income credit: $1,942 (reported on 18.4% of returns)
Here:
$1,942
State:
$2,285
(% of AGI for various income ranges: 5.4% for AGIs below $25k, 0.9% for AGIs $25k-50k)
Percentage of individuals using paid preparers for their 2012 taxes: 63.1%
Here:
63%
State:
51%
(% for various income ranges: 56.8% for AGIs below $25k, 68.0% for AGIs $25k-50k, 66.7% for AGIs $50k-75k, 66.7% for AGIs $75k-100k, 71.4% for AGIs $100k-200k, 66.7% for AGIs over 200k)
Averages for the 2004 tax year for zip code 43988, filed in 2005:
Average Adjusted Gross Income (AGI) in 2004: $32,247 (Individual Income Tax Returns)
Here:
$32,247
State:
$44,480
Salary/wage: $30,413 (reported on 83.2% of returns)
Here:
$30,413
State:
$39,198
(% of AGI for various income ranges: 108.8% for AGIs below $10k, 79.1% for AGIs $10k-25k, 83.1% for AGIs $25k-50k, 83.5% for AGIs $50k-75k, 67.5% for AGIs $75k-100k, 63.4% for AGIs over 100k)
Taxable interest for individuals: $1,139 (reported on 36.9% of returns)
This zip code:
$1,139
Ohio:
$1,532
(% of AGI for various income ranges: 11.5% for AGIs below $10k, 1.7% for AGIs $10k-25k, 1.3% for AGIs $25k-50k, 0.5% for AGIs $50k-75k, 1.5% for AGIs $75k-100k, 0.5% for AGIs over 100k)
Taxable dividends: $1,506 (reported on 14.4% of returns)
Here:
$1,506
State:
$3,496
(% of AGI for various income ranges: 4.6% for AGIs below $10k, 0.3% for AGIs $10k-25k, 0.6% for AGIs $25k-50k, 0.7% for AGIs $50k-75k, 1.6% for AGIs $75k-100k)
Net capital gain/loss: +$6,376 (reported on 12.2% of returns)
Here:
+$6,376
State:
+$8,582
(% of AGI for various income ranges: -1.1% for AGIs below $10k, 0.3% for AGIs $10k-25k, 0.5% for AGIs $25k-50k, 2.8% for AGIs $50k-75k, 14.8% for AGIs $75k-100k)
Profit/loss from business: +$7,583 (reported on 13.2% of returns)
Here:
+$7,583
State:
+$10,813
(% of AGI for various income ranges: -13.4% for AGIs below $10k, 7.4% for AGIs $10k-25k, 4.2% for AGIs $25k-50k, 3.3% for AGIs $50k-75k)
IRA payment deduction: $2,647 (reported on 1.6% of returns)
43988:
$2,647
Ohio:
$2,794
Total itemized deductions: $13,645 (19% of AGI, reported on 12.9% of returns)
Here:
$13,645
State:
$17,503
Here:
19.2% of AGI
State:
20.8% of AGI
(% of AGI for various income ranges: 4.8% for AGIs $10k-25k, 3.9% for AGIs $25k-50k, 7.2% for AGIs $50k-75k, 7.1% for AGIs $75k-100k, 6.8% for AGIs over 100k)
Charity contributions deductions: $2,330 (3% of AGI, reported on 8.9% of returns)
Here:
$2,330
State:
$3,087
Here:
3.3% of AGI
State:
3.4% of AGI
(% of AGI for various income ranges: 0.4% for AGIs $10k-25k, 0.6% for AGIs $25k-50k, 0.6% for AGIs $50k-75k, 1.1% for AGIs $75k-100k, 0.8% for AGIs over 100k)
Total tax: $4,153 (reported on 72.1% of returns)
43988:
$4,153
State:
$6,781
(% of AGI for various income ranges: 2.6% for AGIs below $10k, 3.9% for AGIs $10k-25k, 6.6% for AGIs $25k-50k, 9.3% for AGIs $50k-75k, 10.9% for AGIs $75k-100k, 21.1% for AGIs over 100k)
Earned income credit: $1,589 (reported on 17.6% of returns)
Here:
$1,589
State:
$1,696
Percentage of individuals using paid preparers for their 2004 taxes: 65.1%
Here:
65%
State:
55%
(% for various income ranges: 53.1% for AGIs below $10k, 69.1% for AGIs $10k-25k, 68.9% for AGIs $25k-50k, 56.5% for AGIs $50k-75k, 80.4% for AGIs $75k-100k, 84.0% for AGIs over 100k)
Household received Food Stamps/SNAP in the past 12 months: 109 Household did not receive Food Stamps/SNAP in the past 12 months: 805
Women who had a birth in the past 12 months: 40 (39 now married, 1 unmarried) Women who did not have a birth in the past 12 months: 394 (245 now married, 148 unmarried)
Housing units in zip code 43988 with a mortgage: 343 (37 second mortgage, 38 both second mortgage and home equity loan) Median monthly owner costs for units with a mortgage: $905 Median monthly owner costs for units without a mortgage: $444
Residents with income below the poverty level in 2022:
This zip code:
12.9%
Whole state:
13.4%
Residents with income below 50% of the poverty level in 2022:
This zip code:
9.6%
Whole state:
7.0%
Median number of rooms in houses and condos:
Here:
5.6
State:
6.7
Median number of rooms in apartments:
Here:
4.5
State:
4.4
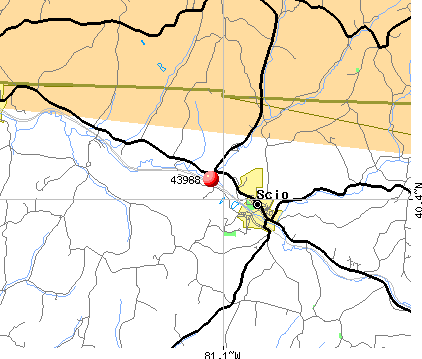
Notable locations in this zip code not listed on our city pages
Notable locations in zip code 43988: Camp Ecco (A), Perry Township Squad (B), Tappan Lake Volunteer Fire Department (C), Perry Township Fire Department (D), Scio Volunteer Fire Department (E). Display/hide their locations on the map
Churches in zip code 43988 include: Church of Christ (A), Mount Hope Church (B), Pleasant Valley Church (C), Perrysville United Methodist Church (D), Perrysville United Brethren Church (E). Display/hide their locations on the map
Cemeteries: New Perrysville Cemetery (1), Perrysville Cemetery (2), Abel Cemetery (3), Arabia Cemetery (4), Woodpecker Cemetery (5), Grandview Cemetery (6), Hanover Cemetery (7). Display/hide their locations on the map
Streams, rivers, and creeks: Long Creek (A), Kirby Run (B), Beaverdam Run (C), Dining Fork (D), Eddington Run (E), Leiper Run (F), Scott Run (G). Display/hide their locations on the map
Size of family households: 457 2-persons, 71 3-persons, 41 4-persons, 22 5-persons, 19 6-persons, 40 7-or-more-persons
Size of nonfamily households: 238 1-person, 26 2-persons
379 married couples with children.
46 single-parent households (14 men, 32 women).
84.2% of residents of 43988 zip code speak English at home.
17.3% of residents speak other Indo-European language at home (92% very well, 4% well, 3% not well).
Foreign born population: 13 (0.6%) (100.0% of them are naturalized citizens)
This zip code:
0.6%
Whole state:
5.0%
100%United Kingdom, excluding England and Scotland
92%Sweden
45%German
13%Irish
12%American
11%English
5%Dutch
4%Italian
2%Scottish
Year of entry for the foreign-born population
02010 or later
02000 to 2009
01990 to 1999
12Before 1990
Housing units lacking complete plumbing facilities: 4.2% Housing units lacking complete kitchen facilities: 5.8%
26.2%Utility gas
23.6%Electricity
17.8%Wood
16.5%Fuel oil, kerosene, etc.
12.2%Bottled, tank, or LP gas
4.1%Other fuel
Population in 1990: 2,640.
Place of birth for U.S.-born residents:
This state: 1,865
Northeast: 178
Midwest: 49
South: 188
West: 22
66% of the 43988 zip code residents lived in the same house 5 years ago. Out of people who lived in different houses, 44% lived in this county. Out of people who lived in different counties, 50% lived in Ohio.
91% of the 43988 zip code residents lived in the same house 1 year ago. Out of people who lived in different houses, 29% moved from this county. Out of people who lived in different houses, 56% moved from different county within same state. Out of people who lived in different houses, 19% moved from different state.
Private vs. public school enrollment:
Students in private schools in grades 1 to 8 (elementary and middle school): 109
Here:
47.6%
Ohio:
16.0%
Students in private schools in grades 9 to 12 (high school):
Here:
0.0%
Ohio:
13.1%
Students in private undergraduate colleges: 24
Here:
56.2%
Ohio:
22.3%
Occupation by median earnings in the past 12 months ($)
109,115Architecture and engineering occupations
81,331Material moving occupations
65,437Business and financial operations occupations
63,266Transportation occupations
49,631Management occupations
41,655Construction and extraction occupations
Top industries in this zip code by the number of employees in 2005:
Other Services (except Public Administration): Religious Organizations (1-4: 4)
Administrative and Support and Waste Management and Remediation Services: Landscaping Services (5-9: 1)
Arts, Entertainment, and Recreation: Marinas (5-9: 1)
Finance and Insurance: Commercial Banking (5-9: 1)
People in group quarters in 2010:
2 people in nursing facilities/skilled-nursing facilities
Fatal accident statistics in 2014:
Fatal accident count: 1
Vehicles involved in fatal accidents: 2
Fatal accidents caused by drunken drivers: 0
Fatalities: 2
Persons involved in fatal accidents: 3
Pedestrians involved in fatal accidents: 0
Fatal accident statistics in 2013:
Fatal accident count: 2
Vehicles involved in fatal accidents: 4
Fatal accidents caused by drunken drivers: 0
Fatalities: 2
Persons involved in fatal accidents: 4
Pedestrians involved in fatal accidents: 0
2002 - 2018 National Fire Incident Reporting System (NFIRS) incidents
Based on the data from the years 2002 - 2018 the average number of fire incidents per year is 28. The highest number of reported fires - 48 took place in 2009, and the least - 7 in 2018. The data has a declining trend.
When looking into fire subcategories, the most reports belonged to: Structure Fires (55.5%), and Outside Fires (30.0%).
Fire incident types reported to NFIRS in Zip Code 43988


 Nearest zip codes: 44695, 44693, 43986, 43903, 44675, 44615.


 Based on the data from the years 2002 - 2018 the average number of fire incidents per year is 28. The highest number of reported fires - 48 took place in 2009, and the least - 7 in 2018. The data has a declining trend.
 When looking into fire subcategories, the most reports belonged to: Structure Fires (55.5%), and Outside Fires (30.0%).