Estimated zip code population in 2022: 1,368 Zip code population in 2010: 1,608 Zip code population in 2000: 1,608
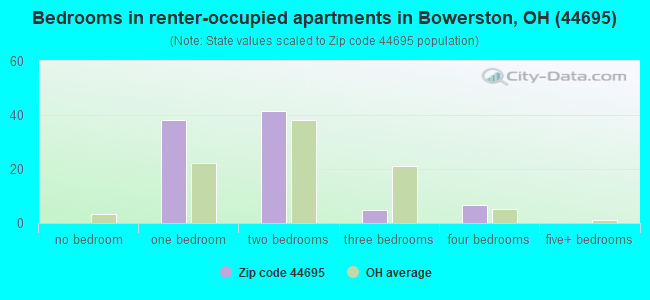
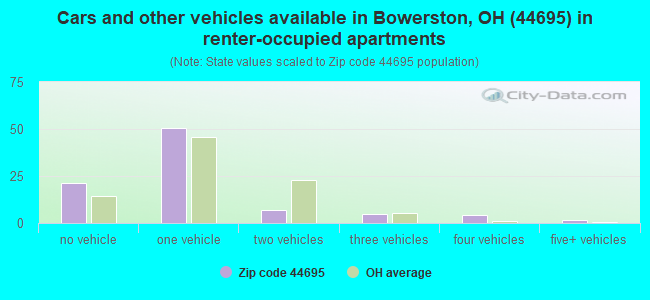
Houses and condos: 705 Renter-occupied apartments: 90
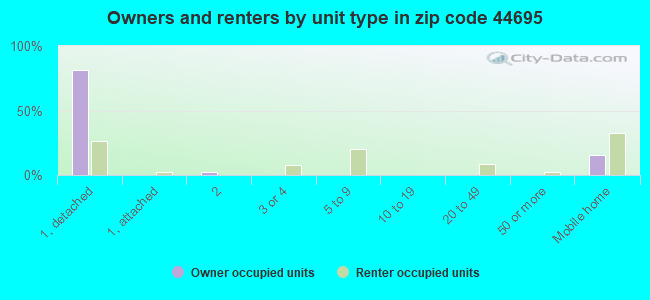
% of renters here:
17%
State:
33%
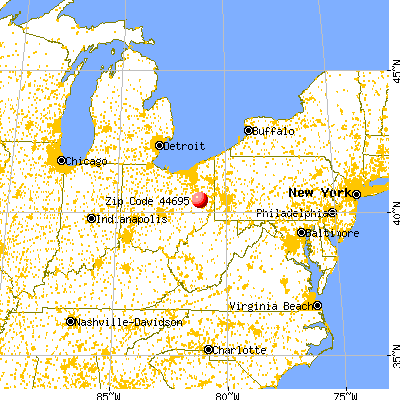
March 2022 cost of living index in zip code 44695: 81.4 (low, U.S. average is 100)
Land area: 30.1 sq. mi. Water area: 0.6 sq. mi.
Population density: 45 people per square mile
(very low).
OSM Map
General Map
Google Map
MSN Map
OSM Map
General Map
Google Map
MSN Map
OSM Map
General Map
Google Map
MSN Map
OSM Map
General Map
Google Map
MSN Map
Please wait while loading the map...
Real estate property taxes paid for housing units in 2022:
This zip code:
1.1% ($1,427)
Ohio:
1.3% ($2,639)
Median real estate property taxes paid for housing units with mortgages in 2022: $1,749 (1.8%) Median real estate property taxes paid for housing units with no mortgage in 2022: $1,286 (2.2%)
Business Search- 14 Million verified businesses
Males: 627
(45.8%)
Females: 741
(54.2%)
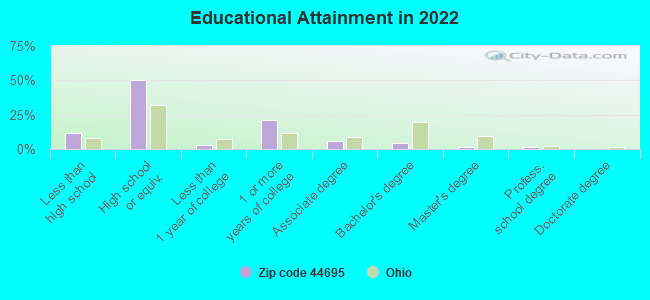
For population 25 years and over in 44695:
High school or higher: 85.7%
Bachelor's degree or higher: 7.5%
Graduate or professional degree: 2.8%
Unemployed: 7.5%
Mean travel time to work (commute): 25.2 minutes
For population 15 years and over in 44695:
Never married: 30.3%
Now married: 44.8%
Separated: 0.4%
Widowed: 5.3%
Divorced: 19.2%
Zip code 44695 compared to state average:
Median house value below state average.
Unemployed percentage above state average.
Black race population percentage significantly below state average.
Hispanic race population percentage significantly below state average.
Median age significantly above state average.
Foreign-born population percentage significantly below state average.
Renting percentage below state average.
Length of stay since moving in significantly above state average.
Percentage of population with a bachelor's degree or higher significantly below state average.
Averages for the 2020 tax year for zip code 44695, filed in 2021:
Average Adjusted Gross Income (AGI) in 2020: $51,790 (Individual Income Tax Returns)
Here:
$51,790
State:
$67,288
Salary/wage: $38,967 (reported on 81.7% of returns)
Here:
$38,967
State:
$55,628
(% of AGI for various income ranges: 1225.7% for AGIs below $25k, 3736.2% for AGIs $25k-50k, 6515.7% for AGIs $50k-75k, 8042.5% for AGIs $75k-100k, 15810.0% for AGIs $100k-200k)
Taxable interest for individuals: $725 (reported on 26.7% of returns)
This zip code:
$725
Ohio:
$1,518
(% of AGI for various income ranges: 7.9% for AGIs below $25k, 24.6% for AGIs $25k-50k, 8.6% for AGIs $50k-75k, 30.0% for AGIs $75k-100k, 183.3% for AGIs $100k-200k)
Ordinary dividends: $2,656 (reported on 15.0% of returns)
Here:
$2,656
State:
$7,167
(% of AGI for various income ranges: 11.4% for AGIs below $25k, 70.0% for AGIs $50k-75k, 580.0% for AGIs $100k-200k)
Net capital gain/loss in AGI: +$9,689 (reported on 15.0% of returns)
Here:
+$9,689
State:
+$18,919
(% of AGI for various income ranges: 22.1% for AGIs below $25k, 177.1% for AGIs $50k-75k, 2390.0% for AGIs $100k-200k)
Profit/loss from business: +$6,683 (reported on 10.0% of returns)
Here:
+$6,683
State:
+$13,744
(% of AGI for various income ranges: 72.1% for AGIs below $25k, 428.6% for AGIs $50k-75k)
Taxable individual retirement arrangement distribution: $11,580 (reported on 8.3% of returns)
44695:
$11,580
Ohio:
$18,876
(% of AGI for various income ranges: 106.4% for AGIs below $25k, 1075.0% for AGIs $75k-100k)
Earned income credit: $1,830 (reported on 16.7% of returns)
Here:
$1,830
State:
$2,304
(% of AGI for various income ranges: 72.1% for AGIs below $25k, 63.1% for AGIs $25k-50k)
Percentage of individuals using paid preparers for their 2020 taxes: 95.0%
Here:
95%
State:
94%
(% for various income ranges: 95.0% for AGIs below $25k, 94.1% for AGIs $25k-50k, 100.0% for AGIs $50k-75k, 100.0% for AGIs $75k-100k, 85.7% for AGIs $100k-200k)
Averages for the 2012 tax year for zip code 44695, filed in 2013:
Average Adjusted Gross Income (AGI) in 2012: $50,536 (Individual Income Tax Returns)
Here:
$50,536
State:
$54,926
Salary/wage: $35,667 (reported on 83.1% of returns)
Here:
$35,667
State:
$45,869
(% of AGI for various income ranges: 74.3% for AGIs below $25k, 76.5% for AGIs $25k-50k, 74.6% for AGIs $50k-75k, 77.2% for AGIs $75k-100k, 31.6% for AGIs $100k-200k)
Taxable interest for individuals: $442 (reported on 32.2% of returns)
This zip code:
$442
Ohio:
$1,297
(% of AGI for various income ranges: 0.5% for AGIs below $25k, 0.7% for AGIs $25k-50k, 0.2% for AGIs $50k-75k, 0.1% for AGIs $75k-100k, 0.2% for AGIs $100k-200k)
Ordinary dividends: $2,614 (reported on 11.9% of returns)
Here:
$2,614
State:
$5,821
(% of AGI for various income ranges: 1.1% for AGIs $25k-50k, 2.5% for AGIs $75k-100k)
Net capital gain/loss in AGI: +$17,183 (reported on 10.2% of returns)
Here:
+$17,183
State:
+$11,232
(% of AGI for various income ranges: 1.1% for AGIs $25k-50k, 20.2% for AGIs $75k-100k)
Profit/loss from business: +$7,757 (reported on 11.9% of returns)
Here:
+$7,757
State:
+$12,773
(% of AGI for various income ranges: 10.0% for AGIs below $25k, 5.5% for AGIs $50k-75k)
Taxable individual retirement arrangement distribution: $7,260 (reported on 8.5% of returns)
44695:
$7,260
Ohio:
$14,511
(% of AGI for various income ranges: 4.1% for AGIs below $25k, 5.0% for AGIs $50k-75k)
Total itemized deductions: $18,100 (17% of AGI, reported on 18.6% of returns)
Here:
$18,100
State:
$21,278
Here:
16.8% of AGI
State:
18.8% of AGI
(% of AGI for various income ranges: 11.3% for AGIs below $25k, 8.3% for AGIs $50k-75k, 7.4% for AGIs $75k-100k, 7.9% for AGIs $100k-200k)
Charity contributions: $3,017 (reported on 10.2% of returns)
Here:
$3,017
State:
$3,943
(% of AGI for various income ranges: 1.0% for AGIs $50k-75k, 1.1% for AGIs $100k-200k)
Taxes paid: $6,373 (reported on 18.6% of returns)
44695:
$6,373
State:
$9,568
(% of AGI for various income ranges: 2.1% for AGIs below $25k, 1.9% for AGIs $50k-75k, 2.4% for AGIs $75k-100k, 3.7% for AGIs $100k-200k)
Earned income credit: $1,525 (reported on 20.3% of returns)
Here:
$1,525
State:
$2,285
(% of AGI for various income ranges: 4.8% for AGIs below $25k, 1.0% for AGIs $25k-50k)
Percentage of individuals using paid preparers for their 2012 taxes: 62.7%
Here:
63%
State:
51%
(% for various income ranges: 54.5% for AGIs below $25k, 62.5% for AGIs $25k-50k, 66.7% for AGIs $50k-75k, 66.7% for AGIs $75k-100k, 83.3% for AGIs $100k-200k)
Averages for the 2004 tax year for zip code 44695, filed in 2005:
Average Adjusted Gross Income (AGI) in 2004: $31,450 (Individual Income Tax Returns)
Here:
$31,450
State:
$44,480
Salary/wage: $29,557 (reported on 86.9% of returns)
Here:
$29,557
State:
$39,198
(% of AGI for various income ranges: 90.7% for AGIs below $10k, 77.0% for AGIs $10k-25k, 84.1% for AGIs $25k-50k, 83.9% for AGIs $50k-75k, 74.2% for AGIs $75k-100k)
Taxable interest for individuals: $872 (reported on 39.7% of returns)
This zip code:
$872
Ohio:
$1,532
(% of AGI for various income ranges: 4.6% for AGIs below $10k, 1.8% for AGIs $10k-25k, 1.3% for AGIs $25k-50k, 0.4% for AGIs $50k-75k, 0.6% for AGIs $75k-100k)
Taxable dividends: $1,000 (reported on 17.5% of returns)
Here:
$1,000
State:
$3,496
(% of AGI for various income ranges: 4.3% for AGIs below $10k, 0.5% for AGIs $10k-25k, 0.4% for AGIs $25k-50k, 0.8% for AGIs $50k-75k)
Net capital gain/loss: +$1,627 (reported on 11.4% of returns)
Here:
+$1,627
State:
+$8,582
Profit/loss from business: +$7,050 (reported on 13.6% of returns)
Here:
+$7,050
State:
+$10,813
(% of AGI for various income ranges: 7.7% for AGIs below $10k, 3.9% for AGIs $10k-25k, 2.9% for AGIs $25k-50k, 4.1% for AGIs $50k-75k)
Total itemized deductions: $13,870 (26% of AGI, reported on 15.6% of returns)
Here:
$13,870
State:
$17,503
Here:
26.0% of AGI
State:
20.8% of AGI
(% of AGI for various income ranges: 3.9% for AGIs $10k-25k, 5.8% for AGIs $25k-50k, 9.2% for AGIs $50k-75k, 9.7% for AGIs $75k-100k)
Charity contributions deductions: $2,662 (5% of AGI, reported on 11.0% of returns)
Here:
$2,662
State:
$3,087
Here:
4.8% of AGI
State:
3.4% of AGI
Total tax: $2,977 (reported on 74.7% of returns)
44695:
$2,977
State:
$6,781
(% of AGI for various income ranges: 2.5% for AGIs below $10k, 3.7% for AGIs $10k-25k, 6.2% for AGIs $25k-50k, 8.3% for AGIs $50k-75k, 11.4% for AGIs $75k-100k)
Earned income credit: $1,533 (reported on 15.6% of returns)
Here:
$1,533
State:
$1,696
Percentage of individuals using paid preparers for their 2004 taxes: 66.2%
Here:
66%
State:
55%
(% for various income ranges: 55.2% for AGIs below $10k, 67.1% for AGIs $10k-25k, 68.6% for AGIs $25k-50k, 69.9% for AGIs $50k-75k, 73.3% for AGIs $75k-100k)
Household received Food Stamps/SNAP in the past 12 months: 65 Household did not receive Food Stamps/SNAP in the past 12 months: 454
Women who had a birth in the past 12 months: 24 (1 now married, 22 unmarried) Women who did not have a birth in the past 12 months: 316 (65 now married, 251 unmarried)
Housing units in zip code 44695 with a mortgage: 145 (5 second mortgage, 5 both second mortgage and home equity loan) Median monthly owner costs for units with a mortgage: $1,152 Median monthly owner costs for units without a mortgage: $424
Residents with income below the poverty level in 2022:
This zip code:
19.6%
Whole state:
13.4%
Residents with income below 50% of the poverty level in 2022:
This zip code:
9.2%
Whole state:
7.0%
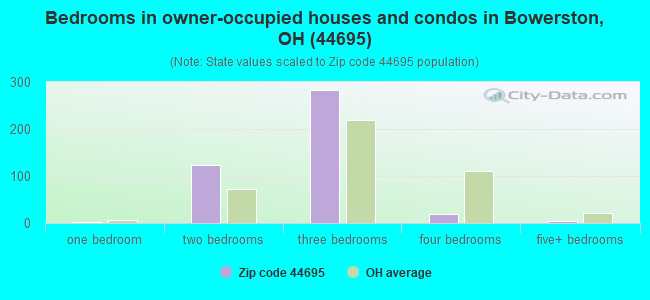
Median number of rooms in houses and condos:
Here:
6.2
State:
6.7
Median number of rooms in apartments:
Here:
4.3
State:
4.4
Notable locations in this zip code not listed on our city pages
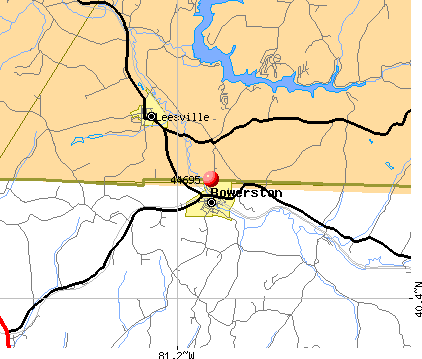
Notable locations in zip code 44695: Clows Marina (A), Firebird Camp (B), Leesville Volunteer Fire Department (C), Bowerston Volunteer Fire and Emergency Medical Services Department (D), Bowerston Public Library (E). Display/hide their locations on the map
Cemeteries: Price-Rollins Cemetery (1), Leavittsville Cemetery (2), Leesville Cemetery (3), New Hagerstown Cemetery (4), Bethel Cemetery (5), Mount Olive Cemetery (6), Longview Cemetery (7). Display/hide their locations on the map
In group quarters: 81 (-1 institutionalized population)
Size of family households: 167 2-persons, 47 3-persons, 83 4-persons, 4 5-persons, 16 6-persons
Size of nonfamily households: 157 1-person, 43 2-persons
73 married couples with children.
87 single-parent households (26 men, 61 women).
99.4% of residents of 44695 zip code speak English at home.
0.7% of residents speak Spanish at home (100% very well).
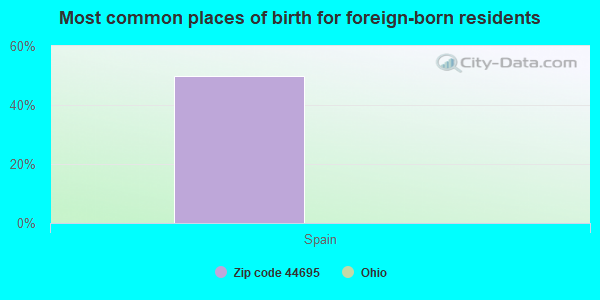
Foreign born population: 2 (0.2%) (100.0% of them are naturalized citizens)
This zip code:
0.2%
Whole state:
5.0%
50%Spain
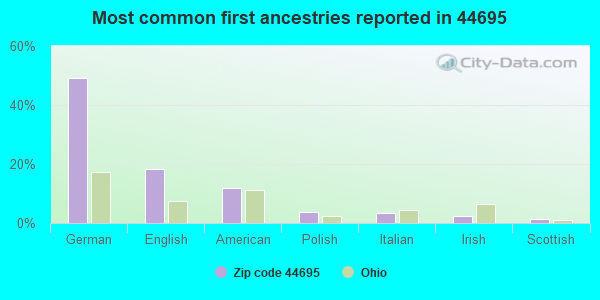
49%German
18%English
12%American
4%Polish
3%Italian
2%Irish
2%Scottish
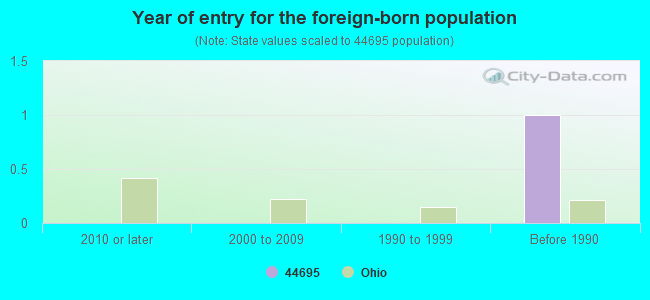
Year of entry for the foreign-born population
02010 or later
02000 to 2009
01990 to 1999
1Before 1990
Facilities with environmental interests located in this zip code:
BOWERSTON SHALE CO (MAIN ST in BOWERSTON, OH)
AIR SYNTHETIC MINOR (AIRS/AFS) STATE MASTER (Ohio general info) - AIR MAJOR, EPCRA, TRIS-44695BWRST515MA, TRI REPORTER STATE MASTER (Ohio general info) - -34-4813-861-1, EPCRA TRI REPORTER (Tracking of toxic chemicals releasing facilities) Business SIC classification: BRICK AND STRUCTURAL CLAY TILE Organizations: BOWERSTON SHALE COMPANY (CONTACT/OWNER)
Alternative names: BOWERSTON CO
BOWERSTON WATER AND WASTEWATER DEPT (STATE ROUTES 212 AND 151 in BOWERSTON, OH)
STATE MASTER (Ohio general info) - PCS-OH0041378, National Pollutant Discharge Elimination System Permit National Pollutant Discharge Elimination System NON-MAJOR (Tracking pollutant discharge elimination systems) - permit Business SIC classification: SEWERAGE SYSTEMS Organizations: VILLAGE OF BOWERSTON (CONTACT/OWNER)
Alternative names: BOWERSTON, VILLAGE OF, BOWERSTON WWTP, VILLAGE OF BOWERSTON
BOWERSTON ELEMENTARY SCHOOL (600 MAIN ST in BOWERSTON, OH)
(Geographic Names Information System) (National Center for Education Statistics) - STATE ID-003277 Organizations: CONOTTON VALLEY UNION LOCAL S (SCHOOL DISTRICT)
Housing units lacking complete plumbing facilities: 9.4% Housing units lacking complete kitchen facilities: 7.6%
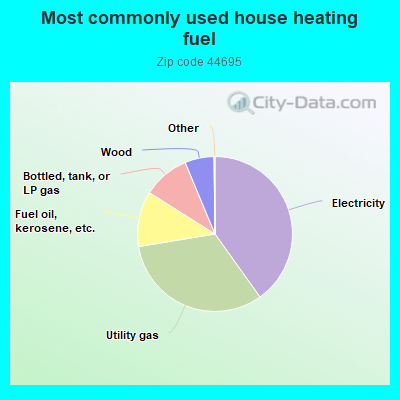
40.3%Electricity
32.4%Utility gas
11.6%Fuel oil, kerosene, etc.
9.8%Bottled, tank, or LP gas
6.1%Wood
Population in 1990: 1,484. Population change in the 1990s: +124 (+8.4%).
Place of birth for U.S.-born residents:
This state: 1,184
Northeast: 107
Midwest: 29
South: 34
West: 11
64% of the 44695 zip code residents lived in the same house 5 years ago. Out of people who lived in different houses, 37% lived in this county. Out of people who lived in different counties, 50% lived in Ohio.
94% of the 44695 zip code residents lived in the same house 1 year ago. Out of people who lived in different houses, 13% moved from this county. Out of people who lived in different houses, 85% moved from different county within same state. Out of people who lived in different houses, 11% moved from different state.
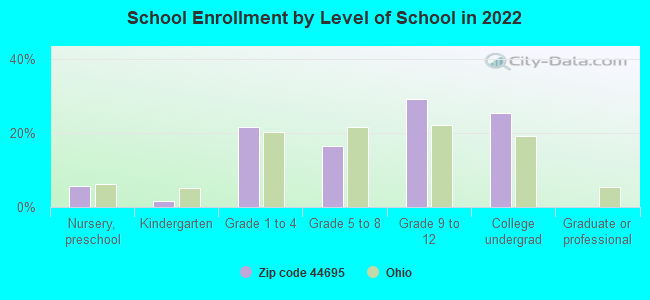
Private vs. public school enrollment:
Students in private schools in grades 1 to 8 (elementary and middle school): 5
Here:
6.1%
Ohio:
16.0%
Students in private schools in grades 9 to 12 (high school): 10
Here:
14.8%
Ohio:
13.1%
Students in private undergraduate colleges:
Here:
0.0%
Ohio:
22.3%
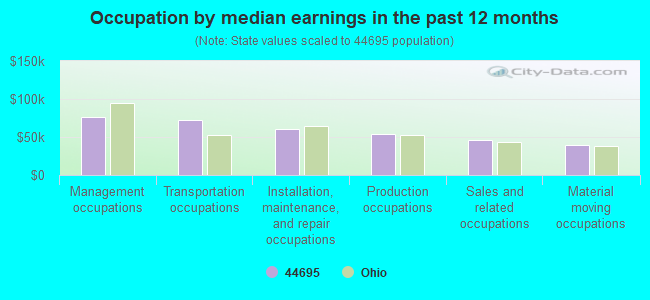
Occupation by median earnings in the past 12 months ($)
76,503Management occupations
71,772Transportation occupations
59,881Installation, maintenance, and repair occupations
53,551Production occupations
45,759Sales and related occupations
39,338Material moving occupations
Top industries in this zip code by the number of employees in 2005:
Health Care and Social Assistance: Nursing Care Facilities (50-99 employees: 1 establishment)
Management of Companies and Enterprises: Corporate, Subsidiary, and Regional Managing Offices (20-49: 1)
Construction: Land Subdivision (5-9: 1)
Construction: Oil and Gas Pipeline and Related Structures Construction (5-9: 1)
People in group quarters in 2010:
68 people in nursing facilities/skilled-nursing facilities
People in group quarters in 2000:
72 people in nursing homes
Fatal accident statistics in 2012:
Fatal accident count: 1
Vehicles involved in fatal accidents: 1
Fatal accidents caused by drunken drivers: 0
Fatalities: 1
Persons involved in fatal accidents: 1
Pedestrians involved in fatal accidents: 0
2002 - 2018 National Fire Incident Reporting System (NFIRS) incidents
According to the data from the years 2002 - 2018 the average number of fires per year is 19. The highest number of fire incidents - 36 took place in 2007, and the least - 4 in 2002. The data has a growing trend.
When looking into fire subcategories, the most incidents belonged to: Structure Fires (54.9%), and Outside Fires (33.3%).
Fire incident types reported to NFIRS in Zip Code 44695


 Nearest zip codes: 43988, 44675, 44621, 44693, 44620, 44615.


 According to the data from the years 2002 - 2018 the average number of fires per year is 19. The highest number of fire incidents - 36 took place in 2007, and the least - 4 in 2002. The data has a growing trend.
 When looking into fire subcategories, the most incidents belonged to: Structure Fires (54.9%), and Outside Fires (33.3%).