Estimated zip code population in 2022: 3,328 Zip code population in 2010: 3,277 Zip code population in 2000: 2,943
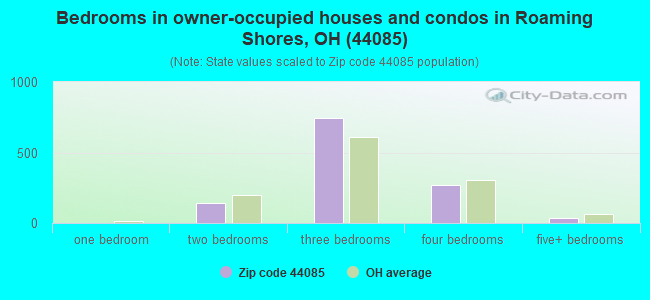
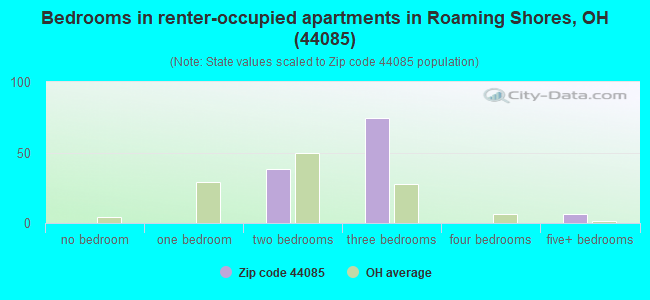
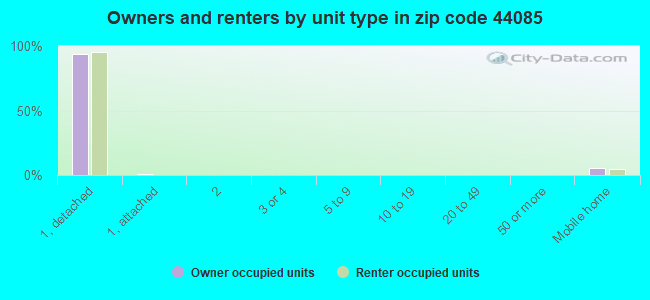
Houses and condos: 1,460 Renter-occupied apartments: 121
% of renters here:
9%
State:
33%
March 2022 cost of living index in zip code 44085: 85.4 (less than average, U.S. average is 100)
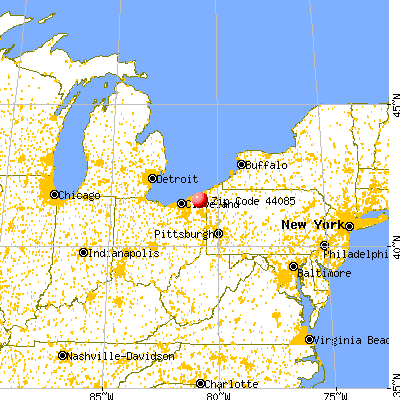
Land area: 50.4 sq. mi. Water area: 0.3 sq. mi.
Population density: 66 people per square mile
(very low).
OSM Map
General Map
Google Map
MSN Map
OSM Map
General Map
Google Map
MSN Map
OSM Map
General Map
Google Map
MSN Map
OSM Map
General Map
Google Map
MSN Map
Please wait while loading the map...
Real estate property taxes paid for housing units in 2022:
This zip code:
1.2% ($2,203)
Ohio:
1.3% ($2,639)
Median real estate property taxes paid for housing units with mortgages in 2022: $2,386 (1.2%) Median real estate property taxes paid for housing units with no mortgage in 2022: $1,499 (1.4%)
Business Search- 14 Million verified businesses
Males: 1,826
(54.9%)
Females: 1,502
(45.1%)
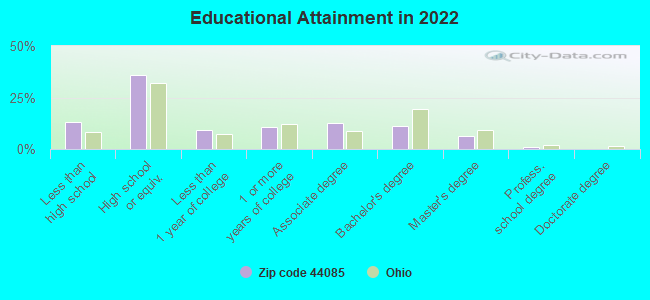
For population 25 years and over in 44085:
High school or higher: 85.4%
Bachelor's degree or higher: 18.0%
Graduate or professional degree: 7.0%
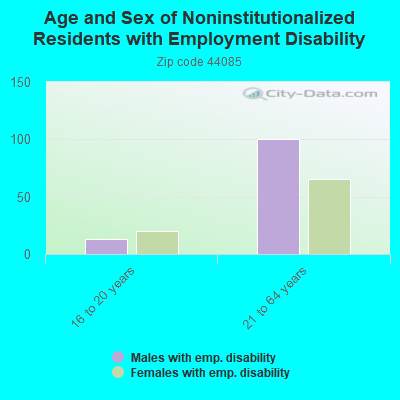
Unemployed: 2.0%
Mean travel time to work (commute): 31.8 minutes
For population 15 years and over in 44085:
Never married: 23.9%
Now married: 58.2%
Separated: 0.4%
Widowed: 4.6%
Divorced: 13.0%
Zip code 44085 compared to state average:
Unemployed percentage below state average.
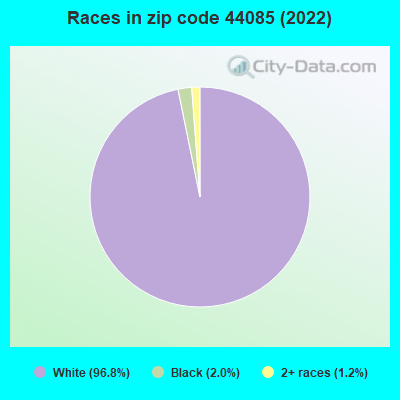
Black race population percentage significantly below state average.
Hispanic race population percentage significantly below state average.
Foreign-born population percentage significantly below state average.
Renting percentage significantly below state average.
Length of stay since moving in significantly above state average.
Percentage of population with a bachelor's degree or higher below state average.
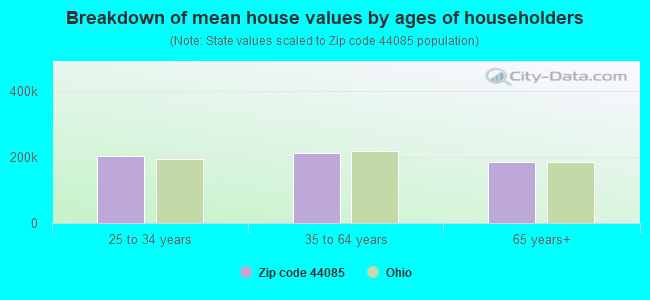
Estimated median house/condo value in 2022: $181,162
44085:
$181,162
Ohio:
$204,100
According to our research of Ohio and other state lists, there were 7 registered sex offenders living in 44085 zip code as of May 29, 2024. The ratio of all residents to sex offenders in zip code 44085 is 508 to 1. The ratio of registered sex offenders to all residents in this zip code is near the state average.
Median resident age:
This zip code:
42.0 years
Ohio median age:
39.9 years
Average household size:
This zip code:
2.5 people
Ohio:
2.4 people
Averages for the 2020 tax year for zip code 44085, filed in 2021:
Average Adjusted Gross Income (AGI) in 2020: $56,114 (Individual Income Tax Returns)
Here:
$56,114
State:
$67,288
Salary/wage: $49,790 (reported on 78.2% of returns)
Here:
$49,790
State:
$55,628
(% of AGI for various income ranges: 1184.4% for AGIs below $25k, 3760.6% for AGIs $25k-50k, 6716.2% for AGIs $50k-75k, 9284.5% for AGIs $75k-100k, 14662.7% for AGIs $100k-200k)
Taxable interest for individuals: $679 (reported on 22.4% of returns)
This zip code:
$679
Ohio:
$1,518
(% of AGI for various income ranges: 10.0% for AGIs below $25k, 13.4% for AGIs $25k-50k, 10.0% for AGIs $50k-75k, 17.3% for AGIs $75k-100k, 50.9% for AGIs $100k-200k)
Ordinary dividends: $2,514 (reported on 14.3% of returns)
Here:
$2,514
State:
$7,167
(% of AGI for various income ranges: 7.8% for AGIs below $25k, 33.1% for AGIs $25k-50k, 40.6% for AGIs $50k-75k, 18.2% for AGIs $75k-100k, 287.3% for AGIs $100k-200k)
Net capital gain/loss in AGI: +$4,588 (reported on 11.6% of returns)
Here:
+$4,588
State:
+$18,919
(% of AGI for various income ranges: 8.1% for AGIs below $25k, 24.1% for AGIs $25k-50k, 61.3% for AGIs $50k-75k, 29.1% for AGIs $75k-100k, 500.9% for AGIs $100k-200k)
Profit/loss from business: +$14,604 (reported on 18.4% of returns)
Here:
+$14,604
State:
+$13,744
(% of AGI for various income ranges: 296.3% for AGIs below $25k, 461.2% for AGIs $25k-50k, 392.5% for AGIs $50k-75k, 79.1% for AGIs $75k-100k, 865.5% for AGIs $100k-200k)
Taxable individual retirement arrangement distribution: $17,027 (reported on 7.5% of returns)
44085:
$17,027
Ohio:
$18,876
(% of AGI for various income ranges: 80.4% for AGIs below $25k, 89.1% for AGIs $25k-50k, 371.2% for AGIs $50k-75k, 706.4% for AGIs $100k-200k)
Total itemized deductions: $24,120 (reported on 3.4% of returns)
Here:
$24,120
State:
$33,869
(% of AGI for various income ranges: 166.2% for AGIs $25k-50k, 612.7% for AGIs $75k-100k)
Charity contributions: $5,133 (reported on 2.0% of returns)
Here:
$5,133
State:
$14,577
(% of AGI for various income ranges: 96.2% for AGIs $50k-75k)
Taxes paid: $5,980 (reported on 3.4% of returns)
44085:
$5,980
State:
$7,681
(% of AGI for various income ranges: 41.2% for AGIs $25k-50k, 151.8% for AGIs $100k-200k)
Earned income credit: $2,252 (reported on 14.3% of returns)
Here:
$2,252
State:
$2,304
(% of AGI for various income ranges: 100.7% for AGIs below $25k, 62.8% for AGIs $25k-50k)
Percentage of individuals using paid preparers for their 2020 taxes: 93.2%
Here:
93%
State:
94%
(% for various income ranges: 92.9% for AGIs below $25k, 93.2% for AGIs $25k-50k, 91.7% for AGIs $50k-75k, 94.1% for AGIs $75k-100k, 94.1% for AGIs $100k-200k, 100.0% for AGIs over 200k)
Averages for the 2012 tax year for zip code 44085, filed in 2013:
Average Adjusted Gross Income (AGI) in 2012: $44,840 (Individual Income Tax Returns)
Here:
$44,840
State:
$54,926
Salary/wage: $41,218 (reported on 84.2% of returns)
Here:
$41,218
State:
$45,869
(% of AGI for various income ranges: 73.3% for AGIs below $25k, 79.1% for AGIs $25k-50k, 87.0% for AGIs $50k-75k, 79.5% for AGIs $75k-100k, 67.1% for AGIs $100k-200k)
Taxable interest for individuals: $491 (reported on 23.7% of returns)
This zip code:
$491
Ohio:
$1,297
(% of AGI for various income ranges: 0.7% for AGIs below $25k, 0.2% for AGIs $25k-50k, 0.2% for AGIs $50k-75k, 0.3% for AGIs $75k-100k, 0.2% for AGIs $100k-200k)
Ordinary dividends: $1,895 (reported on 15.1% of returns)
Here:
$1,895
State:
$5,821
(% of AGI for various income ranges: 0.8% for AGIs below $25k, 0.6% for AGIs $25k-50k, 0.8% for AGIs $50k-75k, 1.1% for AGIs $75k-100k, 0.2% for AGIs $100k-200k)
Net capital gain/loss in AGI: +$3,585 (reported on 9.4% of returns)
Here:
+$3,585
State:
+$11,232
(% of AGI for various income ranges: 0.3% for AGIs below $25k, 0.1% for AGIs $75k-100k, 2.6% for AGIs $100k-200k)
Profit/loss from business: +$7,629 (reported on 17.3% of returns)
Here:
+$7,629
State:
+$12,773
(% of AGI for various income ranges: 12.1% for AGIs below $25k, 4.1% for AGIs $25k-50k, 1.9% for AGIs $50k-75k, 1.8% for AGIs $75k-100k)
Taxable individual retirement arrangement distribution: $13,870 (reported on 7.2% of returns)
44085:
$13,870
Ohio:
$14,511
(% of AGI for various income ranges: 2.3% for AGIs below $25k, 2.8% for AGIs $25k-50k, 8.1% for AGIs $75k-100k)
Total itemized deductions: $16,350 (22% of AGI, reported on 27.3% of returns)
Here:
$16,350
State:
$21,278
Here:
21.5% of AGI
State:
18.8% of AGI
(% of AGI for various income ranges: 6.6% for AGIs below $25k, 8.7% for AGIs $25k-50k, 10.6% for AGIs $50k-75k, 11.2% for AGIs $75k-100k, 11.1% for AGIs $100k-200k)
Charity contributions: $2,291 (reported on 16.5% of returns)
Here:
$2,291
State:
$3,943
(% of AGI for various income ranges: 0.6% for AGIs $25k-50k, 0.6% for AGIs $50k-75k, 1.8% for AGIs $75k-100k, 1.0% for AGIs $100k-200k)
Taxes paid: $5,582 (reported on 27.3% of returns)
44085:
$5,582
State:
$9,568
(% of AGI for various income ranges: 1.7% for AGIs below $25k, 2.2% for AGIs $25k-50k, 3.1% for AGIs $50k-75k, 3.8% for AGIs $75k-100k, 5.3% for AGIs $100k-200k)
Earned income credit: $2,186 (reported on 15.1% of returns)
Here:
$2,186
State:
$2,285
(% of AGI for various income ranges: 5.4% for AGIs below $25k, 0.8% for AGIs $25k-50k)
Percentage of individuals using paid preparers for their 2012 taxes: 53.2%
Here:
53%
State:
51%
(% for various income ranges: 44.2% for AGIs below $25k, 57.5% for AGIs $25k-50k, 58.3% for AGIs $50k-75k, 58.3% for AGIs $75k-100k, 63.6% for AGIs $100k-200k)
Averages for the 2004 tax year for zip code 44085, filed in 2005:
Average Adjusted Gross Income (AGI) in 2004: $35,811 (Individual Income Tax Returns)
Here:
$35,811
State:
$44,480
Salary/wage: $34,504 (reported on 86.1% of returns)
Here:
$34,504
State:
$39,198
(% of AGI for various income ranges: 103.9% for AGIs below $10k, 73.7% for AGIs $10k-25k, 86.2% for AGIs $25k-50k, 86.8% for AGIs $50k-75k, 89.3% for AGIs $75k-100k, 63.2% for AGIs over 100k)
Taxable interest for individuals: $935 (reported on 39.0% of returns)
This zip code:
$935
Ohio:
$1,532
(% of AGI for various income ranges: 4.0% for AGIs below $10k, 1.5% for AGIs $10k-25k, 1.2% for AGIs $25k-50k, 0.3% for AGIs $50k-75k, 0.5% for AGIs $75k-100k, 1.8% for AGIs over 100k)
Taxable dividends: $811 (reported on 16.8% of returns)
Here:
$811
State:
$3,496
(% of AGI for various income ranges: 1.3% for AGIs below $10k, 0.6% for AGIs $10k-25k, 0.4% for AGIs $25k-50k, 0.2% for AGIs $50k-75k, 0.2% for AGIs $75k-100k, 0.7% for AGIs over 100k)
Net capital gain/loss: +$4,077 (reported on 11.9% of returns)
Here:
+$4,077
State:
+$8,582
(% of AGI for various income ranges: -1.0% for AGIs below $10k, 1.7% for AGIs $10k-25k, 1.0% for AGIs $25k-50k, 0.2% for AGIs $50k-75k, 0.3% for AGIs $75k-100k, 6.1% for AGIs over 100k)
Profit/loss from business: +$6,227 (reported on 18.6% of returns)
Here:
+$6,227
State:
+$10,813
(% of AGI for various income ranges: 14.7% for AGIs below $10k, 10.6% for AGIs $10k-25k, 2.7% for AGIs $25k-50k, 3.0% for AGIs $50k-75k, 0.5% for AGIs $75k-100k)
IRA payment deduction: $2,278 (reported on 1.3% of returns)
44085:
$2,278
Ohio:
$2,794
Total itemized deductions: $13,074 (24% of AGI, reported on 35.4% of returns)
Here:
$13,074
State:
$17,503
Here:
23.7% of AGI
State:
20.8% of AGI
(% of AGI for various income ranges: 12.4% for AGIs below $10k, 11.3% for AGIs $10k-25k, 12.2% for AGIs $25k-50k, 14.7% for AGIs $50k-75k, 14.8% for AGIs $75k-100k, 10.7% for AGIs over 100k)
Charity contributions deductions: $1,485 (3% of AGI, reported on 25.0% of returns)
Here:
$1,485
State:
$3,087
Here:
2.6% of AGI
State:
3.4% of AGI
(% of AGI for various income ranges: 1.1% for AGIs $10k-25k, 0.9% for AGIs $25k-50k, 1.0% for AGIs $50k-75k, 1.2% for AGIs $75k-100k, 1.4% for AGIs over 100k)
Total tax: $4,036 (reported on 77.7% of returns)
44085:
$4,036
State:
$6,781
(% of AGI for various income ranges: 4.1% for AGIs below $10k, 4.9% for AGIs $10k-25k, 6.9% for AGIs $25k-50k, 8.2% for AGIs $50k-75k, 10.2% for AGIs $75k-100k, 17.9% for AGIs over 100k)
Earned income credit: $1,468 (reported on 13.1% of returns)
Here:
$1,468
State:
$1,696
Percentage of individuals using paid preparers for their 2004 taxes: 61.1%
Here:
61%
State:
55%
(% for various income ranges: 51.3% for AGIs below $10k, 60.9% for AGIs $10k-25k, 65.3% for AGIs $25k-50k, 62.6% for AGIs $50k-75k, 62.2% for AGIs $75k-100k, 71.8% for AGIs over 100k)
Household received Food Stamps/SNAP in the past 12 months: 56 Household did not receive Food Stamps/SNAP in the past 12 months: 1,255
Women who had a birth in the past 12 months: 21 (22 now married, 0 unmarried) Women who did not have a birth in the past 12 months: 636 (360 now married, 275 unmarried)
Housing units in zip code 44085 with a mortgage: 748 (145 second mortgage, 48 home equity loan, 101 both second mortgage and home equity loan) Houses without a mortgage: 64
Median monthly owner costs for units with a mortgage: $1,228 Median monthly owner costs for units without a mortgage: $393
Residents with income below the poverty level in 2022:
This zip code:
8.8%
Whole state:
13.4%
Residents with income below 50% of the poverty level in 2022:
This zip code:
5.5%
Whole state:
7.0%
Median number of rooms in houses and condos:
Here:
6.8
State:
6.7
Median number of rooms in apartments:
Here:
6.8
State:
4.4
Notable locations in this zip code not listed on our city pages
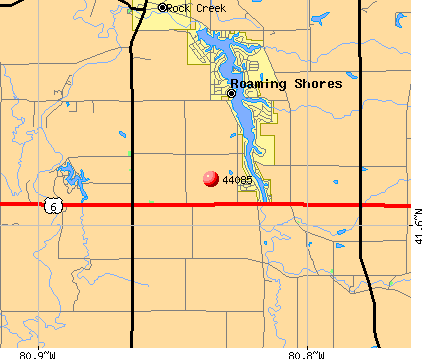
Notable locations in zip code 44085: Rome Station (A), Maple Lane Farm (B), Ashtabula County South Central Ambulance District (C), Hartsgrove Volunteer Fire Department (D), Rome Volunteer Fire Department (E). Display/hide their locations on the map
Size of family households: 470 2-persons, 183 3-persons, 129 4-persons, 78 5-persons, 25 6-persons, 21 7-or-more-persons
Size of nonfamily households: 297 1-person, 107 2-persons
545 married couples with children.
216 single-parent households (63 men, 153 women).
98.3% of residents of 44085 zip code speak English at home.
1.7% of residents speak other Indo-European language at home (31% very well, 69% well).
Foreign born population: 0 (0.0%)
:
0.0%
Whole state:
5.0%
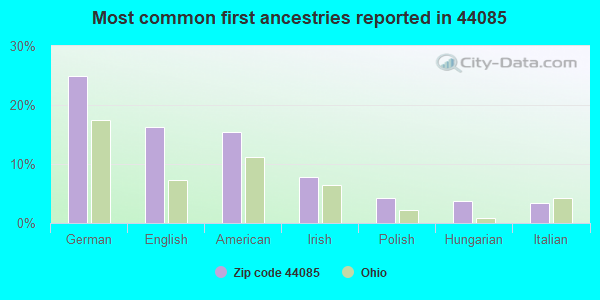
25%German
16%English
15%American
8%Irish
4%Polish
4%Hungarian
3%Italian
Housing units lacking complete plumbing facilities: 0.8% Housing units lacking complete kitchen facilities: 0.7%
24.8%Utility gas
21.4%Bottled, tank, or LP gas
21.4%Wood
19.9%Electricity
10.5%Fuel oil, kerosene, etc.
2.1%Other fuel
Population in 1990: 1,810. Population change in the 1990s: +1,133 (+62.6%).
Place of birth for U.S.-born residents:
This state: 2,693
Northeast: 228
Midwest: 50
South: 321
West: 28
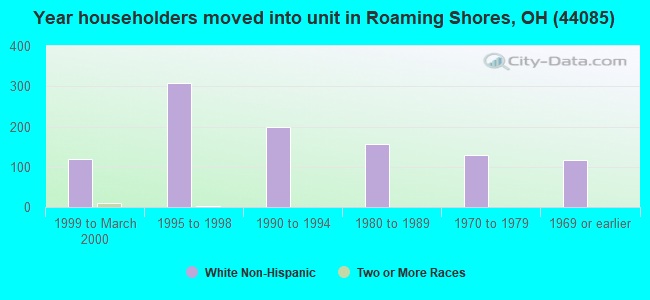
64% of the 44085 zip code residents lived in the same house 5 years ago. Out of people who lived in different houses, 36% lived in this county. Out of people who lived in different counties, 50% lived in Ohio.
91% of the 44085 zip code residents lived in the same house 1 year ago. Out of people who lived in different houses, 46% moved from this county. Out of people who lived in different houses, 25% moved from different county within same state. Out of people who lived in different houses, 29% moved from different state.
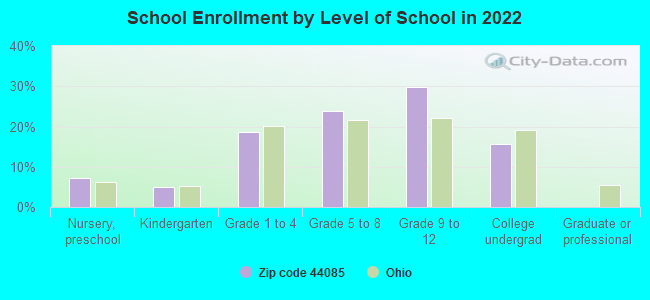
Private vs. public school enrollment:
Students in private schools in grades 1 to 8 (elementary and middle school): 41
Here:
12.8%
Ohio:
16.0%
Students in private schools in grades 9 to 12 (high school): 26
Here:
11.6%
Ohio:
13.1%
Students in private undergraduate colleges:
Here:
0.0%
Ohio:
22.3%
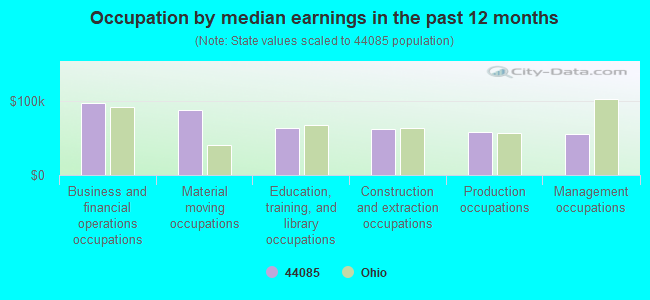
Occupation by median earnings in the past 12 months ($)
96,929Business and financial operations occupations
86,925Material moving occupations
62,800Education, training, and library occupations
61,362Construction and extraction occupations
57,557Production occupations
55,033Management occupations
Top industries in this zip code by the number of employees in 2005:
Administrative and Support and Waste Management and Remediation Services: Janitorial Services (5-9: 1, 1-4: 1)
Other Services (except Public Administration): Other Similar Organizations (except Business, Professional, Labor, and Political Organizations) (5-9: 1, 1-4: 1)
Arts, Entertainment, and Recreation: All Other Amusement and Recreation Industries (5-9: 1)
Other Services (except Public Administration): General Automotive Repair (5-9: 1)
Fatal accident statistics in 2014:
Fatal accident count: 2
Vehicles involved in fatal accidents: 2
Fatal accidents caused by drunken drivers: 1
Fatalities: 2
Persons involved in fatal accidents: 2
Pedestrians involved in fatal accidents: 0
Fatal accident statistics in 2013:
Fatal accident count: 3
Vehicles involved in fatal accidents: 4
Fatal accidents caused by drunken drivers: 0
Fatalities: 3
Persons involved in fatal accidents: 6
Pedestrians involved in fatal accidents: 0
Home Mortgage Disclosure Act Aggregated Statistics For Year 2003 (Based on 4 partial tracts)
A) FHA, FSA/RHS & VA Home Purchase Loans
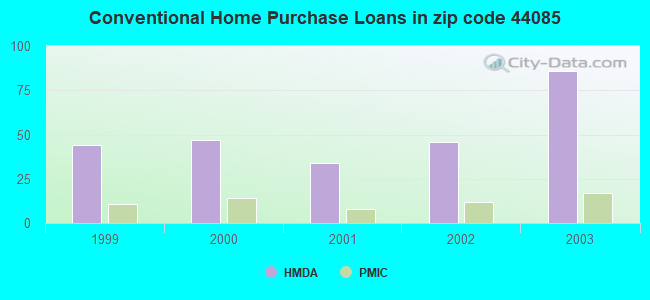
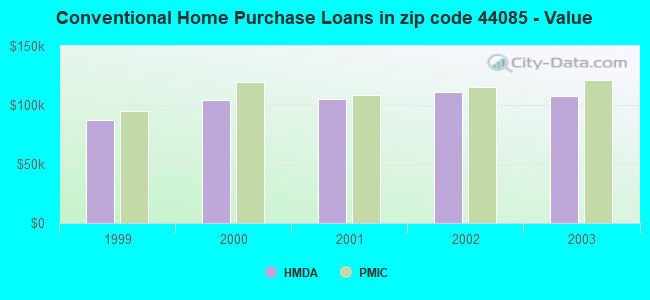
B) Conventional Home Purchase Loans
C) Refinancings
D) Home Improvement Loans
F) Non-occupant Loans on < 5 Family Dwellings (A B C & D)
Number
Average Value
Number
Average Value
Number
Average Value
Number
Average Value
Number
Average Value
LOANS ORIGINATED
11
$120,004
86
$107,492
325
$104,842
31
$26,276
21
$103,766
APPLICATIONS APPROVED, NOT ACCEPTED
1
$74,150
12
$108,187
60
$111,218
7
$21,116
4
$97,205
APPLICATIONS DENIED
4
$110,308
18
$101,119
145
$113,171
25
$19,855
5
$140,346
APPLICATIONS WITHDRAWN
4
$131,160
9
$116,924
107
$111,315
5
$27,318
3
$129,410
FILES CLOSED FOR INCOMPLETENESS
0
$0
6
$110,243
20
$130,268
1
$17,460
0
$0
Aggregated Statistics For Year 2002 (Based on 2 partial tracts)
A) FHA, FSA/RHS & VA Home Purchase Loans
B) Conventional Home Purchase Loans
C) Refinancings
D) Home Improvement Loans
F) Non-occupant Loans on < 5 Family Dwellings (A B C & D)
Number
Average Value
Number
Average Value
Number
Average Value
Number
Average Value
Number
Average Value
LOANS ORIGINATED
6
$110,222
46
$111,264
143
$101,776
18
$25,106
12
$116,342
APPLICATIONS APPROVED, NOT ACCEPTED
0
$0
2
$109,990
42
$101,279
2
$28,990
0
$0
APPLICATIONS DENIED
1
$76,250
11
$55,873
79
$107,813
6
$12,708
2
$80,645
APPLICATIONS WITHDRAWN
1
$107,180
6
$93,122
45
$108,450
1
$20,030
3
$120,063
FILES CLOSED FOR INCOMPLETENESS
0
$0
2
$58,330
9
$117,211
0
$0
0
$0
Aggregated Statistics For Year 2001 (Based on 2 partial tracts)
A) FHA, FSA/RHS & VA Home Purchase Loans
B) Conventional Home Purchase Loans
C) Refinancings
D) Home Improvement Loans
F) Non-occupant Loans on < 5 Family Dwellings (A B C & D)
Number
Average Value
Number
Average Value
Number
Average Value
Number
Average Value
Number
Average Value
LOANS ORIGINATED
10
$105,350
34
$105,430
139
$98,273
20
$24,563
9
$98,978
APPLICATIONS APPROVED, NOT ACCEPTED
0
$0
4
$66,765
23
$88,110
3
$37,013
1
$87,850
APPLICATIONS DENIED
0
$0
12
$66,971
61
$94,198
12
$15,110
1
$52,360
APPLICATIONS WITHDRAWN
0
$0
4
$94,790
40
$103,619
4
$15,900
2
$83,280
FILES CLOSED FOR INCOMPLETENESS
0
$0
0
$0
7
$120,931
1
$10,540
0
$0
Aggregated Statistics For Year 2000 (Based on 2 partial tracts)
A) FHA, FSA/RHS & VA Home Purchase Loans
B) Conventional Home Purchase Loans
C) Refinancings
D) Home Improvement Loans
F) Non-occupant Loans on < 5 Family Dwellings (A B C & D)
Number
Average Value
Number
Average Value
Number
Average Value
Number
Average Value
Number
Average Value
LOANS ORIGINATED
7
$115,209
47
$104,388
57
$77,308
26
$20,084
7
$84,787
APPLICATIONS APPROVED, NOT ACCEPTED
0
$0
4
$96,460
18
$86,015
8
$33,339
0
$0
APPLICATIONS DENIED
0
$0
9
$65,751
46
$92,151
12
$22,812
1
$76,960
APPLICATIONS WITHDRAWN
0
$0
2
$119,650
18
$87,850
3
$31,743
0
$0
FILES CLOSED FOR INCOMPLETENESS
0
$0
1
$53,760
3
$115,843
1
$17,570
0
$0
Aggregated Statistics For Year 1999 (Based on 2 partial tracts)
A) FHA, FSA/RHS & VA Home Purchase Loans
B) Conventional Home Purchase Loans
C) Refinancings
D) Home Improvement Loans
F) Non-occupant Loans on < 5 Family Dwellings (A B C & D)
Detailed PMIC statistics for the following Tracts:0010.00
, 0014.00
2002 - 2018 National Fire Incident Reporting System (NFIRS) incidents
According to the data from the years 2002 - 2018 the average number of fires per year is 49. The highest number of reported fire incidents - 83 took place in 2010, and the least - 16 in 2002. The data has a growing trend.
When looking into fire subcategories, the most reports belonged to: Structure Fires (47.9%), and Outside Fires (38.5%).
Fire incident types reported to NFIRS in Zip Code 44085


 Nearest zip codes: 44084, 44076, 44099, 44064, 44450, 44010.


 According to the data from the years 2002 - 2018 the average number of fires per year is 49. The highest number of reported fire incidents - 83 took place in 2010, and the least - 16 in 2002. The data has a growing trend.
 When looking into fire subcategories, the most reports belonged to: Structure Fires (47.9%), and Outside Fires (38.5%).