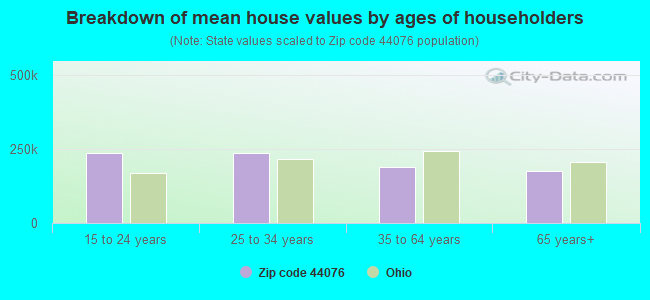
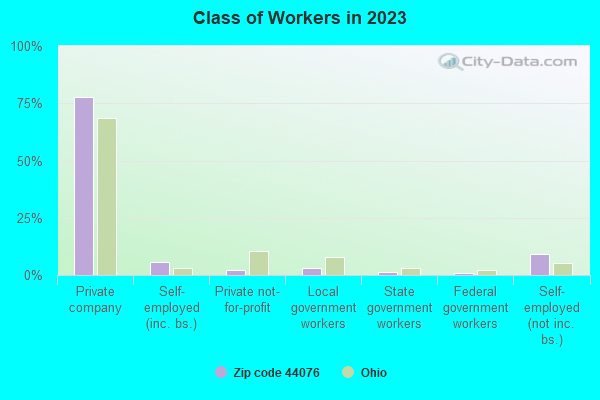
Estimated zip code population in 2022: 4,741 Zip code population in 2010: 5,141 Zip code population in 2000: 4,519
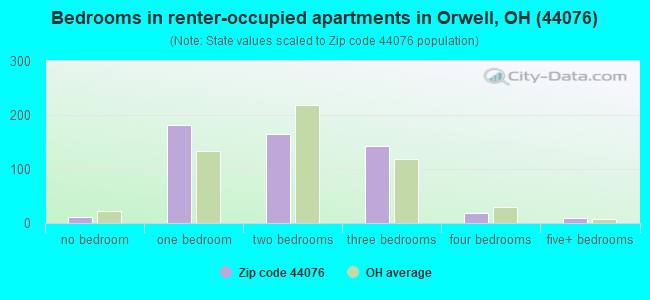
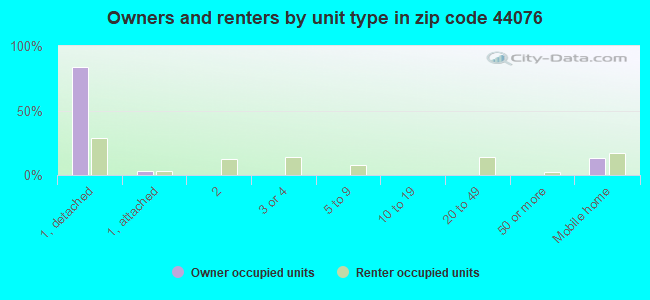
Houses and condos: 1,962 Renter-occupied apartments: 432
% of renters here:
24%
State:
33%
March 2022 cost of living index in zip code 44076: 85.1 (less than average, U.S. average is 100)
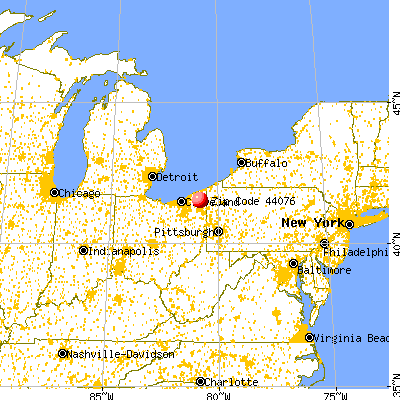
Land area: 68.7 sq. mi. Water area: 0.1 sq. mi.
Population density: 69 people per square mile
(very low).
OSM Map
General Map
Google Map
MSN Map
OSM Map
General Map
Google Map
MSN Map
OSM Map
General Map
Google Map
MSN Map
OSM Map
General Map
Google Map
MSN Map
Please wait while loading the map...
Real estate property taxes paid for housing units in 2022:
This zip code:
1.1% ($1,803)
Ohio:
1.3% ($2,639)
Median real estate property taxes paid for housing units with mortgages in 2022: $1,885 (1.1%) Median real estate property taxes paid for housing units with no mortgage in 2022: $1,675 (1.1%)
Averages for the 2020 tax year for zip code 44076, filed in 2021:
Average Adjusted Gross Income (AGI) in 2020: $47,171 (Individual Income Tax Returns)
Here:
$47,171
State:
$67,288
Salary/wage: $38,891 (reported on 74.8% of returns)
Here:
$38,891
State:
$55,628
(% of AGI for various income ranges: 1212.2% for AGIs below $25k, 3725.2% for AGIs $25k-50k, 6790.0% for AGIs $50k-75k, 9657.5% for AGIs $75k-100k, 16344.4% for AGIs $100k-200k)
Taxable interest for individuals: $649 (reported on 22.6% of returns)
This zip code:
$649
Ohio:
$1,518
(% of AGI for various income ranges: 12.8% for AGIs below $25k, 21.4% for AGIs $25k-50k, 22.4% for AGIs $50k-75k, 22.5% for AGIs $75k-100k, 100.0% for AGIs $100k-200k)
Ordinary dividends: $3,235 (reported on 10.2% of returns)
Here:
$3,235
State:
$7,167
(% of AGI for various income ranges: 23.2% for AGIs below $25k, 19.3% for AGIs $25k-50k, 44.8% for AGIs $50k-75k, 27.5% for AGIs $75k-100k, 442.2% for AGIs $100k-200k)
Net capital gain/loss in AGI: +$6,857 (reported on 10.2% of returns)
Here:
+$6,857
State:
+$18,919
(% of AGI for various income ranges: 11.2% for AGIs below $25k, 26.4% for AGIs $25k-50k, 164.0% for AGIs $50k-75k, 297.5% for AGIs $75k-100k, 708.9% for AGIs $100k-200k)
Profit/loss from business: +$26,559 (reported on 25.7% of returns)
Here:
+$26,559
State:
+$13,744
(% of AGI for various income ranges: 272.2% for AGIs below $25k, 953.4% for AGIs $25k-50k, 1550.0% for AGIs $50k-75k, 1511.7% for AGIs $75k-100k, 4621.1% for AGIs $100k-200k)
Taxable individual retirement arrangement distribution: $13,341 (reported on 7.5% of returns)
44076:
$13,341
Ohio:
$18,876
(% of AGI for various income ranges: 61.6% for AGIs below $25k, 85.7% for AGIs $25k-50k, 324.0% for AGIs $50k-75k, 858.9% for AGIs $100k-200k)
Earned income credit: $2,078 (reported on 16.4% of returns)
Here:
$2,078
State:
$2,304
(% of AGI for various income ranges: 94.2% for AGIs below $25k, 67.7% for AGIs $25k-50k)
Percentage of individuals using paid preparers for their 2020 taxes: 94.7%
Here:
95%
State:
94%
(% for various income ranges: 93.5% for AGIs below $25k, 94.0% for AGIs $25k-50k, 95.3% for AGIs $50k-75k, 100.0% for AGIs $75k-100k, 95.0% for AGIs $100k-200k)
Averages for the 2012 tax year for zip code 44076, filed in 2013:
Average Adjusted Gross Income (AGI) in 2012: $46,975 (Individual Income Tax Returns)
Here:
$46,975
State:
$54,926
Salary/wage: $34,152 (reported on 77.6% of returns)
Here:
$34,152
State:
$45,869
(% of AGI for various income ranges: 66.3% for AGIs below $25k, 74.3% for AGIs $25k-50k, 74.6% for AGIs $50k-75k, 70.5% for AGIs $75k-100k, 51.5% for AGIs $100k-200k, 8.1% for AGIs over 200k)
Taxable interest for individuals: $562 (reported on 25.2% of returns)
This zip code:
$562
Ohio:
$1,297
(% of AGI for various income ranges: 0.5% for AGIs below $25k, 0.4% for AGIs $25k-50k, 0.4% for AGIs $50k-75k, 0.1% for AGIs $75k-100k, 0.2% for AGIs $100k-200k, 0.1% for AGIs over 200k)
Ordinary dividends: $2,100 (reported on 12.4% of returns)
Here:
$2,100
State:
$5,821
(% of AGI for various income ranges: 0.7% for AGIs below $25k, 0.3% for AGIs $25k-50k, 0.4% for AGIs $50k-75k, 0.6% for AGIs $75k-100k, 2.0% for AGIs $100k-200k)
Net capital gain/loss in AGI: +$1,329 (reported on 8.1% of returns)
Here:
+$1,329
State:
+$11,232
(% of AGI for various income ranges: 0.6% for AGIs $25k-50k, 0.2% for AGIs $50k-75k, 0.6% for AGIs $100k-200k)
Profit/loss from business: +$14,440 (reported on 22.4% of returns)
Here:
+$14,440
State:
+$12,773
(% of AGI for various income ranges: 14.8% for AGIs below $25k, 9.3% for AGIs $25k-50k, 6.6% for AGIs $50k-75k, 6.5% for AGIs $75k-100k, 7.3% for AGIs $100k-200k)
Taxable individual retirement arrangement distribution: $11,627 (reported on 7.1% of returns)
44076:
$11,627
Ohio:
$14,511
(% of AGI for various income ranges: 3.2% for AGIs below $25k, 1.1% for AGIs $25k-50k, 2.5% for AGIs $50k-75k, 5.5% for AGIs $100k-200k)
Total itemized deductions: $16,914 (16% of AGI, reported on 17.1% of returns)
Here:
$16,914
State:
$21,278
Here:
15.6% of AGI
State:
18.8% of AGI
(% of AGI for various income ranges: 4.2% for AGIs below $25k, 4.7% for AGIs $25k-50k, 6.0% for AGIs $50k-75k, 7.5% for AGIs $75k-100k, 7.9% for AGIs $100k-200k, 7.3% for AGIs over 200k)
Charity contributions: $3,648 (reported on 10.0% of returns)
Here:
$3,648
State:
$3,943
(% of AGI for various income ranges: 0.4% for AGIs below $25k, 0.4% for AGIs $25k-50k, 0.7% for AGIs $50k-75k, 0.7% for AGIs $75k-100k, 0.9% for AGIs $100k-200k, 1.6% for AGIs over 200k)
Taxes paid: $6,317 (reported on 17.1% of returns)
44076:
$6,317
State:
$9,568
(% of AGI for various income ranges: 0.9% for AGIs below $25k, 1.3% for AGIs $25k-50k, 1.8% for AGIs $50k-75k, 2.8% for AGIs $75k-100k, 3.6% for AGIs $100k-200k, 3.7% for AGIs over 200k)
Earned income credit: $2,207 (reported on 20.5% of returns)
Here:
$2,207
State:
$2,285
(% of AGI for various income ranges: 6.2% for AGIs below $25k, 1.1% for AGIs $25k-50k)
Percentage of individuals using paid preparers for their 2012 taxes: 66.2%
Here:
66%
State:
51%
(% for various income ranges: 58.8% for AGIs below $25k, 67.6% for AGIs $25k-50k, 71.0% for AGIs $50k-75k, 76.9% for AGIs $75k-100k, 77.8% for AGIs $100k-200k, 100.0% for AGIs over 200k)
Averages for the 2004 tax year for zip code 44076, filed in 2005:
Average Adjusted Gross Income (AGI) in 2004: $32,679 (Individual Income Tax Returns)
Here:
$32,679
State:
$44,480
Salary/wage: $31,461 (reported on 84.2% of returns)
Here:
$31,461
State:
$39,198
(% of AGI for various income ranges: 91.9% for AGIs below $10k, 75.5% for AGIs $10k-25k, 82.7% for AGIs $25k-50k, 85.3% for AGIs $50k-75k, 84.6% for AGIs $75k-100k, 61.4% for AGIs over 100k)
Taxable interest for individuals: $1,075 (reported on 35.0% of returns)
This zip code:
$1,075
Ohio:
$1,532
(% of AGI for various income ranges: 5.8% for AGIs below $10k, 2.0% for AGIs $10k-25k, 1.1% for AGIs $25k-50k, 0.5% for AGIs $50k-75k, 1.2% for AGIs $75k-100k, 0.8% for AGIs over 100k)
Taxable dividends: $1,233 (reported on 15.2% of returns)
Here:
$1,233
State:
$3,496
(% of AGI for various income ranges: 2.1% for AGIs below $10k, 0.7% for AGIs $10k-25k, 0.3% for AGIs $25k-50k, 0.4% for AGIs $50k-75k, 0.5% for AGIs $75k-100k, 2.0% for AGIs over 100k)
Net capital gain/loss: +$5,538 (reported on 11.4% of returns)
Here:
+$5,538
State:
+$8,582
(% of AGI for various income ranges: 1.9% for AGIs below $10k, 0.6% for AGIs $10k-25k, 0.6% for AGIs $25k-50k, 0.2% for AGIs $50k-75k, 0.2% for AGIs $75k-100k, 17.7% for AGIs over 100k)
Profit/loss from business: +$11,867 (reported on 18.3% of returns)
Here:
+$11,867
State:
+$10,813
(% of AGI for various income ranges: 12.4% for AGIs below $10k, 9.4% for AGIs $10k-25k, 6.6% for AGIs $25k-50k, 5.0% for AGIs $50k-75k, 5.8% for AGIs $75k-100k, 6.6% for AGIs over 100k)
IRA payment deduction: $2,067 (reported on 1.4% of returns)
44076:
$2,067
Ohio:
$2,794
Total itemized deductions: $12,301 (22% of AGI, reported on 21.9% of returns)
Here:
$12,301
State:
$17,503
Here:
22.4% of AGI
State:
20.8% of AGI
(% of AGI for various income ranges: 6.6% for AGIs below $10k, 3.8% for AGIs $10k-25k, 6.9% for AGIs $25k-50k, 9.7% for AGIs $50k-75k, 11.6% for AGIs $75k-100k, 13.7% for AGIs over 100k)
Charity contributions deductions: $1,549 (3% of AGI, reported on 14.0% of returns)
Here:
$1,549
State:
$3,087
Here:
2.7% of AGI
State:
3.4% of AGI
(% of AGI for various income ranges: 0.5% for AGIs $10k-25k, 0.6% for AGIs $25k-50k, 0.7% for AGIs $50k-75k, 1.0% for AGIs $75k-100k, 1.0% for AGIs over 100k)
Total tax: $3,376 (reported on 74.1% of returns)
44076:
$3,376
State:
$6,781
(% of AGI for various income ranges: 3.8% for AGIs below $10k, 4.6% for AGIs $10k-25k, 6.4% for AGIs $25k-50k, 8.2% for AGIs $50k-75k, 10.4% for AGIs $75k-100k, 14.3% for AGIs over 100k)
Earned income credit: $1,638 (reported on 15.1% of returns)
Here:
$1,638
State:
$1,696
Percentage of individuals using paid preparers for their 2004 taxes: 61.8%
Here:
62%
State:
55%
(% for various income ranges: 55.9% for AGIs below $10k, 63.3% for AGIs $10k-25k, 63.5% for AGIs $25k-50k, 62.2% for AGIs $50k-75k, 61.5% for AGIs $75k-100k, 64.3% for AGIs over 100k)
Likely homosexual households (counted as self-reported same-sex unmarried-partner households)
Lesbian couples: 0.4% of all households
Gay men: 0.0% of all households
Household received Food Stamps/SNAP in the past 12 months: 249 Household did not receive Food Stamps/SNAP in the past 12 months: 1,528
Women who had a birth in the past 12 months: 125 (69 now married, 54 unmarried) Women who did not have a birth in the past 12 months: 1,178 (309 now married, 869 unmarried)
Housing units in zip code 44076 with a mortgage: 746 (52 second mortgage, 41 both second mortgage and home equity loan) Houses without a mortgage: 41
Median monthly owner costs for units with a mortgage: $1,110 Median monthly owner costs for units without a mortgage: $411
Residents with income below the poverty level in 2022:
This zip code:
17.1%
Whole state:
13.4%
Residents with income below 50% of the poverty level in 2022:
This zip code:
10.7%
Whole state:
7.0%
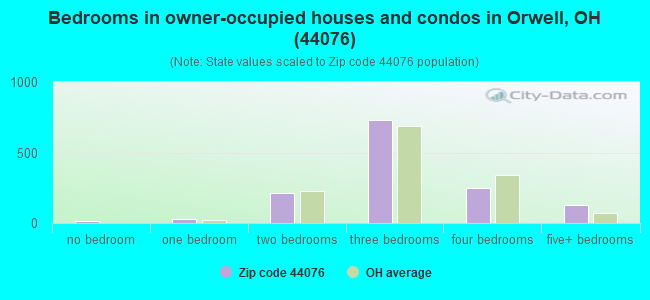
Median number of rooms in houses and condos:
Here:
6.3
State:
6.7
Median number of rooms in apartments:
Here:
4.6
State:
4.4
Notable locations in this zip code not listed on our city pages
Notable locations in zip code 44076: B M Farm (A), Benton Farms (B), Briarwood Farm (C), Buckeye Farms (D), Doubletake Farm (E), Hornung Hops Farms (F), Humphries Farm (G), Kalas Farms (H), Kriegs Farms (I), Magyar Farms (J), Mate's Farms (K), Northside Farms (L), Schafle Dairy Farm (M), Stackhouse Farm (N), Touch of Class Farm (O), Gruskiewicz Farms (P), Orwell Volunteer Fire Department (Q). Display/hide their locations on the map
Cemeteries: South Orwell Cemetery (1), Southeast Hartsgrove Cemetery (2), North Orwell Cemetery (3), Colebrook South Cemetery (4), Latimer Cemetery (5), North Colebrook Cemetery (6). Display/hide their locations on the map
695 married couples with children.
196 single-parent households (46 men, 150 women).
83.8% of residents of 44076 zip code speak English at home.
17.6% of residents speak other Indo-European language at home (60% very well, 39% well, 1% not well).
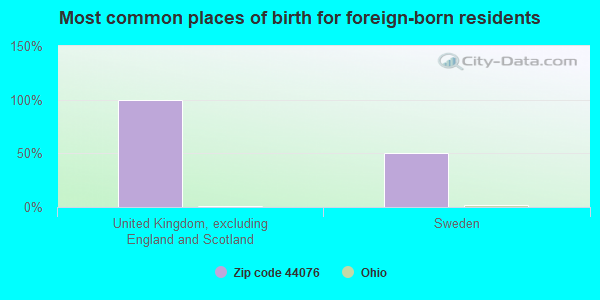
Foreign born population: 2 (0.0%) (0.0% of them are naturalized citizens)
:
0.0%
Whole state:
5.0%
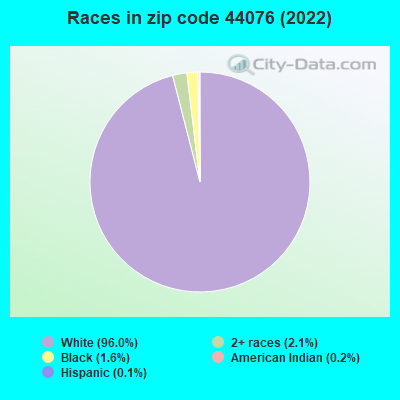
100%United Kingdom, excluding England and Scotland
50%Sweden
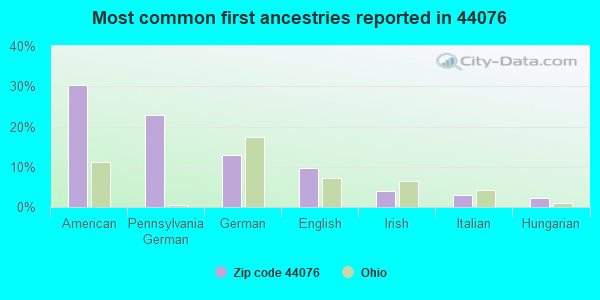
30%American
23%Pennsylvania German
13%German
10%English
4%Irish
3%Italian
2%Hungarian
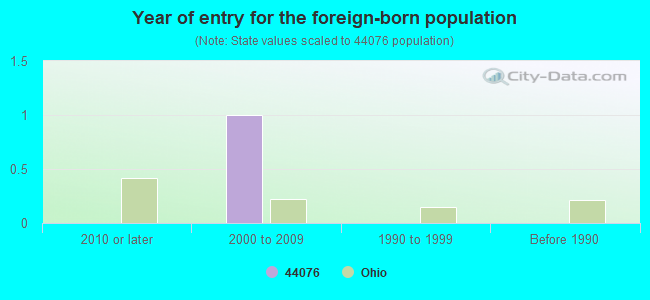
Year of entry for the foreign-born population
02010 or later
12000 to 2009
01990 to 1999
0Before 1990
Facilities with environmental interests located in this zip code:
CHAMPION STEEL CO * (8247 PENNIMAN ROAD in ORWELL, OH)
AIR MINOR (AIRS/AFS) STATE MASTER (Ohio general info) - AIR MAJOR, TRIS-44076CHMPN8247P, TRI REPORTER TRI REPORTER (Tracking of toxic chemicals releasing facilities) Business SIC classification: COLD-ROLLED STEEL SHEET, STRIP, AND BARS; STEEL FOUNDRIES; FABRICATED STRUCTURAL METAL; IRON AND STEEL FORGINGS; NONFERROUS FORGINGS; SPECIAL DIES AND TOOLS, DIE SETS, JIGS AND FIXTURES, AND INDUSTRIAL MOLDS
Housing units lacking complete plumbing facilities: 3.8% Housing units lacking complete kitchen facilities: 3.2%
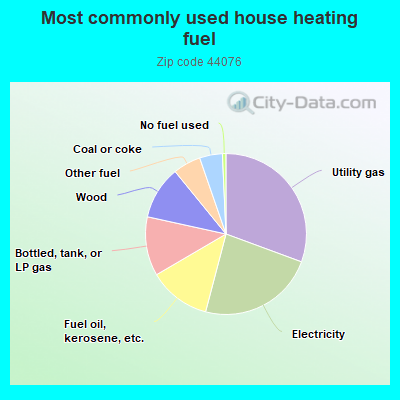
30.7%Utility gas
23.5%Electricity
12.5%Fuel oil, kerosene, etc.
11.9%Bottled, tank, or LP gas
10.7%Wood
5.6%Other fuel
4.6%Coal or coke
0.7%No fuel used
Population in 1990: 3,814. Population change in the 1990s: +705 (+18.5%).
Place of birth for U.S.-born residents:
This state: 4,296
Northeast: 225
Midwest: 75
South: 114
West: 24
59% of the 44076 zip code residents lived in the same house 5 years ago. Out of people who lived in different houses, 44% lived in this county. Out of people who lived in different counties, 50% lived in Ohio.
91% of the 44076 zip code residents lived in the same house 1 year ago. Out of people who lived in different houses, 65% moved from this county. Out of people who lived in different houses, 31% moved from different county within same state. Out of people who lived in different houses, 2% moved from different state. Out of people who lived in different houses, 1% moved from abroad.
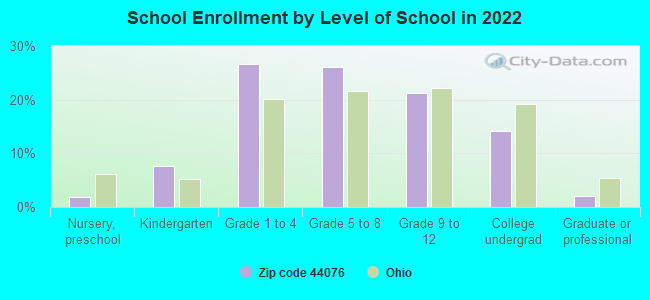
Private vs. public school enrollment:
Students in private schools in grades 1 to 8 (elementary and middle school): 181
Here:
38.5%
Ohio:
16.0%
Students in private schools in grades 9 to 12 (high school):
Here:
0.0%
Ohio:
13.1%
Students in private undergraduate colleges: 55
Here:
44.8%
Ohio:
22.3%
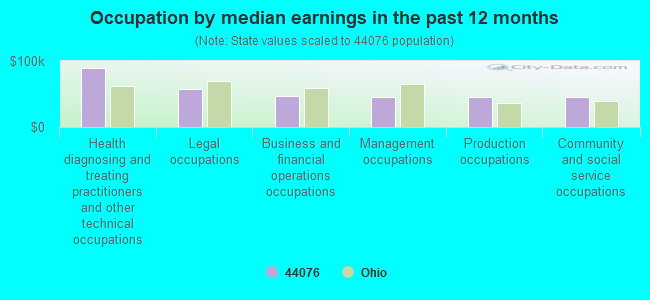
Occupation by median earnings in the past 12 months ($)
89,230Health diagnosing and treating practitioners and other technical occupations
57,505Legal occupations
47,598Business and financial operations occupations
45,514Management occupations
44,975Production occupations
44,946Community and social service occupations
Companies with federal contracts located in this zip code:
ORWELL TELEPHONE COMPANY (70 SOUTH MAPLE STREET in ORWELL, OH) : -$17,814 in 6 contractsfrom 2004 to 2005
Contracts for Telephone and Telegraph Equipment by U.S. Army Corps of Engineers - civil program financing only, Army Signed by year:2000: $0; 2001: $0; 2002: $0; 2003: $0; 2004: -$12,000; 2005: -$5,814; 2006: $0.
Biggest contracts:
$0 with U.S. Army Corps of Engineers - civil program financing only for Telephone and Telegraph Equipment. Signed on 2004-03-04. Completion date: 2000-09-06.
$0 with Army for Telephone and Telegraph Equipment. Signed on 2004-03-04. Completion date: 2000-09-06.
-$2,907 with U.S. Army Corps of Engineers - civil program financing only for Telephone and Telegraph Equipment. Signed on 2005-01-13. Completion date: 2005-01-13.
-$2,907 with Army for Telephone and Telegraph Equipment. Signed on 2005-01-13. Completion date: 2005-01-13.
Top industries in this zip code by the number of employees in 2005:
Accommodation and Food Services: Limited-Service Restaurants (20-49 employees: 2 establishments)
Health Care and Social Assistance: Services for the Elderly and Persons with Disabilities (20-49: 1)
Health Care and Social Assistance: Nursing Care Facilities (20-49: 1)
People in group quarters in 2010:
45 people in nursing facilities/skilled-nursing facilities
People in group quarters in 2000:
39 people in nursing homes
4 people in other noninstitutional group quarters
Fatal accident statistics in 2014:
Fatal accident count: 1
Vehicles involved in fatal accidents: 2
Fatal accidents caused by drunken drivers: 0
Fatalities: 1
Persons involved in fatal accidents: 5
Pedestrians involved in fatal accidents: 0
Fatal accident statistics in 2013:
Fatal accident count: 2
Vehicles involved in fatal accidents: 2
Fatal accidents caused by drunken drivers: 1
Fatalities: 2
Persons involved in fatal accidents: 3
Pedestrians involved in fatal accidents: 3
Home Mortgage Disclosure Act Aggregated Statistics For Year 2009 (Based on 2 partial tracts)
A) FHA, FSA/RHS & VA Home Purchase Loans
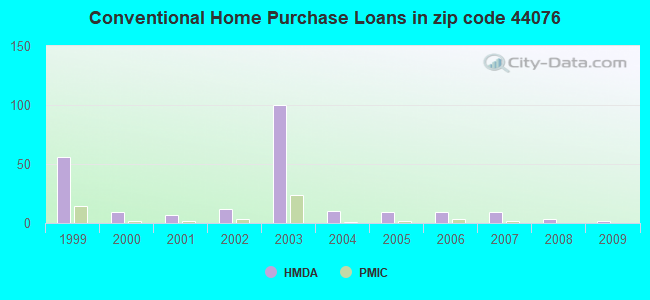
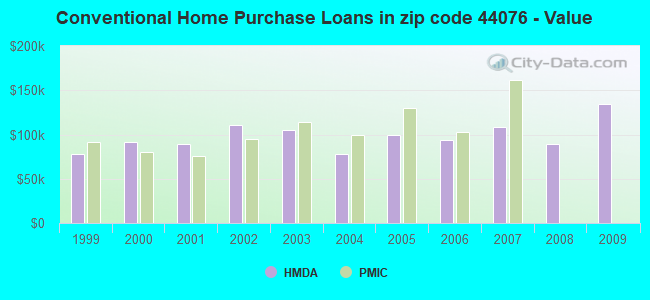
B) Conventional Home Purchase Loans
C) Refinancings
D) Home Improvement Loans
F) Non-occupant Loans on < 5 Family Dwellings (A B C & D)
G) Loans On Manufactured Home Dwelling (A B C & D)
Number
Average Value
Number
Average Value
Number
Average Value
Number
Average Value
Number
Average Value
Number
Average Value
LOANS ORIGINATED
1
$83,100
2
$133,905
15
$110,568
2
$30,410
1
$96,700
1
$55,920
APPLICATIONS APPROVED, NOT ACCEPTED
0
$0
1
$59,710
2
$96,695
0
$0
0
$0
0
$0
APPLICATIONS DENIED
0
$0
1
$111,180
7
$115,187
2
$57,705
0
$0
0
$0
APPLICATIONS WITHDRAWN
0
$0
0
$0
2
$124,770
0
$0
0
$0
0
$0
FILES CLOSED FOR INCOMPLETENESS
0
$0
0
$0
0
$0
0
$0
0
$0
0
$0
Aggregated Statistics For Year 2008 (Based on 2 partial tracts)
A) FHA, FSA/RHS & VA Home Purchase Loans
B) Conventional Home Purchase Loans
C) Refinancings
D) Home Improvement Loans
F) Non-occupant Loans on < 5 Family Dwellings (A B C & D)
G) Loans On Manufactured Home Dwelling (A B C & D)
Number
Average Value
Number
Average Value
Number
Average Value
Number
Average Value
Number
Average Value
Number
Average Value
LOANS ORIGINATED
2
$129,000
3
$89,567
11
$103,035
3
$36,020
1
$79,320
1
$43,450
APPLICATIONS APPROVED, NOT ACCEPTED
0
$0
0
$0
2
$79,875
0
$0
1
$8,690
0
$0
APPLICATIONS DENIED
1
$95,580
2
$108,725
10
$140,364
3
$16,040
1
$92,680
0
$0
APPLICATIONS WITHDRAWN
1
$59,710
0
$0
4
$134,015
1
$17,600
0
$0
0
$0
FILES CLOSED FOR INCOMPLETENESS
0
$0
0
$0
0
$0
0
$0
0
$0
0
$0
Aggregated Statistics For Year 2007 (Based on 2 partial tracts)
B) Conventional Home Purchase Loans
C) Refinancings
D) Home Improvement Loans
F) Non-occupant Loans on < 5 Family Dwellings (A B C & D)
Number
Average Value
Number
Average Value
Number
Average Value
Number
Average Value
LOANS ORIGINATED
9
$108,677
16
$89,886
5
$32,038
1
$29,410
APPLICATIONS APPROVED, NOT ACCEPTED
1
$127,890
3
$90,233
2
$26,735
0
$0
APPLICATIONS DENIED
2
$83,885
10
$121,560
2
$30,190
1
$44,560
APPLICATIONS WITHDRAWN
1
$79,540
6
$96,212
0
$0
0
$0
FILES CLOSED FOR INCOMPLETENESS
0
$0
1
$120,530
0
$0
0
$0
Aggregated Statistics For Year 2006 (Based on 2 partial tracts)
B) Conventional Home Purchase Loans
C) Refinancings
D) Home Improvement Loans
F) Non-occupant Loans on < 5 Family Dwellings (A B C & D)
G) Loans On Manufactured Home Dwelling (A B C & D)
Number
Average Value
Number
Average Value
Number
Average Value
Number
Average Value
Number
Average Value
LOANS ORIGINATED
9
$93,948
21
$89,863
6
$35,833
2
$47,455
1
$30,750
APPLICATIONS APPROVED, NOT ACCEPTED
4
$97,198
5
$108,102
1
$64,830
1
$83,550
1
$59,490
APPLICATIONS DENIED
2
$93,910
19
$118,869
5
$46,610
0
$0
0
$0
APPLICATIONS WITHDRAWN
1
$172,220
14
$112,848
1
$36,540
0
$0
0
$0
FILES CLOSED FOR INCOMPLETENESS
1
$93,800
6
$114,185
0
$0
0
$0
0
$0
Aggregated Statistics For Year 2005 (Based on 2 partial tracts)
A) FHA, FSA/RHS & VA Home Purchase Loans
B) Conventional Home Purchase Loans
C) Refinancings
D) Home Improvement Loans
F) Non-occupant Loans on < 5 Family Dwellings (A B C & D)
G) Loans On Manufactured Home Dwelling (A B C & D)
Number
Average Value
Number
Average Value
Number
Average Value
Number
Average Value
Number
Average Value
Number
Average Value
LOANS ORIGINATED
1
$57,930
9
$99,443
18
$100,272
5
$52,136
1
$85,560
1
$96,920
APPLICATIONS APPROVED, NOT ACCEPTED
0
$0
3
$86,817
5
$136,576
0
$0
0
$0
0
$0
APPLICATIONS DENIED
0
$0
5
$93,798
20
$111,288
3
$19,310
1
$70,850
2
$95,135
APPLICATIONS WITHDRAWN
0
$0
2
$68,620
12
$130,821
3
$103,677
0
$0
1
$76,870
FILES CLOSED FOR INCOMPLETENESS
0
$0
0
$0
2
$89,900
0
$0
0
$0
0
$0
Aggregated Statistics For Year 2004 (Based on 2 partial tracts)
B) Conventional Home Purchase Loans
C) Refinancings
D) Home Improvement Loans
F) Non-occupant Loans on < 5 Family Dwellings (A B C & D)
G) Loans On Manufactured Home Dwelling (A B C & D)
Number
Average Value
Number
Average Value
Number
Average Value
Number
Average Value
Number
Average Value
LOANS ORIGINATED
10
$77,891
23
$96,608
4
$56,758
2
$80,655
1
$83,550
APPLICATIONS APPROVED, NOT ACCEPTED
2
$45,005
7
$117,543
1
$45,230
0
$0
0
$0
APPLICATIONS DENIED
2
$69,515
14
$108,694
2
$26,290
0
$0
1
$51,910
APPLICATIONS WITHDRAWN
1
$112,510
12
$109,952
1
$63,050
0
$0
1
$57,480
FILES CLOSED FOR INCOMPLETENESS
1
$68,620
2
$102,710
0
$0
0
$0
0
$0
Aggregated Statistics For Year 2003 (Based on 4 partial tracts)
A) FHA, FSA/RHS & VA Home Purchase Loans
B) Conventional Home Purchase Loans
C) Refinancings
D) Home Improvement Loans
E) Loans on Dwellings For 5+ Families
F) Non-occupant Loans on < 5 Family Dwellings (A B C & D)
Number
Average Value
Number
Average Value
Number
Average Value
Number
Average Value
Number
Average Value
Number
Average Value
LOANS ORIGINATED
14
$109,450
100
$105,299
317
$98,902
37
$21,063
1
$115,410
21
$80,227
APPLICATIONS APPROVED, NOT ACCEPTED
0
$0
12
$89,204
67
$95,947
11
$24,515
0
$0
5
$78,002
APPLICATIONS DENIED
5
$102,192
26
$107,169
173
$100,794
33
$15,612
0
$0
5
$137,470
APPLICATIONS WITHDRAWN
5
$115,366
13
$105,647
129
$106,666
9
$23,278
0
$0
3
$92,997
FILES CLOSED FOR INCOMPLETENESS
1
$121,710
9
$92,602
19
$105,487
2
$12,065
0
$0
0
$0
Aggregated Statistics For Year 2002 (Based on 2 partial tracts)
B) Conventional Home Purchase Loans
C) Refinancings
D) Home Improvement Loans
F) Non-occupant Loans on < 5 Family Dwellings (A B C & D)
Number
Average Value
Number
Average Value
Number
Average Value
Number
Average Value
LOANS ORIGINATED
12
$111,122
36
$88,953
4
$21,890
2
$69,960
APPLICATIONS APPROVED, NOT ACCEPTED
1
$96,700
8
$96,026
0
$0
0
$0
APPLICATIONS DENIED
2
$80,765
18
$86,409
2
$22,950
0
$0
APPLICATIONS WITHDRAWN
1
$95,580
9
$89,269
1
$27,630
0
$0
FILES CLOSED FOR INCOMPLETENESS
0
$0
1
$113,630
0
$0
0
$0
Aggregated Statistics For Year 2001 (Based on 2 partial tracts)
A) FHA, FSA/RHS & VA Home Purchase Loans
B) Conventional Home Purchase Loans
C) Refinancings
D) Home Improvement Loans
F) Non-occupant Loans on < 5 Family Dwellings (A B C & D)
Number
Average Value
Number
Average Value
Number
Average Value
Number
Average Value
Number
Average Value
LOANS ORIGINATED
1
$65,280
7
$89,629
30
$82,139
7
$12,986
2
$67,730
APPLICATIONS APPROVED, NOT ACCEPTED
0
$0
2
$52,690
7
$84,187
0
$0
0
$0
APPLICATIONS DENIED
0
$0
4
$73,525
16
$88,632
3
$6,387
0
$0
APPLICATIONS WITHDRAWN
0
$0
1
$59,040
8
$83,271
1
$18,720
0
$0
FILES CLOSED FOR INCOMPLETENESS
0
$0
0
$0
2
$68,735
0
$0
0
$0
Aggregated Statistics For Year 2000 (Based on 2 partial tracts)
A) FHA, FSA/RHS & VA Home Purchase Loans
B) Conventional Home Purchase Loans
C) Refinancings
D) Home Improvement Loans
F) Non-occupant Loans on < 5 Family Dwellings (A B C & D)
Number
Average Value
Number
Average Value
Number
Average Value
Number
Average Value
Number
Average Value
LOANS ORIGINATED
1
$124,990
9
$91,051
14
$76,006
8
$25,594
1
$32,750
APPLICATIONS APPROVED, NOT ACCEPTED
0
$0
1
$60,600
5
$56,904
1
$21,610
0
$0
APPLICATIONS DENIED
0
$0
3
$44,410
13
$89,463
3
$17,453
0
$0
APPLICATIONS WITHDRAWN
0
$0
0
$0
7
$65,949
2
$10,915
1
$32,750
FILES CLOSED FOR INCOMPLETENESS
0
$0
0
$0
1
$49,910
0
$0
0
$0
Aggregated Statistics For Year 1999 (Based on 2 partial tracts)
A) FHA, FSA/RHS & VA Home Purchase Loans
B) Conventional Home Purchase Loans
C) Refinancings
D) Home Improvement Loans
F) Non-occupant Loans on < 5 Family Dwellings (A B C & D)
Detailed PMIC statistics for the following Tracts:0014.00
, 9304.00
2003 - 2018 National Fire Incident Reporting System (NFIRS) incidents
According to the data from the years 2003 - 2018 the average number of fires per year is 47. The highest number of reported fire incidents - 73 took place in 2012, and the least - 13 in 2004. The data has a growing trend.
When looking into fire subcategories, the most reports belonged to: Structure Fires (48.7%), and Outside Fires (39.9%).
Fire incident types reported to NFIRS in Zip Code 44076


 Nearest zip codes: 44450, 44085, 44402, 44439, 44084, 44099.
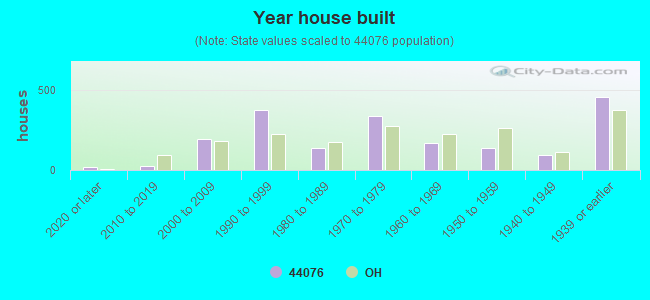


 According to the data from the years 2003 - 2018 the average number of fires per year is 47. The highest number of reported fire incidents - 73 took place in 2012, and the least - 13 in 2004. The data has a growing trend.
 When looking into fire subcategories, the most reports belonged to: Structure Fires (48.7%), and Outside Fires (39.9%).